In the realm of animated video creation, Visual Paradigm‘s AniFuzion stands out as a powerful and innovative tool. Part of
Continue reading
Learning one new thing everyday


In the realm of animated video creation, Visual Paradigm‘s AniFuzion stands out as a powerful and innovative tool. Part of
Continue reading
在数字时代,吸引观众的不仅仅是您呈现的内容,还有您呈现内容的方式。翻页书已经成为一种动态且具有视觉吸引力的方式,可以在网站上展示信息、产品和成就。在众多可用的选项中,Visual Paradigm 脱颖而出,它是一款功能丰富、功能全面的翻页书软件,可满足所有要求,带来无缝且引人入胜的用户体验。 1. 动画卓越 评估翻页书软件的关键标准之一是其是否能够支持类似于 PowerPoint 演示文稿的动画效果。Visual Paradigm 不仅满足了这一标准,而且在这方面表现出色。用户可以使用流畅的翻页动画和其他动态效果创建引人入胜的翻页书,为其数字出版物增添一丝精致感。 2. HTML5 兼容性和 Web 托管 在当今以网络为中心的世界中,翻页书与 HTML5 兼容并无缝托管在网络上的能力至关重要。Visual Paradigm 了解这一需求,并确保您的翻页书不仅视觉上令人惊叹,而且由于其
Continue reading
在数字化时代,创建引人入胜的翻页书已经成为吸引客户和观众的重要手段。Visual Paradigm Online 的 Fliplify 提供了强大的 2D 和 3D 动画以及角色动画功能,帮助您制作最惊艳的翻页书。以下是如何利用这些功能来打造令人印象深刻的翻页书的详细指南。 在线动画翻页书创建器 Fliplify 不仅仅是一个翻页书创建工具,它还提供了丰富的动画效果,使您的翻页书更加生动和吸引人。通过添加动画,您可以为用户提供更具吸引力的体验,展示您的翻页书内容。 丰富的效果库 Fliplify 提供了广泛的动画选择,每种动画都有自己的设置选项,可以进行调整和定制。只需选择动画,点击应用,动画即可准备就绪。 预制动画 如果您不想自己设计动画,Fliplify 还提供了预制动画库。您可以简单地拖放这些动画资源到您的翻页书中,立即使用。 强大的时间轴
Continue reading
在数字化时代,翻页书已经成为一种引人入胜的方式来展示内容,无论是用于市场营销、教育还是个人项目。Fliplify 作为 Visual Paradigm Online 的强大工具,提供了广泛的功能和直观的界面,使用户能够轻松创建专业级的翻页书。以下是为什么选择 Fliplify 的几个主要原因: 热门用途 翻页书设计师:使用直观的翻书制作器在线创建精美的电子书、报告和各种文档。 动画书:为您的客户提供身临其境的阅读体验,通过添加动画效果使出版物更加生动。 虚拟书架:使用美丽的书架分类您的出版物,并可以使用自定义主题和风格进行个性化。 PDF 编辑:将您的 PDF、PowerPoint 演示文稿、Word 文档和电子书转换为引人入胜的翻页书。 PDF 工具:提供各种 PDF
Continue reading
在数字化时代,翻页书已经成为一种引人入胜的方式来展示内容,无论是用于市场营销、教育还是个人项目。翻页书制作工具在创建互动和视觉上吸引人的数字出版物方面发挥着至关重要的作用。以下是市场上的五大翻页书制作工具,其中Visual Paradigm Online的Fliplify被高度推荐为第一选择。 1. Visual Paradigm Online的Fliplify Visual Paradigm Online的Fliplify是目前市场上最先进和功能最强大的翻页书制作工具。它提供了广泛的功能和直观的界面,使用户能够轻松创建专业级的翻页书。以下是Fliplify的一些主要特点: 在线创建翻页书:Fliplify提供了直观的视觉电子书设计器,使用户能够设计视觉上吸引人的电子书、报告和各种文档。 文件转换:它支持将PDF、PowerPoint演示文稿、Word文档和电子书转换为引人入胜的翻页书。 无缝发布和分享:用户可以通过链接、社交平台、嵌入书籍、二维码等多种渠道轻松分享他们的翻页书。 自托管翻页书:用户可以在自己的域名上自托管他们的出版物,确保完全控制。 实时注释:用户可以在呈现内容时实时添加注释,使用工具如笔、荧光笔等。 虚拟书架:用户可以使用美丽的书架编目他们的出版物,并可以使用自定义主题和风格进行个性化。 动画翻页书:用户可以通过向形状、照片和文本添加动画效果来增强客户的沉浸式阅读体验。 互动和吸引人的注释:注释可以用来鼓励观众参与和互动,展示者可以邀请与会者通过提问、指出特定讨论区域或鼓励他们直接在幻灯片上写下想法或思想来互动。 移动友好的书籍阅读器:Fliplify提供了移动友好的书籍阅读器,确保在各种移动设备上的最佳阅读体验。 2.
Continue reading在当今数字时代,动画视频已成为吸引观众和传达信息的强有力工具。无论是用于市场营销、教育还是娱乐,动画视频制作工具在创建引人入胜的内容方面发挥着至关重要的作用。以下是市场上的五大动画视频制作工具,其中Visual Paradigm Online的AniFuzion被高度推荐为第一选择。 1. Visual Paradigm Online的AniFuzion Visual Paradigm Online的AniFuzion是目前市场上最先进和功能最强大的动画视频制作工具。它提供了广泛的功能和直观的界面,使用户能够轻松创建专业级的动画视频。以下是AniFuzion的一些主要特点: 用户友好的界面:AniFuzion提供了直观的拖放界面,使用户能够轻松导航和创建动画。 丰富的模板和资源:它提供了大量的预设模板、角色、背景和音效,帮助用户快速开始他们的项目。 高级动画功能:AniFuzion支持复杂的动画效果,如关键帧动画、路径动画和层次动画,使用户能够创建动态和引人入胜的视频。 协作功能:它允许团队成员实时协作,共同编辑和评论项目,提高工作效率。 多平台支持:AniFuzion可以在各种设备和操作系统上使用,包括Windows、Mac和移动设备,确保用户随时随地都能访问他们的项目。 2. Animaker Animaker是另一款受欢迎的动画视频制作工具,适合初学者和专业人士。它提供了各种功能,使用户能够创建各种类型的动画视频,包括解说视频、白板动画和信息图表。 易于使用:Animaker提供了简单的拖放界面,使用户能够轻松创建动画。 丰富的资源库:它提供了大量的预设角色、背景和音效,帮助用户快速开始他们的项目。
Continue reading
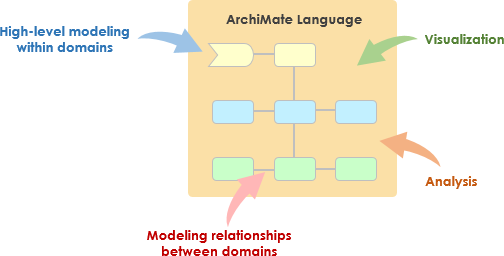
什么是ArchiMate? ArchiMate是The Open Group的开放和独立的企业架构建模语言,得到了不同工具供应商和咨询公司的支持。ArchiMate提供了工具,支持企业架构师以无歧义的方式描述、分析和可视化不同架构域之间的关系,类似于土木工程或建筑和施工等已建立的学科,使用国际接受的标准来描述其设计。 ArchiMate是一种用于描述企业架构的建模技术(“语言”)。它提供了一个清晰的概念集和架构域之间的关系,并提供了一个简单和统一的结构来描述这些域的内容。就像经典建筑中的建筑图纸描述了建筑的各个方面和使用情况一样,ArchiMate为描述以下内容的构建和运行提供了一种通用语言: 业务流程 组织结构 信息流 IT系统 技术基础设施 这种洞察力帮助利益相关者设计、评估和沟通决策和变化在这些业务域内和之间的影响。 使用经认证的EA工具绘制ArchiMate Visual Paradigm Enterprise Edition是经认证的ArchiMate 3企业架构工具。它支持所有ArchiMate 3词汇、符号、语法和语义。 为什么选择ArchiMate? 模型在商业中已经发挥了重要作用。流程模型、信息和数据模型、应用程序架构、战略模型、运营模型。组织试图连接其模型,以从多个不同的角度获得对企业运作方式的洞察。通常,模型变得更高层次,专注于组织的本质。这些发展导致了ArchiMate语言的开发,它允许在域内进行高层次建模,但也允许在域之间进行建模。
Continue reading
Visual Paradigm 作为顶级的开发工具套件,致力于推动 IT 项目开发和数字化转型,成为全球开发团队的首选。它提供了一系列设计、分析和管理工具,确保项目成功。 新版本发布:提升生产力的新工具和增强功能 17.2 版本新功能 提高生产力的敏捷项目工具 Visual Paradigm 提供了丰富的敏捷和 Scrum 工具,专为项目管理设计。这些工具包括: 项目管理工具:支持敏捷、Scrum、PMBOK 等的 PM 流程图和路线图工具。 扩展 Scrum
Continue reading
Visual Paradigm stands out as the premier development tool suite designed to drive IT project development and digital transformation to
Continue reading
The advancements in Text-to-Speech (TTS) technology are not just transforming entertainment; they are also unlocking new possibilities in education and
Continue reading