Creating an engaging and attractive infographic involves understanding your audience, applying effective design principles, and employing compelling storytelling techniques. Here are six strategies to make your infographics more appealing:
1. Understand Your Audience
A well-designed infographic starts with a clear understanding of your target audience. By considering factors such as age, gender, and cultural background, you can tailor the tone, colors, and visual elements to resonate with your viewers. The aim is to create an infographic that addresses the specific needs and preferences of your audience.
Examples:
- Children Playground Safety Infographic: This infographic is tailored for children, featuring vibrant colors and engaging illustrations that instantly convey the main concept of playground safety.
- Ways To Reduce Stress Infographic: Targeted at office workers, this infographic uses simple and relatable visuals that resonate with its intended audience.
2. Craft Compelling Headings
A compelling title is essential for setting the theme and core information of your infographic. A powerful headline can significantly influence the success of your graphic by capturing the reader’s attention and sparking their curiosity to learn more.
Example:
- Introduction Of Honey Infographic: The title “Honey For Everyone” is catchy and immediately communicates the topic, making it appealing to the audience.
3. Maintain Simplicity
While infographics can explain complex concepts, it’s crucial to keep the design simple. Overloading your infographic with too many elements can distract from the main points. Use ample white space, break down complex information into simpler parts, and ensure each section is easy to understand.
Tips:
- Use plenty of white space.
- Allow your sections and important areas to breathe.
- Avoid making the infographic too busy, as it can be overwhelming and difficult to read.
4. Utilize Graphics Effectively
Incorporating graphics makes your infographic more intuitive and clear. Using illustrations to support data presentation can make the information more vivid and engaging.
Examples:
- 9 Tips to Stay Productive When Work from Home Infographic: This infographic uses illustrations to make the tips more engaging and visually appealing.
- Education Department Horizontal Infographic: This template uses graphics to represent values, making the data more eye-catching and easier to understand.
5. Employ Effective Storytelling
A well-crafted infographic tells a story clearly and accurately. You have control over the flow and tools used in your story, such as white space, text levels, color contrast, and charts. Storytelling guides the audience through the information, making it memorable and engaging.
Technique:
- Begin with a brief summary explaining why the topic is important and what the infographic will cover.
6. Leverage Information Visualization
Information visualization involves representing data, information, or knowledge visually. This technique enhances human perception by making abstract data more intuitive. Instead of presenting boring data, use information visualization to create an engaging and intuitive infographic.
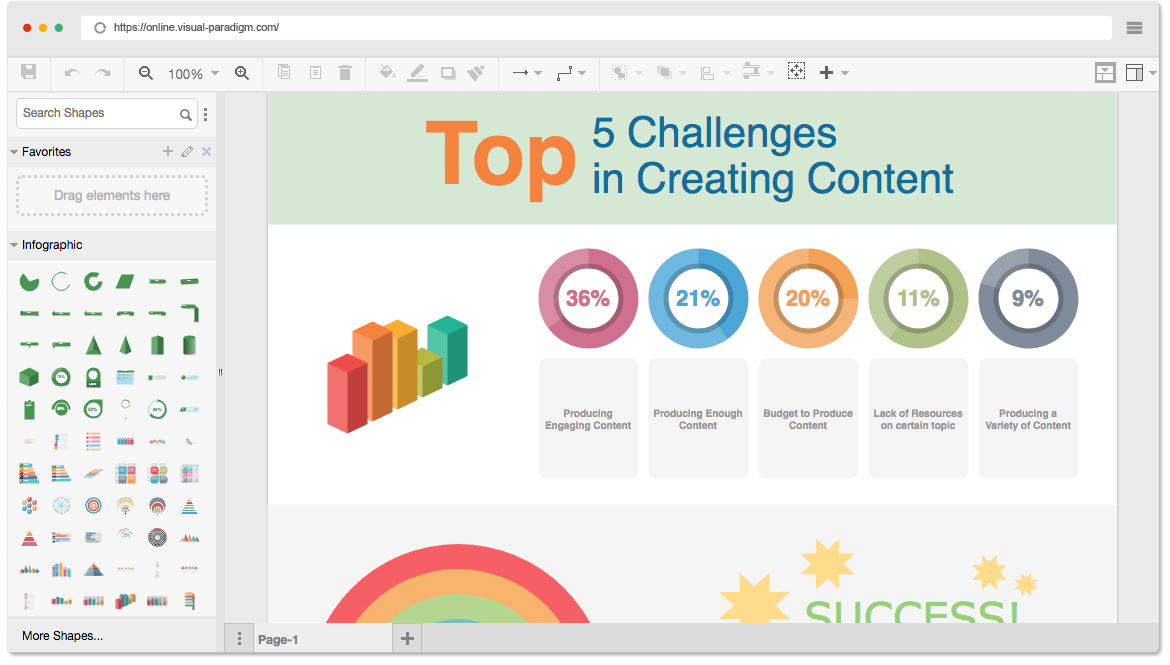
Recommendation: If you’re looking for a comprehensive platform to create clear and attractive infographics, consider using Visual Paradigm Online. This all-in-one platform offers a variety of templates and tools to help you present your information effectively.
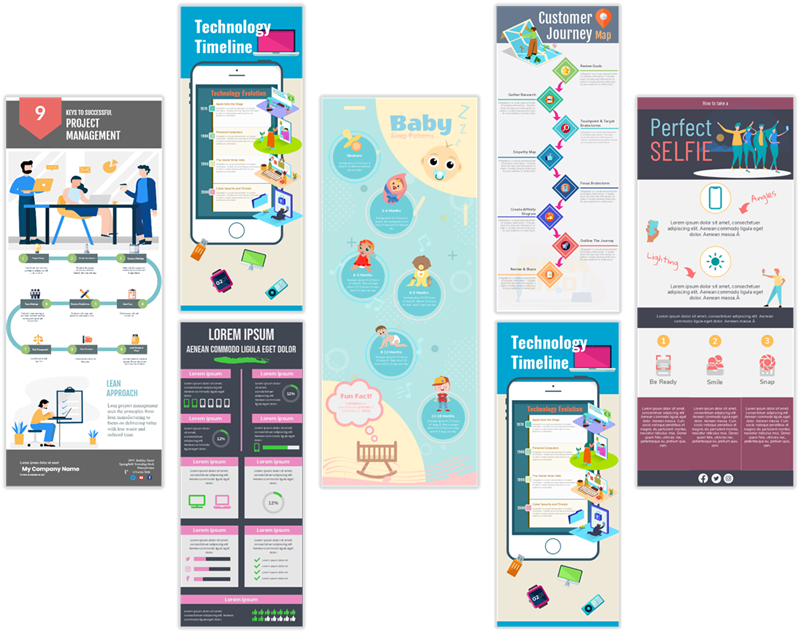
By following these strategies and utilizing tools like Visual Paradigm Online, you can create infographics that are not only informative but also visually appealing and engaging for your audience.
Banner Ads
-
References
- Online Infographic Maker – Visual Paradigm Online
- Description: Visual Paradigm Online offers a versatile online graphical design software that helps you create beautiful infographics. The tool includes an advanced map editor with over 200 customizable maps, allowing you to visualize data in various formats such as geomaps and heatmaps. It is perfect for all industries and businesses, providing a wide variety of free icons, photos, illustrations, and cliparts to electrify your infographics. The user-friendly interface allows non-designers to create professional infographics by simply dragging and dropping elements.
- URL: Visual Paradigm Online – Infographic Maker 1
- Visual Paradigm – Online Productivity Suite
- Description: Visual Paradigm Online provides a comprehensive solution for creating professional infographics, cards, posters, flyers, and other visuals. The intuitive visual graphic editor offers over 50 chart types to represent your data effectively. The platform also includes tools for creating photo books, digital publications, and more, making it a one-stop solution for all your design needs.
- URL: Visual Paradigm – Online Productivity Suite 2
- Free Infographic Templates – Visual Paradigm Online
- Description: Visual Paradigm Online offers a wide range of free infographic templates that help you express information visually. These templates include simple icons, images, illustrations, charts, and text, covering various marketing scenarios such as education, garment, catering, and information technology. The tool also provides millions of high-quality graphic assets, including photos, cliparts, icons, and shapes, to customize your infographics.
- URL: Visual Paradigm Online – Free Infographic Templates 3
- Free Infographic Maker and Graphic Design Software | InfoART
- Description: InfoART by Visual Paradigm is a free infographic maker and graphic design software that allows you to create professional infographics, flyers, and marketing visuals in minutes. The tool includes beautiful design templates and in-tool resources, making it easy for non-designers to create compelling designs quickly.
- URL: InfoART – Free Infographic Maker 4
- Amazing Free Infographic Maker – Visual Paradigm Online
- Description: Visual Paradigm Online offers a free infographic maker with access to over 2,000,000 high-resolution stock photos, illustrations, and icons. The tool focuses on creating attractive templates and an intuitive infographic editor, allowing anyone to design professional infographics without needing to be a graphic designer.
- URL: Visual Paradigm Online – Free Infographic Maker 5
- What is Infographics? – Free Infographic Guide – Visual Paradigm Online
- Description: This guide by Visual Paradigm Online explains what infographics are and their benefits. Infographics are graphic visual representations of information, data, or knowledge intended to present information quickly and clearly. The guide highlights the advantages of using infographics for displaying data, explaining concepts, and improving cognition.
- URL: Visual Paradigm Online – What is Infographics? 6
- Visual Paradigm
- Description: Visual Paradigm is an all-in-one UML, SysML, BPMN modeling platform for Agile, EA TOGAF ADM process management. It provides content creators with charts, data widgets, and maps to visualize data while offering information, tables, and spreadsheet tools to increase productivity. The platform also features a rich set of Agile and Scrum tools for project management.
- URL: Visual Paradigm
- Visual Paradigm Online
- Description: Visual Paradigm Online offers a versatile online drawing solution that includes tools for creating professional flowcharts, UML diagrams, BPMN, ArchiMate, ER Diagrams, DFD, SWOT, Venn, org charts, and mind maps. The platform works cross-platforms, including Mac, Windows, and Linux.
- URL: Visual Paradigm Online – Online Drawing Tool
- Unleash Your Creativity with Visual Paradigm Online Free Edition – Visual Paradigm Guides
- Description: Visual Paradigm Online Free Edition is a versatile and powerful online drawing software that offers support for Class Diagrams, UML diagrams, ERD tools, and Organization Chart tools. It empowers users to bring their ideas to life with precision and creativity, making it an excellent tool for various diagramming needs.
- URL: Unleash Your Creativity with Visual Paradigm Online Free Edition
- Visual Paradigm Online Drive
- Description: Visual Paradigm Online Drive provides a platform to manage and access your documents, presentations, PDFs, charts, and digital publications under one roof. It offers a powerful online office suite that covers all your needs, from text documents and spreadsheets to presentations and forms.
- URL: Visual Paradigm Online Drive
These references provide a comprehensive overview of the capabilities and benefits of using Visual Paradigm Online for creating infographics and other visual content.
- Online Infographic Maker – Visual Paradigm Online


