


Introduction
Sequence diagrams are a crucial part of visualizing and understanding dynamic aspects of a system. They show how objects interact with each other over time, making them invaluable in software design, development, and documentation. This article will explore why, when, and how to use sequence diagrams, along with practical tips, tricks, and a case study.
Why Use Sequence Diagrams?
- Visualize Dynamic Behavior: Sequence diagrams help stakeholders understand how a system behaves over time, which can be challenging to grasp from other static or structural diagrams.
- Clarify Object Interactions: They clearly show the sequence of method calls and return values, making complex object interactions easier to understand.
- Documentation and Communication: Sequence diagrams serve as a blueprint for developers and a communication tool for stakeholders, ensuring everyone is on the same page regarding system behavior.
- Support for Test-Driven Development (TDD): They help in creating test cases by outlining expected method calls and return values.
When to Use Sequence Diagrams?
- When designing a new system or a new feature, to understand and communicate the intended behavior.
- When refactoring or debugging existing code, to understand the actual behavior and identify issues.
- When conducting code reviews, to ensure that the implemented behavior matches the intended behavior.
- When documenting a system, to provide a clear and concise representation of its dynamic aspects.
How to Create Sequence Diagrams?
- Identify Objects: Start by identifying the key objects involved in the use case or scenario you want to model.
- Arrange Objects: Arrange objects horizontally based on their lifespans or importance.
- Add Lifelines: Draw vertical lifelines for each object, representing their active duration in the scenario.
- Add Messages: Add messages (method calls) between lifelines, following the sequence of interactions. Use arrows to indicate the flow of control and data. Return values can be shown using a dashed line.
- Add Activations: Mark the start and end of method execution with activation and deactivation bars.
- Add Return Values: If necessary, show return values with a dashed line.
Tips and Tricks
- Keep it Simple: Start with a few key objects and interactions. Complex diagrams can be overwhelming and hard to understand.
- Use Named Return Values: Instead of showing return values as anonymous values, use named variables to make the diagram more readable.
- Use Stereotypes: Use stereotypes (e.g., <<create>>, <<delete>>) to indicate specific types of messages.
- Use Notes and Comments: Add notes or comments to clarify complex interactions or provide additional context.
- Iterate: Sequence diagrams are not set in stone. Iterate and refine them based on feedback and changing requirements.
Case Study: A Simple Banking Transaction
Let’s consider a simple banking transaction scenario: a user deposits money into their account using an ATM.
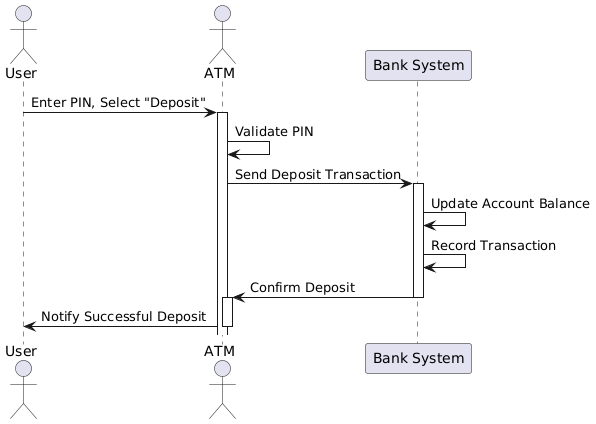
- User: The user interacts with the ATM by entering their PIN and selecting the “Deposit” option.
- ATM: The ATM validates the PIN and creates a new deposit transaction.
- Bank System: The ATM sends the deposit transaction to the bank system.
- Bank System: The bank system updates the user’s account balance and records the transaction.
- ATM: The ATM updates its internal state and notifies the user about the successful deposit.
Conclusion
Sequence diagrams are a powerful tool for understanding and communicating dynamic aspects of a system. By knowing when, why, and how to use them, along with some practical tips and tricks, you can effectively leverage sequence diagrams in your software development lifecycle. The case study demonstrates how sequence diagrams can help clarify complex interactions, making them an invaluable tool for developers, stakeholders, and team members.


")


This post is also available in Deutsch, Español, فارسی, Français, English, Bahasa Indonesia, 日本語, Polski, Portuguese, Ру́сский, Việt Nam, 简体中文 and 繁體中文.