Doughnut charts are a powerful and visually appealing way to present data, especially when you want to show the proportion of a dataset in a circular format. Visual Paradigm Online offers an intuitive and feature-rich doughnut chart maker that allows you to create beautiful and informative charts quickly and easily. This tutorial will guide you through the key features of Visual Paradigm’s online doughnut chart maker, provide step-by-step instructions on how to create a doughnut chart, and showcase some of the beautiful chart templates available.
Key Features of Visual Paradigm’s Online Doughnut Chart Maker

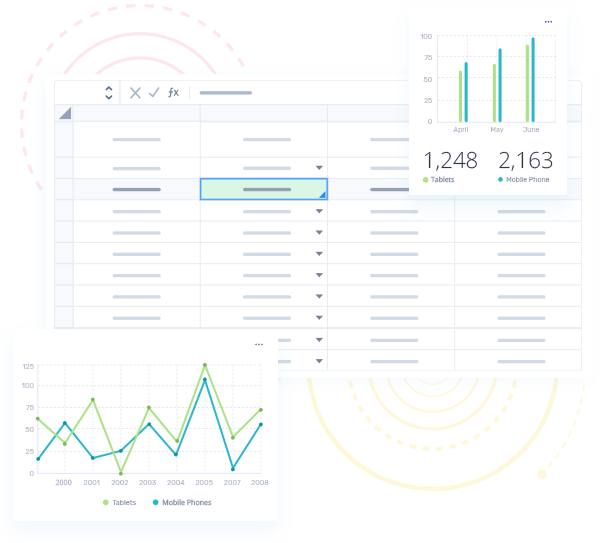
Spreadsheet Editor:
- Easily edit your data in an intuitive spreadsheet editor.
- Simple to enter your information and turn it into a stunning doughnut chart.
Customizable Doughnut Chart:
- Make your chart beautiful by customizing any aspect: fonts, colors, labels, legend, border, size, and more.
Beautiful Chart Templates:
- Start your design from one of the beautifully designed doughnut chart templates.
- Complete it by adding your own data into the chart and adjusting the color and other settings to match your brand or topic.

Additional Features:
- Millions of Stock Photos and Icons: Spice up your design with a vast library of stock photos and icons.
- Drag and Drop Tools: Easily adjust chart values with drag-and-drop tools.
- Publish, Share, and Download: Publish, share, and download your chart in high resolution.
- Switch Between Chart Types: Switch between chart types with one click, with no need to rework your data.
- Over 50 Professional Chart Types: Choose from over 50 professional types of charts.
- Apply Effects: Apply effects to the doughnut chart to suit your brand and topic.
How to Make a Doughnut Chart in 5 Steps
Step 1: Browse the Template Library
- Visit Visual Paradigm Online and browse the library of premade doughnut chart templates.
- Choose a template that best fits your data visualization needs.
Step 2: Open and Edit the Template
- Open the template you like and click “Edit” to start customizing it in the online doughnut chart maker.
Step 3: Edit the Data
- Double-click on the doughnut chart to open the spreadsheet data editor.
- Edit the data either by hand or by importing it from Google Sheets.
Step 4: Customize the Chart
- Edit the colors, fonts, spacing, and other options under the “Chart > Setting” pane.
- Customize the chart to match your brand or topic.
Step 5: Finalize and Publish
- Optionally edit the background of the diagram. You can also add your own shapes and icons.
- Publish and share the chart in just a few clicks.
Doughnut Chart Templates
Visual Paradigm Online offers a rich set of modern and creative doughnut chart templates designed by a world-class design team. Here are some examples of the templates available:
- Reading Habit of U.S. Adults Doughnut Chart:
- Visualize the reading habits of U.S. adults with this informative doughnut chart.
- Time Management Doughnut Chart:
- Analyze how time is managed across different activities with this time management doughnut chart.
- Age Group of Visitors Doughnut Chart:
- Display the age distribution of visitors with this age group doughnut chart.
- Favorite Swimming Style Doughnut Chart:
- Show the preferred swimming styles with this blue-toned informative doughnut chart.
- Wedding Period Doughnut Chart:
- Visualize the distribution of wedding periods with this wedding period doughnut chart.
- Resort Service Usage Doughnut Chart:
- Analyze the usage of resort services with this resort service usage doughnut chart.
- Environmental Design Doughnut Chart:
- Present environmental design data with this environmental design doughnut chart.
- Pet Ownership Doughnut Chart:
- Display pet ownership statistics with this pet ownership doughnut chart.
- Favorite Type of Movie Doughnut Chart:
- Show the favorite types of movies with this favorite type of movie doughnut chart.
- Travel Budget Planning Doughnut Chart:
- Plan your travel budget with this travel budget planning doughnut chart.
Conclusion
Creating stunning and informative doughnut charts has never been easier with Visual Paradigm Online‘s doughnut chart maker. With its intuitive spreadsheet editor, customizable features, and beautiful chart templates, you can visualize your data quickly and effectively. Whether you’re presenting market share, budget breakdowns, or any other proportional data, Visual Paradigm Online has the tools you need to make your charts stand out.
Start creating your doughnut charts today and elevate your data visualization game with Visual Paradigm Online!

