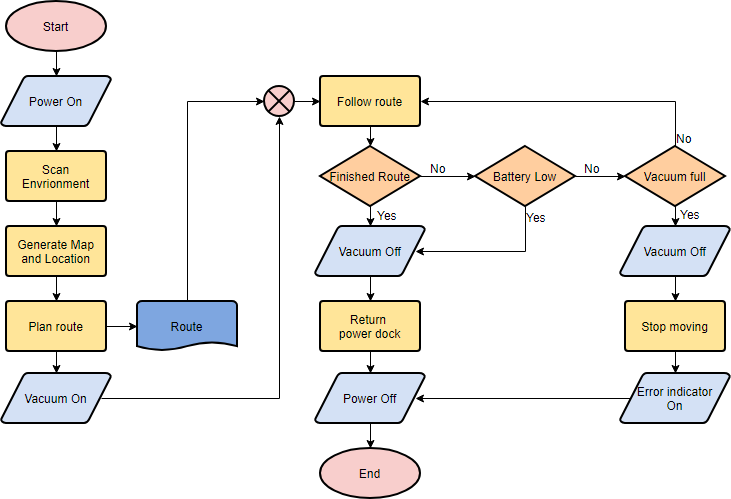
Introduction to Flowcharts
A flowchart is a graphical representation of steps in a process, showing them in sequential order. It is widely used to present the flow of algorithms, workflows, or processes. Flowcharts use various boxes and arrows to depict steps and their order, making complex processes easier to understand.

Flowchart Symbols
Different shapes in a flowchart have specific meanings. Here are some of the most common symbols:
- Terminator: Represents the starting or ending point of a system.

- Process: Indicates a particular operation or action.

- Document: Represents a printout, such as a document or report.

- Decision: Shows a decision or branching point, with lines indicating different possible outcomes.

- Data: Represents information entering or leaving the system.

- On-Page Reference: Indicates that the flow continues on a matching symbol on the same page.

- Off-Page Reference: Indicates that the flow continues on a matching symbol on a different page.

- Delay or Bottleneck: Identifies a delay or bottleneck in the process.

- Flow: Lines represent the sequence and direction of the process.

When to Use a Flowchart
Flowcharts are beneficial for various reasons:
- Clarifying Complex Processes: They help visualize and understand complex processes.
- Identifying Non-Value-Added Steps: They highlight steps that do not add value, such as delays and unnecessary work.
- Team Understanding: They help team members gain a shared understanding of the process.
- Process Design: They serve as a basis for designing new processes.
Flowchart Examples
Medical Service Flowchart
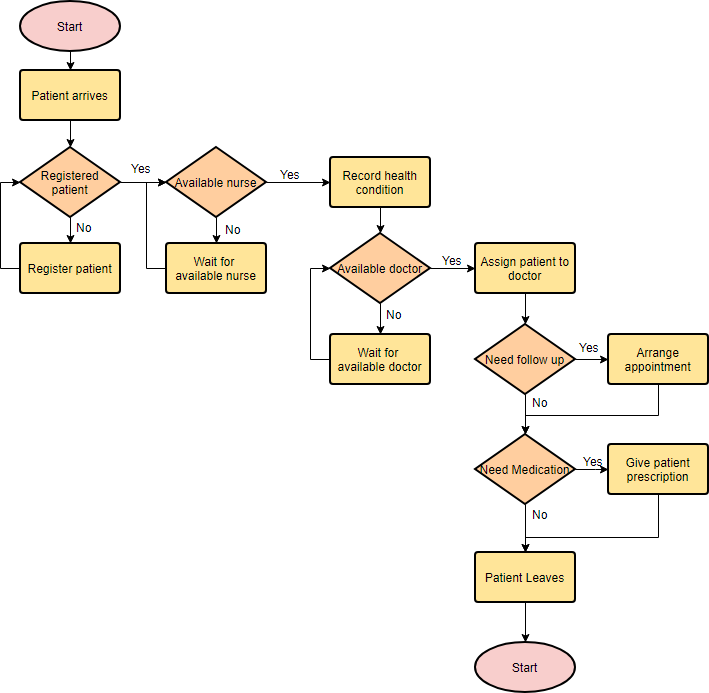
This example shows how clinical cases are processed in a hospital. It uses decision shapes to represent alternative flows.
Description of the Medical Service Flowchart
The following flowchart illustrates the process of handling a patient’s visit to a medical facility, from arrival to departure. Here is a detailed description of each step in the flowchart:
- Start: The process begins when a patient arrives at the medical facility.
- Patient Arrives: This step signifies the initial arrival of the patient at the facility.
- Registered Patient?: A decision point to check if the patient is already registered.
- Yes: If the patient is registered, the process moves to check for the availability of a nurse.
- No: If the patient is not registered, the next step is to register the patient.
- Register Patient: The patient is registered into the system. After registration, the process checks for the availability of a nurse.
- Available Nurse?: A decision point to check if a nurse is available.
- Yes: If a nurse is available, the nurse records the patient’s health condition.
- No: If no nurse is available, the patient waits for an available nurse.
- Record Health Condition: The nurse records the patient’s health condition. After recording, the process checks for the availability of a doctor.
- Available Doctor?: A decision point to check if a doctor is available.
- Yes: If a doctor is available, the patient is assigned to the doctor.
- No: If no doctor is available, the patient waits for an available doctor.
- Assign Patient to Doctor: The patient is assigned to an available doctor.
- Need Follow-Up?: A decision point to determine if the patient needs a follow-up appointment.
- Yes: If a follow-up is needed, an appointment is arranged.
- No: If no follow-up is needed, the process moves to check if medication is needed.
- Arrange Appointment: A follow-up appointment is arranged for the patient. After arranging the appointment, the process checks if medication is needed.
- Need Medication?: A decision point to determine if the patient needs medication.
- Yes: If medication is needed, a prescription is given to the patient.
- No: If no medication is needed, the patient leaves the facility.
- Give Patient Prescription: The patient is given a prescription for the required medication. After receiving the prescription, the patient leaves the facility.
- Patient Leaves: The patient leaves the medical facility.
- End: The process ends.

This flowchart effectively outlines the steps involved in managing a patient’s visit to a medical facility, ensuring that all necessary actions are taken to provide appropriate care and follow-up.
Simple Algorithms Flowchart
Flowcharts can also visualize algorithms. Here is an example of a simple summation process.
Calculate Profit and Loss Flowchart
This example demonstrates how to calculate profit and loss using a flowchart.
Creating a Flowchart in Visual Paradigm
Here’s a step-by-step guide to creating a flowchart using Visual Paradigm:
- Start a New Diagram:
- Select
Diagram > Newfrom the main menu. - Choose
Flowchartand clickNext. - Select
Blankand clickNext. - Enter the name of the flowchart and click
OK.
- Select
- Create a Start Symbol:
- Drag the
Startshape from the diagram toolbar and drop it onto the diagram. - Name it
Start.
- Drag the
- Add Processes:
- Move your mouse pointer over the start shape.
- Press the triangular handler on the right and drag it out.
- Release the mouse button and select
Flow Line > Processfrom the Resource Catalog. - Enter the name of the process (e.g.,
Add items to Cart). - Repeat to create additional processes (e.g.,
Checkout Shopping Cart,Settle Payment).
- End the Flow:
- Create a terminator to end the flow.
- Color the Shapes:
- Select
Diagram > Format Panelfrom the main menu. - Select a shape on the diagram and update its color through the Style setting in the Format Panel.
- Select
Your final flowchart should look something like this:
Conclusion
Flowcharts are powerful tools for visualizing and understanding processes. By using standard symbols and following a structured approach, you can create clear and effective flowcharts to represent any process or algorithm. Whether you are designing a new process or analyzing an existing one, flowcharts can help you achieve your goals more efficiently.
Resources
- Flowchart Tutorial (with Symbols, Guide and Examples)
- This tutorial provides a comprehensive guide on creating flowcharts using Visual Paradigm. It covers the basics of flowcharts, including their symbols and how to use them effectively. The tutorial also includes step-by-step instructions on starting a new flowchart project and adding various elements to it1.
- Visual Paradigm Reviews, Pricing and Features – 2024
- This article offers an in-depth review of Visual Paradigm, focusing on its features, pricing, and overall performance. It discusses how the tool empowers users to create professional diagrams and enhances productivity through its various functionalities3.
- Visual Paradigm: A Tool to Create Illustration of Different Things
- This article explores the versatility of Visual Paradigm in creating different types of diagrams, including flowcharts. It highlights the tool’s support for various diagram types and its usefulness in illustrating complex processes and systems4.
- Online Flowchart Tool
- This resource introduces Visual Paradigm’s online flowchart tool, emphasizing its ease of use and collaborative features. It provides examples and guides on how to create flowcharts quickly and efficiently using the online platform5.
- Flowchart Tutorial by Ralph Garcia
- This tutorial on Medium provides a detailed guide on creating flowcharts using Visual Paradigm Online. It covers flowchart symbols, history, and practical steps to create effective flowcharts, along with examples and templates6.
- Visual Paradigm: Full Review
- This full review of Visual Paradigm discusses its comprehensive features, user experience, and support resources. It highlights the tool’s flexibility, documentation, and community support, making it a powerful option for visual modeling and design7.

