Introduction
Flowcharts are essential tools for visualizing processes, workflows, and algorithms. They help in understanding and communicating complex procedures by breaking them down into simple, sequential steps.
Visual Paradigm Online is a top-rated diagramming tool that allows you to create professional flowcharts quickly and easily. This tutorial will guide you through the process of creating flowcharts using Visual Paradigm Online, from basic steps to advanced features.

Getting Started with Visual Paradigm Online
Signing Up and Logging In
- Visit the Website: Go to Visual Paradigm Online.
- Sign Up: If you don’t have an account, click on “Sign Up” and follow the instructions to create a new account.
- Log In: If you already have an account, click on “Log In” and enter your credentials.
Creating a New Flowchart
- Start a New Diagram: Click on “Create” and select “Flowchart” from the list of diagram types.
- Name Your Diagram: Enter a name for your flowchart and click “OK”.
Basic Flowchart Creation
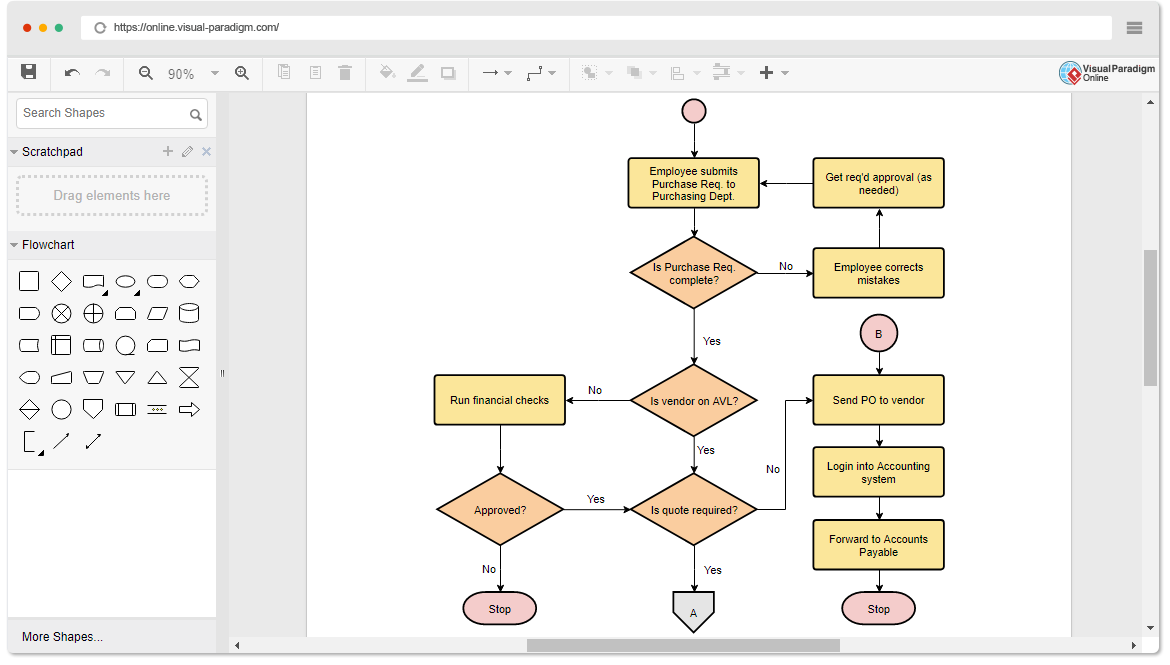
Using the Drag-and-Drop Editor
- Select Shapes: On the left sidebar, you will find a variety of flowchart shapes. Click and drag the desired shape onto the canvas.
- Add Text: Double-click on the shape to add text. You can also use the text tool to insert labels and annotations.
- Connect Shapes: Use the connector tool to draw arrows between shapes, indicating the flow of the process. The connectors will automatically adjust as you move the shapes.
Customizing Shapes and Connectors
- Formatting Options: Click on a shape or connector to access formatting options. You can change colors, fonts, and styles to match your preferences.
- Alignment Guide: Use the alignment guide to position shapes accurately. This feature ensures that your flowchart is neat and tidy.
Advanced Features
Reusing Shapes and Templates
- Save Shapes: Right-click on a shape and select “Save to My Shapes” to reuse it in other diagrams.
- Use Templates: Visual Paradigm Online offers a wide range of flowchart templates. Browse the template library and select one that fits your needs. You can customize the template to suit your specific requirements.
Collaborative Work
- Invite Collaborators: Click on the “Share” button and enter the email addresses of your team members. You can set permissions for each collaborator.
- Real-Time Editing: Work together in real-time. Changes made by one user will be instantly visible to others.
- Commenting and Feedback: Use the commenting feature to provide feedback and suggestions directly on the diagram.
Exporting and Sharing
- Export Options: Click on the “Export” button to save your flowchart in various formats, including PNG, JPG, SVG, GIF, and PDF.
- Cloud Storage: Save your diagrams in the cloud workspace provided by Visual Paradigm Online. This allows you to access your work from anywhere and share it with others easily.
- Integration with MS Office: Embed your flowchart in Word or PowerPoint documents. The diagram will remain editable within the MS Office application.
Practical Usability
Creating Custom Flowcharts
- Define Your Process: Identify the steps involved in your process and the decisions that need to be made.
- Choose Appropriate Shapes: Use the standard flowchart symbols to represent different types of actions, decisions, and data.
- Add Details: Include external images, URLs, and hyperlinks to provide additional information and context.
Example Flowchart
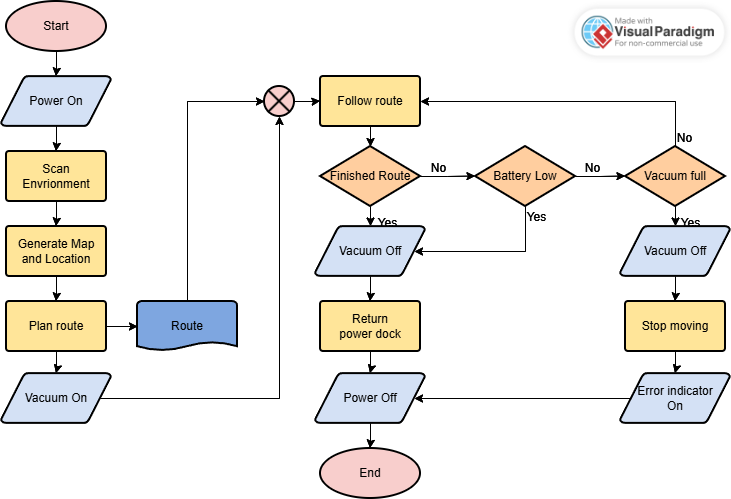
The flowchart illustrates the operational process of an automated vacuum cleaner. It outlines the steps from powering on the device to completing its cleaning route, including decision points and actions based on various conditions.

Key Concepts
1. Start and End Points
- Start: The process begins with the “Start” symbol, indicating the initiation of the vacuum cleaner’s operation.
- End: The process concludes with the “End” symbol, signifying the completion of the operation.
2. Process Steps
- Power On: The vacuum cleaner is powered on.
- Scan Environment: The device scans its surroundings to gather environmental data.
- Generate Map and Location: Based on the scan, a map of the environment is generated, and the device’s location is determined.
- Plan Route: A route for cleaning is planned based on the generated map.
- Vacuum On: The vacuuming function is activated.
- Follow Route: The device follows the planned route.
- Return Power Dock: The device returns to its power dock.
- Power Off: The device is powered off.
- Stop Moving: The device stops moving.
- Error Indicator On: The error indicator is turned on if a problem is detected.
3. Decision Points
- Finished Route?: Checks if the planned route is completed.
- Yes: If the route is finished, the vacuum is turned off, and the device returns to the power dock.
- No: If the route is not finished, the device continues to follow the route.
- Battery Low?: Checks if the battery level is low.
- Yes: If the battery is low, the vacuum is turned off, and the device returns to the power dock.
- No: If the battery is not low, the device continues to follow the route.
- Vacuum Full?: Checks if the vacuum’s dustbin is full.
- Yes: If the vacuum is full, the vacuum is turned off, and the device stops moving and turns on the error indicator.
- No: If the vacuum is not full, the device continues to follow the route.
4. Connectors and Flow
- Route: Represents the path the device follows during the cleaning process.
- Arrows: Indicate the direction of the process flow, showing the sequence of steps and decisions.
Detailed Explanation of the Flowchart
- Initialization:
- The process starts with the “Start” symbol.
- The vacuum cleaner is powered on.
- Environmental Scanning and Mapping:
- The device scans the environment to understand its surroundings.
- A map of the environment is generated, and the device’s location is determined.
- Route Planning and Execution:
- A route for cleaning is planned based on the generated map.
- The vacuuming function is activated, and the device follows the planned route.
- Decision Points During Operation:
- Finished Route?: If the route is completed, the vacuum is turned off, and the device returns to the power dock. If not, the device continues to follow the route.
- Battery Low?: If the battery is low, the vacuum is turned off, and the device returns to the power dock. If not, the device continues to follow the route.
- Vacuum Full?: If the vacuum’s dustbin is full, the vacuum is turned off, and the device stops moving and turns on the error indicator. If not, the device continues to follow the route.
- Completion:
- The device returns to the power dock and is powered off.
- The process ends with the “End” symbol.
Key Concepts in Flowchart Design
1. Sequential Flow
- The flowchart follows a sequential flow, where each step leads to the next, ensuring a logical progression of the process.
2. Decision Making
- Decision points (diamond shapes) are used to represent conditions that affect the flow of the process. These points allow for branching based on different outcomes.
3. Process Termination
- The flowchart includes clear start and end points, providing a complete view of the process from initiation to conclusion.
4. Error Handling
- The flowchart includes error handling by checking for conditions like a full vacuum or low battery and taking appropriate actions, such as stopping the device and turning on the error indicator.
The flowchart effectively illustrates the operational process of an automated vacuum cleaner, highlighting the key steps, decision points, and actions involved. By following this flowchart, one can understand the sequence of operations and the conditions that influence the device’s behavior. This visual representation is crucial for designing, troubleshooting, and optimizing the performance of automated cleaning devices.
Conclusion
Visual Paradigm Online is a powerful and user-friendly tool for creating flowcharts. With its intuitive drag-and-drop editor, extensive shape library, and collaborative features, you can easily create professional flowcharts for any purpose. Whether you are a beginner or an experienced user, Visual Paradigm Online provides the tools and resources you need to visualize and communicate complex processes effectively.
Flowchart Resources
- Flowchart Tutorial (with Symbols, Guide and Examples)
- This tutorial provides a comprehensive guide on creating flowcharts using Visual Paradigm. It covers the basics of flowcharts, including their symbols and how to use them effectively. The tutorial also includes step-by-step instructions on starting a new flowchart project and adding various elements to it1.
- Visual Paradigm Reviews, Pricing and Features – 2024
- This article offers an in-depth review of Visual Paradigm, focusing on its features, pricing, and overall performance. It discusses how the tool empowers users to create professional diagrams and enhances productivity through its various functionalities3.
- Visual Paradigm: A Tool to Create Illustration of Different Things
- This article explores the versatility of Visual Paradigm in creating different types of diagrams, including flowcharts. It highlights the tool’s support for various diagram types and its usefulness in illustrating complex processes and systems4.
- Online Flowchart Tool
- This resource introduces Visual Paradigm’s online flowchart tool, emphasizing its ease of use and collaborative features. It provides examples and guides on how to create flowcharts quickly and efficiently using the online platform5.
- Flowchart Tutorial by Ralph Garcia
- This tutorial on Medium provides a detailed guide on creating flowcharts using Visual Paradigm Online. It covers flowchart symbols, history, and practical steps to create effective flowcharts, along with examples and templates6.
- Visual Paradigm: Full Review
- This full review of Visual Paradigm discusses its comprehensive features, user experience, and support resources. It highlights the tool’s flexibility, documentation, and community support, making it a powerful option for visual modeling and design7.

