Introduction
Flowcharting is a visual representation of a process or system, showing the sequence of steps and decisions involved in executing that process. It is a powerful tool for understanding, analyzing, and improving processes. This guide will cover the basics of flowcharting, key concepts such as stepwise refinements, and provide a detailed example to illustrate these principles.
What is a Flowchart?
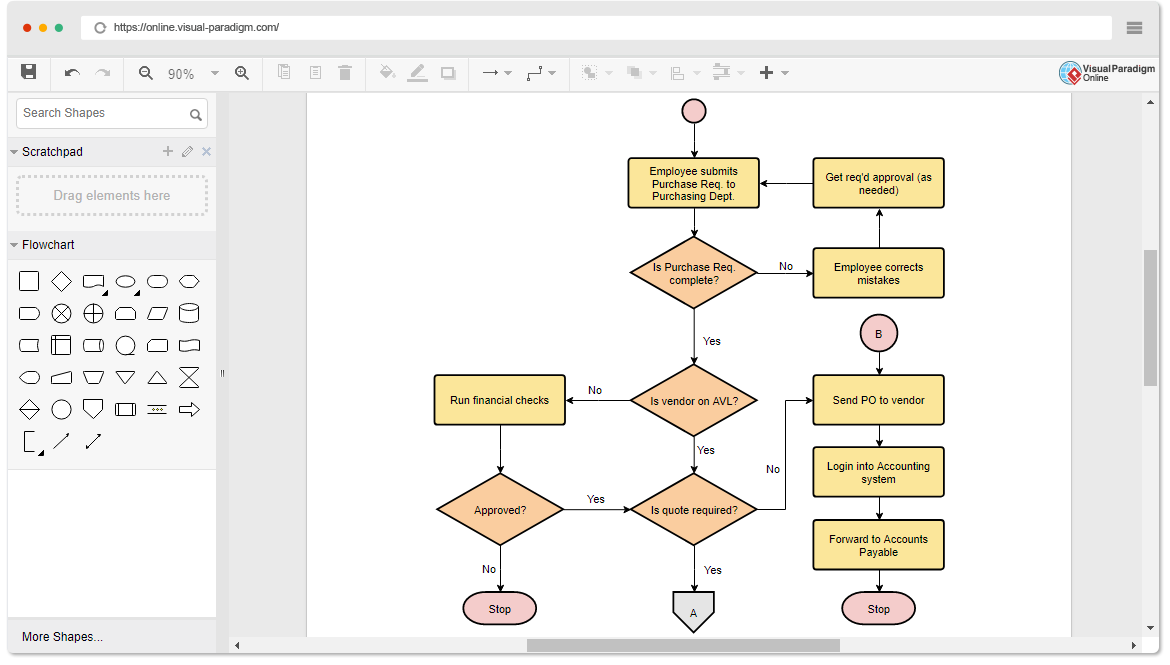
A flowchart is a diagram that represents a workflow or process. It uses symbols to depict the steps in the process, the sequence of those steps, and the decisions that determine the flow of the process. Flowcharts are widely used in various fields, including software development, business process management, and engineering.

Key Concepts in Flowcharting
1. Symbols
Flowcharts use standardized symbols to represent different types of steps in a process:
- Oval: Start and end points.
- Rectangle: Process steps or actions.
- Diamond: Decision points.
- Parallelogram: Input/output operations.
- Arrow: Flow direction.
2. Stepwise Refinements
Stepwise refinement is the process of breaking down a complex process into smaller, more manageable sub-processes. This helps in understanding and analyzing the process in detail. Each sub-process can be further broken down until the desired level of detail is achieved.
3. Decision Points
Decision points are crucial in flowcharts as they determine the flow of the process based on certain conditions. They typically have two or more branches, each leading to a different path in the process.
4. Parallel Paths
Parallel paths represent activities that can occur simultaneously. This is useful in representing concurrent processes or multitasking.
Creating a Flowchart
Step 1: Identify the Process
Start by identifying the process you want to represent. Define the start and end points of the process.
Step 2: Break Down the Process
Break down the process into smaller steps. Use stepwise refinement to create sub-processes if necessary.
Step 3: Use Symbols to Represent Steps
Use the appropriate symbols to represent each step in the process. Ensure that the symbols are consistent and follow the standard conventions.
Step 4: Add Decision Points
Identify the decision points in the process and use diamonds to represent them. Clearly define the conditions for each branch.
Step 5: Connect the Steps
Use arrows to connect the steps in the sequence they occur. Ensure that the flow is logical and easy to follow.
Step 6: Review and Refine
Review the flowchart to ensure that it accurately represents the process. Make any necessary refinements to improve clarity and accuracy.
Example: Hand Washing Process

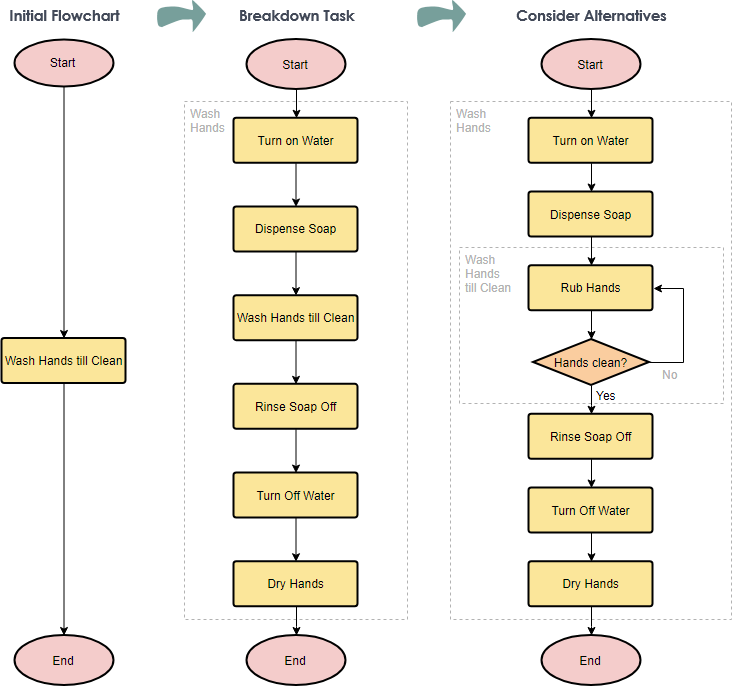
Initial Flowchart
The initial flowchart for washing hands might look like this:
- Start
- Wash Hands till Clean
- End
Breakdown Task
To provide more detail, we break down the “Wash Hands till Clean” step into smaller steps:
- Start
- Turn on Water
- Dispense Soap
- Wash Hands till Clean
- Rinse Soap Off
- Turn Off Water
- Dry Hands
- End
Consider Alternatives
To further refine the process, we consider alternatives and add decision points:
- Start
- Turn on Water
- Dispense Soap
- Rub Hands
- Decision: Are Hands Clean?
- If Yes, proceed to Rinse Soap Off
- If No, repeat Rub Hands
- Rinse Soap Off
- Turn Off Water
- Dry Hands
- End
Conclusion
Flowcharting is a valuable tool for visualizing and understanding processes. By using standardized symbols, stepwise refinements, and decision points, you can create detailed and accurate flowcharts that help in analyzing and improving processes. Whether you are a software developer, business analyst, or engineer, mastering flowcharting can significantly enhance your ability to manage and optimize complex systems.
References
- Online Flowchart Tool
- Visual Paradigm Reviews, Pricing and Features – 2024
- Flowchart Tutorial (with Symbols, Guide and Examples)
- Visual Paradigm Online – Google Workspace Marketplace
- Visual Paradigm: Full Review – My Chart Guide
- Process Flow Diagram Tool
- Visual Paradigm: A Tool to Create Illustration of Different Things

