Introduction to Flowcharts
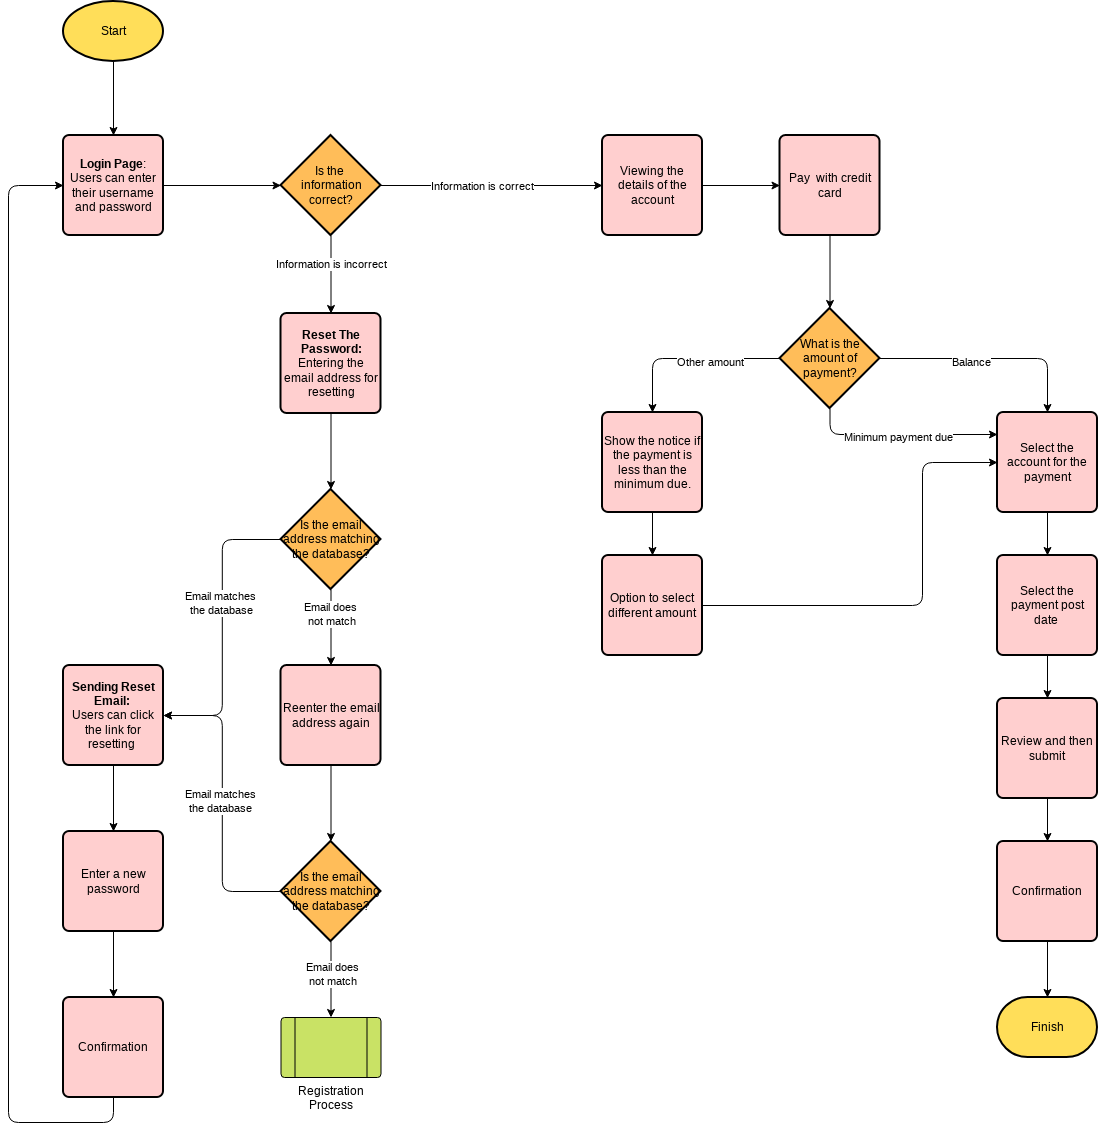
Flowcharts are visual tools used to represent algorithms, workflows, or processes. They use various shapes and symbols to illustrate the sequence of steps, decisions, and actions involved in a process. Flowcharts are widely used in software development, business process modeling, engineering, and many other fields to simplify complex processes and improve communication.

Key Concepts of Flowcharts
What Are Flowcharts?
Flowcharts are diagrams that represent a process or algorithm. They use standardized symbols to depict different types of steps, such as actions, decisions, inputs, and outputs. Flowcharts help in visualizing the flow of control in a process, making it easier to understand and communicate.
Why Use Flowcharts?
Flowcharts offer several benefits:
- Clarity and Simplification: They break down complex processes into simple, understandable steps.
- Universal Visual Language: Flowcharts use standard symbols that can be understood by anyone, reducing miscommunication.
- Documentation: They are ideal for documenting standard operating procedures, workflows, and business processes.
- Visualization: Flowcharts enhance the visualization of problems, enabling more informed decision-making.
- Training: They help in training new employees by providing a clear visual representation of processes.
Types of Flowcharts
- Process Flowchart: Represents the sequence of steps in a process. Commonly used in business process modeling and project management.
- Swimlane Flowchart: Organizes the process into different lanes, each representing a different person or department. Useful for illustrating collaboration within a process.
- Workflow Diagram: Shows how tasks, documents, or information move through a system. Used in office processes and software development.
- Data Flow Diagram (DFD): Focuses on detailing the inputs, processes, and outputs. Used in system design and analysis.
- Decision Flowchart: Maps out decision points within a process and the possible outcomes of each decision. Useful in decision-making scenarios.
Flowchart Symbols and Their Meanings
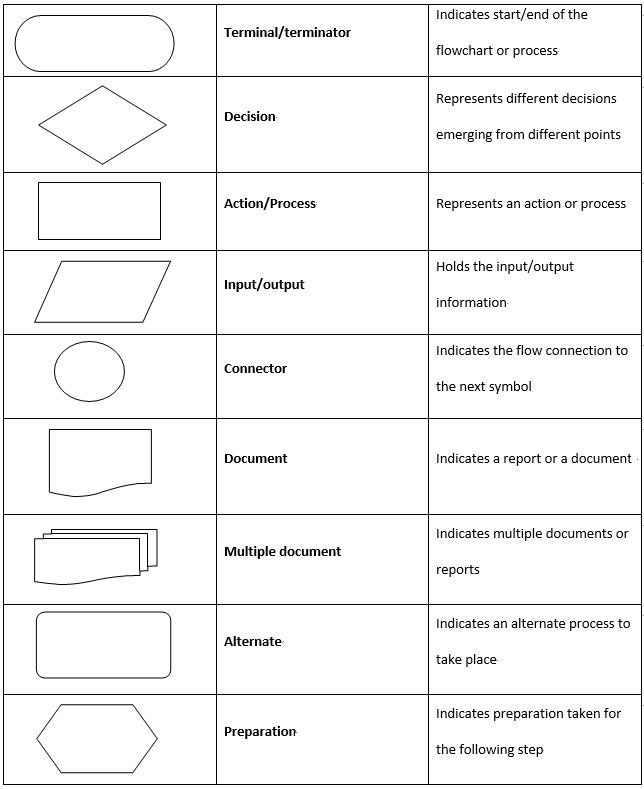
Flowcharts use a variety of symbols to represent different types of actions, decisions, and steps in a process. Here is a description of the most commonly used flowchart symbols:

- Terminal/Terminator
- Shape: Oval
- Purpose: Indicates the start or end of the flowchart or process.
- Usage: Used at the beginning and end of a flowchart to denote the initiation and conclusion of the process.
- Decision
- Shape: Diamond
- Purpose: Represents a point where a decision is made, leading to different branches or outcomes.
- Usage: Used to show decision points in the process, such as yes/no questions or true/false conditions.
- Action/Process
- Shape: Rectangle
- Purpose: Represents an action, operation, or process step.
- Usage: Used to depict any action or process that occurs within the flowchart, such as calculations, data manipulation, or other tasks.
- Input/Output
- Shape: Parallelogram
- Purpose: Holds the input/output information.
- Usage: Used to indicate where data enters or leaves the system, such as user inputs or outputs to a display or printer.
- Connector
- Shape: Circle
- Purpose: Indicates the flow connection to the next symbol, often used to connect different parts of a complex flowchart.
- Usage: Used to simplify the flowchart by connecting different sections without drawing long, complicated lines.
- Document
- Shape: Rectangle with a wavy bottom
- Purpose: Indicates a report or a document.
- Usage: Used to represent documents or reports generated or used within the process.
- Multiple Document
- Shape: Stacked rectangles
- Purpose: Indicates multiple documents or reports.
- Usage: Used to represent multiple documents or reports generated or used within the process.
- Alternate
- Shape: Rectangle with double-struck vertical lines
- Purpose: Indicates an alternate process to take place.
- Usage: Used to represent an alternative path or process that can be taken under certain conditions.
- Preparation
- Shape: Hexagon
- Purpose: Indicates preparation taken for the following step.
- Usage: Used to represent preparatory steps or actions that need to be taken before proceeding to the next step in the process.
These symbols help in creating clear and concise flowcharts that effectively communicate the sequence of steps, decisions, and actions involved in a process. By using standardized symbols, flowcharts become a universal visual language that can be understood by anyone, reducing miscommunication and enhancing clarity.
Rules for Creating a Flowchart
- Start and End: The flowchart should begin with a “Start” symbol and end with an “End” symbol.
- Connections: All symbols in the flowchart must be connected with arrows.
- Decision Points: Each decision point should have two or more distinct outcomes.
- Flow Direction: The flow should generally move from top to bottom or left to right.
Example of a Flowchart

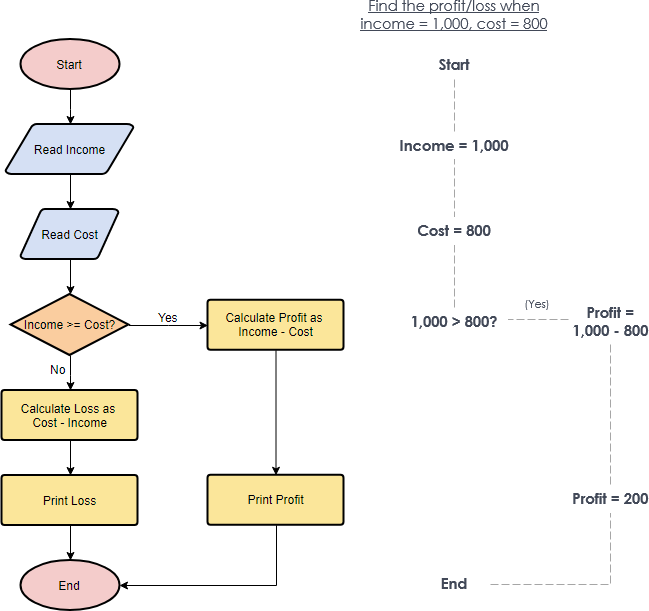
- The flowchart attached illustrates the process of determining profit or loss based on given income and cost values. Here’s a step-by-step breakdown of the flowchart:
- Start: The process begins.
- Read Income: The system reads the income value, which in this example is 1,000.
- Read Cost: The system reads the cost value, which in this example is 800.
- Decision Point (Income >= Cost?): The flowchart checks if the income is greater than or equal to the cost.
- Yes Path: If the income is greater than or equal to the cost, the process moves to calculate the profit.
- No Path: If the income is less than the cost, the process moves to calculate the loss.
- Calculate Profit as Income – Cost: If the income is greater than or equal to the cost, the profit is calculated by subtracting the cost from the income.
- Print Profit: The calculated profit is then printed. In this example, the profit is 200 (1,000 – 800).
- Calculate Loss as Cost – Income: If the income is less than the cost, the loss is calculated by subtracting the income from the cost.
- Print Loss: The calculated loss is then printed.
- End: The process ends.
Explanation of Concepts
1. Flowchart Symbols
- Oval: Represents the start and end points of the process.
- Parallelogram: Represents input/output operations, such as reading income and cost values or printing the result.
- Diamond: Represents a decision point where the flow can branch based on a condition.
- Rectangle: Represents a process or action, such as calculating profit or loss.
- Arrow: Indicates the direction of the flow from one step to the next.
2. Decision Making
- Decision Point: A critical part of the flowchart where the flow can take different paths based on a condition. In this case, the decision point checks if the income is greater than or equal to the cost.
- Branching: Depending on the outcome of the decision, the flowchart branches into different paths: one for calculating profit and another for calculating loss.
3. Calculations
- Profit Calculation: If the income is greater than or equal to the cost, the profit is calculated as the difference between income and cost.
- Loss Calculation: If the income is less than the cost, the loss is calculated as the difference between cost and income.
4. Output
- Printing Results: The results of the calculations (profit or loss) are printed, providing a clear output of the process.
5. Process Flow
- Sequential Steps: The flowchart follows a sequential order of steps, starting from reading inputs, making decisions, performing calculations, and printing results.
- Termination: The process ends after the results are printed, ensuring a clear start and end to the flowchart.
The flowchart effectively demonstrates the process of determining profit or loss based on income and cost. It uses standard flowchart symbols to represent different types of steps, includes a decision point to branch the flow based on a condition, performs necessary calculations, and prints the results. This visual representation helps in understanding the logical flow of the process and ensures that all steps are clearly defined and executed in sequence.
Advantages of Using Flowcharts
- Communication: Flowcharts are an effective way to communicate the logic of a system.
- Blueprint: They act as a guide during program design.
- Debugging: Flowcharts help in the debugging process.
- Analysis: They make it easier to analyze programs.
- Documentation: Flowcharts provide better documentation.
Disadvantages of Using Flowcharts
- Complexity: It is difficult to draw flowcharts for large and complex programs.
- Modification: Flowcharts are hard to modify.
- Cost: Making a flowchart can be costly.
- Updates: If changes are made in the software, the flowchart must be redrawn.
Recommended Tool: Visual Paradigm Online
Visual Paradigm Online is a top-rated diagramming tool that offers an intuitive drag-and-drop editor for creating professional flowcharts quickly and easily. It provides a wide range of features, including:
- Extensive Built-in Templates: A variety of flowchart templates to get you started.
- Collaborative Features: Work simultaneously with team members on the same project.
- Cloud Workspace: Keep your work securely in the cloud and access it anytime, anywhere.
- Cross-Platform Compatibility: Works on Mac, Windows, and Linux.
- Free Edition: Visual Paradigm Online offers a free edition with no limitations on the number of diagrams or project size.
Key Features of Visual Paradigm Online
- Drag-and-Drop Editor: Easily create and customize flowcharts with a user-friendly interface.
- Automatic Alignment: Ensures neat and tidy flowcharts with automatic alignment guides.
- Rich Formatting Tools: A variety of formatting options to create engaging flowcharts.
- Export Options: Save your flowcharts in various formats, including PNG, JPG, SVG, GIF, and PDF.
- Integration with MS Office: Embed your flowcharts in Word and PowerPoint documents.
Getting Started with Visual Paradigm Online
- Sign Up/Log In: Visit Visual Paradigm Online and sign up for a free account or log in if you already have one.
- Create a New Flowchart: Click on “Create” and select “Flowchart” from the list of diagram types.
- Use Templates: Browse the template library and select a template that fits your needs. Customize it to suit your specific requirements.
- Collaborate: Invite team members to collaborate on your flowchart in real-time.
- Export and Share: Save your flowchart in the desired format and share it with others.
Conclusion
Flowcharts are powerful tools for visualizing and communicating complex processes. They simplify tasks by breaking them down into clear, actionable steps, making them easier to understand and implement. Visual Paradigm Online is the best tool for creating professional flowcharts, offering a user-friendly interface, extensive templates, and collaborative features. Whether you are a beginner or an experienced user, Visual Paradigm Online provides the tools and resources you need to create effective flowcharts for any purpose.
References
- Flowchart Made Easy
- Visual Paradigm
- VP Online – Online Drawing Tool
- Free Visual Paradigm Online
- Visual Paradigm – Online Productivity Suite
- Online Diagram Software & Chart Solution
- Online Drawing Tool: VP Online – Visual Paradigm
- Online UML Diagram Tool
- Free Class Diagram Tool
- Free Online Diagram Software

