Introduction
UML (Unified Modeling Language) timing diagrams are a type of interaction diagram that focus on the timing constraints of interactions. They are used to show the interactions among objects within a given period, emphasizing the changes in conditions over time. This guide will provide a detailed overview of UML timing diagrams, including their purpose, key elements, and how to create and interpret them.

Purpose of UML Timing Diagrams
UML timing diagrams are used to:
- Reason about timing: Analyze and understand the timing aspects of interactions between objects.
- Show timing constraints: Illustrate the conditions that must be met within specific time intervals.
- Model real-time systems: Represent systems where timing is a critical factor, such as embedded systems, communication protocols, and performance analysis.
Example Use Cases:
- Medical domain: Modeling the stages of a disease and the timing of interventions.
- User experience: Analyzing the latency and performance of a website or application.
Key Elements of UML Timing Diagrams
Lifeline
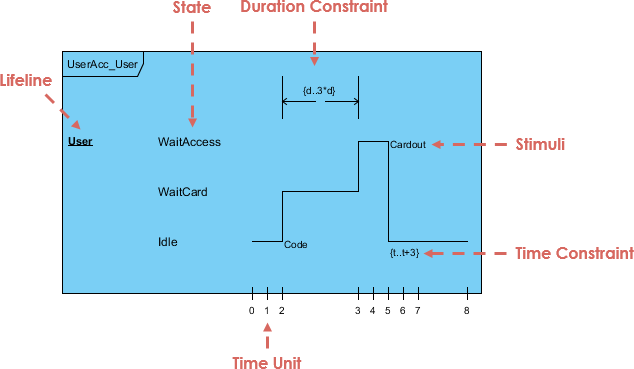
A lifeline represents an individual participant in the interaction. It can be an object, actor, or any entity that participates in the interaction. Lifelines are depicted as horizontal bars that show the existence of the participant over time.
State or Condition Timeline
A state or condition timeline represents the state of an object or a condition that must be met. It is shown as a horizontal bar with segments indicating different states or conditions over time.
Duration Constraint
A duration constraint specifies the duration within which a condition must be met. It is represented by a horizontal bar with two vertical lines indicating the start and end of the duration.
Time Constraint
A time constraint specifies a point in time by which a condition must be met. It is represented by a vertical line intersecting the lifeline at the specific time.
Destruction Occurrence
A destruction occurrence represents the point in time when an object is destroyed. It is depicted by an “X” at the end of the lifeline.
Notation
Notation in UML timing diagrams includes labels and annotations that provide additional information about the timing constraints and conditions.
Creating UML Timing Diagrams
Steps to Create a UML Timing Diagram
- Identify Participants: Determine the objects, actors, or entities that will participate in the interaction.
- Define Lifelines: Draw horizontal bars to represent the lifelines of the participants.
- Add States or Conditions: Divide the lifelines into segments to represent different states or conditions over time.
- Specify Duration Constraints: Add horizontal bars with vertical lines to indicate the duration within which conditions must be met.
- Specify Time Constraints: Add vertical lines intersecting the lifelines to indicate specific points in time by which conditions must be met.
- Add Destruction Occurrences: Place an “X” at the end of the lifeline to represent the destruction of the object.
- Label and Annotate: Add labels and annotations to provide additional information about the timing constraints and conditions.
Interpreting UML Timing Diagrams
Understanding Lifelines
- Horizontal Bars: Represent the existence of the participant over time.
- Segments: Indicate different states or conditions over time.
Understanding Duration Constraints
- Horizontal Bars with Vertical Lines: Represent the duration within which a condition must be met.
- Start and End Points: Indicate the start and end of the duration.
Understanding Time Constraints
- Vertical Lines: Represent specific points in time by which conditions must be met.
- Intersection with Lifelines: Indicate the specific time on the lifeline.
Understanding Destruction Occurrences
- “X” Symbol: Represents the destruction of the object.
- End of Lifeline: The destruction occurrence is placed at the end of the lifeline.
Understanding Notation
- Labels and Annotations: Provide additional information about the timing constraints and conditions.
- Additional Information: Include any relevant details that help in understanding the timing aspects of the interaction.
Example: Website Timing
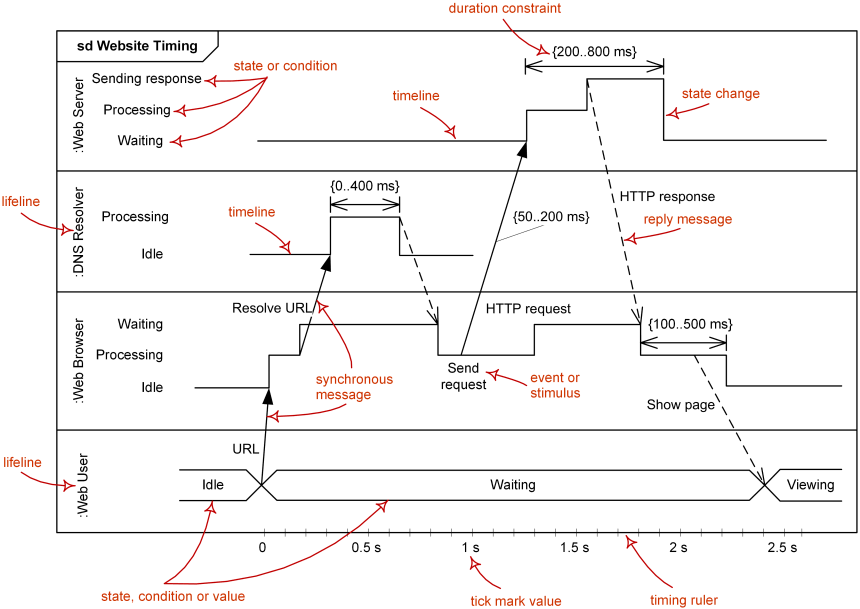
This UML timing diagram illustrates the sequence of events and timing constraints involved in a web interaction, specifically focusing on the timing aspects of a web request and response cycle. The diagram is titled “sd Website Timing” and includes four lifelines representing the participants in the interaction: Web User, Web Browser, DNS Resolver, and Web Server. The horizontal axis represents time, marked in seconds.

Lifelines and States
- Web User
- States/Conditions:
- Idle: The user is not actively interacting with the web.
- URL: The user enters a URL into the web browser.
- Waiting: The user is waiting for the web page to load.
- Viewing: The user is viewing the web page.
- States/Conditions:
- Web Browser
- States/Conditions:
- Idle: The browser is not actively processing a request.
- Processing: The browser is processing the user’s input or the server’s response.
- Waiting: The browser is waiting for a response from the server.
- Events/Stimuli:
- Resolve URL: The browser resolves the URL to an IP address.
- HTTP request: The browser sends an HTTP request to the web server.
- Show page: The browser displays the web page to the user.
- Timing Constraints:
- The URL resolution process should take between 0 and 400 milliseconds.
- The HTTP request should be sent within 50 to 200 milliseconds after resolving the URL.
- The page should be shown to the user within 100 to 500 milliseconds after receiving the HTTP response.
- States/Conditions:
- DNS Resolver
- States/Conditions:
- Idle: The DNS resolver is not actively resolving a domain name.
- Processing: The DNS resolver is processing a domain name resolution request.
- Timing Constraints:
- The DNS resolution process should take between 0 and 400 milliseconds.
- States/Conditions:
- Web Server
- States/Conditions:
- Waiting: The web server is waiting for an incoming request.
- Processing: The web server is processing the incoming request.
- Sending response: The web server is sending a response back to the web browser.
- Timing Constraints:
- The web server should send a response within 200 to 800 milliseconds of receiving the request.
- States/Conditions:
Interactions and Timing Constraints
- Web User to Web Browser:
- The user enters a URL into the web browser, transitioning from “Idle” to “URL”.
- The web browser resolves the URL, which should take between 0 and 400 milliseconds.
- Web Browser to DNS Resolver:
- The web browser sends a synchronous message to the DNS resolver to resolve the URL to an IP address.
- The DNS resolver processes the request, which should take between 0 and 400 milliseconds.
- Web Browser to Web Server:
- The web browser sends an HTTP request to the web server, which should be sent within 50 to 200 milliseconds after resolving the URL.
- The web server processes the request and sends a response back to the web browser.
- The web server should send the response within 200 to 800 milliseconds of receiving the request.
- Web Browser to Web User:
- The web browser displays the web page to the user, which should occur within 100 to 500 milliseconds after receiving the HTTP response.
- The user transitions from “Waiting” to “Viewing” the web page.
Timing Constraints
- URL Resolution: The URL resolution process should take between 0 and 400 milliseconds.
- HTTP Request: The HTTP request should be sent within 50 to 200 milliseconds after resolving the URL.
- Web Server Response: The web server should send a response within 200 to 800 milliseconds of receiving the request.
- Page Display: The web page should be displayed to the user within 100 to 500 milliseconds after receiving the HTTP response.
State Changes
- Web User: Transitions from “Idle” to “URL” to “Waiting” to “Viewing”.
- Web Browser: Transitions from “Idle” to “Processing” to “Waiting” to “Show page”.
- DNS Resolver: Transitions from “Idle” to “Processing” back to “Idle”.
- Web Server: Transitions from “Waiting” to “Processing” to “Sending response” back to “Waiting”.
Synchronous Message
- The web browser sends a synchronous message to the DNS resolver to resolve the URL, indicating that the browser waits for the DNS resolver to complete the resolution before proceeding.
Event or Stimulus
- The HTTP request sent by the web browser to the web server is an event that triggers the web server to process the request and send a response.
This timing diagram effectively models the timing aspects of a web interaction, ensuring that all timing constraints are met and that the interaction proceeds as expected within the specified time intervals.
Timing Diagram
- Lifeline for User:
- Horizontal bar representing the user’s interaction with the website.
- Segments indicating different states of the user’s interaction (e.g., Request Sent, Request Received, Response Sent).
- Duration constraints for each state.
- Time constraints for specific events (e.g., Request Sent, Response Received).
- Lifeline for Server:
- Horizontal bar representing the server’s processing of the user’s request.
- Segments indicating different states of the server’s processing (e.g., Request Received, Processing, Response Sent).
- Duration constraints for each state.
- Time constraints for specific events (e.g., Request Received, Response Sent).
- Notation:
- Labels indicating the states of the user’s interaction and the server’s processing.
- Annotations explaining the timing constraints and conditions for the interaction.
Conclusion
UML timing diagrams are essential for modeling and analyzing the timing aspects of interactions between objects. By understanding the key elements and following the steps to create and interpret them, you can effectively use timing diagrams to reason about time and model real-time systems.
References
- What is Timing Diagram?
- Visual Paradigm. (n.d.). What is Timing Diagram? .
- 12. Timing Diagram – Visual Paradigm Community Circle
- Visual Paradigm Community Circle. (2018, May 11). Timing Diagram – Visual Paradigm Community Circle .
- How to Draw Timing Diagram?
- Visual Paradigm. (n.d.). How to Draw Timing Diagram? .
- Time constraints Timing Diagram – UML – Discuss the Visual Paradigm
- Visual Paradigm Forums. (2019, July 19). Time constraints Timing Diagram – UML – Discuss the Visual Paradigm .
- Introduction to UML Diagrams in Visual Paradigm – ArchiMetric
- ArchiMetric. (2024, August 23). Introduction to UML Diagrams in Visual Paradigm – ArchiMetric .
- Timing Diagram, UML Diagrams Example: State / Condition Timeline – Visual Paradigm Community Circle
- Visual Paradigm Community Circle. (2018, September 24). Timing Diagram, UML Diagrams Example: State / Condition Timeline – Visual Paradigm Community Circle .
- UML Practical Guide – All you need to know about UML modeling
- Visual Paradigm. (n.d.). UML Practical Guide – All you need to know about UML modeling .
- Timing Diagram – UML 2 Diagrams – UML Modeling Tool
- Visual Paradigm. (n.d.). Timing Diagram – UML 2 Diagrams – UML Modeling Tool .
- Timing Diagram – Visual Paradigm Community Circle
- Visual Paradigm Community Circle. (n.d.). Timing Diagram – Visual Paradigm Community Circle .

