Introduction
Sequence diagrams are a crucial tool in software engineering for visualizing the interactions between objects in a system over time. They help in understanding the dynamic behavior of a system, designing its architecture, and documenting complex processes. This guide will cover the key concepts, guidelines, a real-life example, and a case study to help you master sequence diagrams.
Key Concepts
1. Lifelines
Lifelines represent the participants in the interaction, such as objects or actors. They are depicted as vertical dashed lines and show the existence of an object over time.
2. Messages
Messages are the arrows between lifelines that represent communication. They can be:
- Synchronous: Solid line with a filled arrowhead, indicating a method call that waits for a response.
- Asynchronous: Solid line with an open arrowhead, indicating a signal that does not wait for a response.
3. Activation Bars
Activation bars are rectangles on lifelines that show the duration of an operation or method execution. They indicate when an object is active and processing a message.
4. Combined Fragments
Combined fragments are used to handle complex interactions, such as loops, alternatives, and parallel processing. They help in organizing and managing complex message flows.
Guidelines for Creating Sequence Diagrams
1. Identify Use Cases
Start by identifying the key use cases for the system. A use case describes a specific interaction between a user and the system. This helps in focusing on the essential interactions that need to be modeled.
2. Define Participants
Determine the objects or actors involved in the scenario. Participants can be users, systems, or external entities that interact with the system.
3. Draw Lifelines
For each participant, draw a vertical dashed line representing their lifeline. This line shows the existence of the participant over time.
4. Add Messages
Draw arrows between lifelines to represent messages exchanged between participants. Label each message with its name and any relevant parameters. This helps in understanding the flow of communication.
5. Use Combined Fragments
For complex interactions, use combined fragments to show loops, alternatives, or parallel processing. This helps in managing and organizing complex message flows.
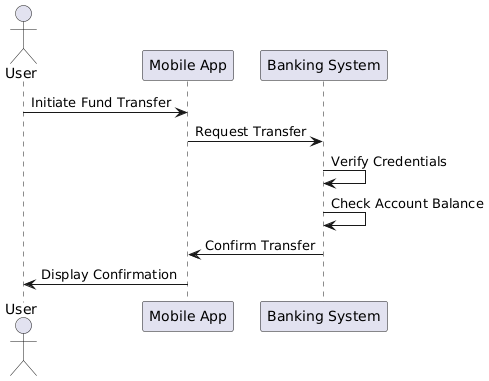
Real-Life Example: Mobile Banking App
Use Case: Transfer Funds
- User initiates a fund transfer.
- Mobile App sends a request to the Banking System.
- Banking System verifies the user’s credentials and checks the account balance.
- Banking System sends a confirmation message back to the Mobile App.
- Mobile App displays the confirmation to the User.

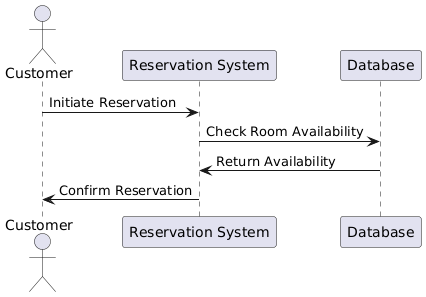
Case Study: Hotel Reservation System
Use Case: Make a Reservation
- Customer initiates a reservation request.
- Reservation System checks room availability.
- Reservation System sends a confirmation message back to the Customer.

Case Study: Sequence Diagram – Online Bookstore Order Processing
Actors:
- Customer: The user who browses the bookstore, selects books, and places an order.
- Bookstore System: The online platform that manages the catalog, user accounts, and order processing.
- Payment Gateway: An external service that handles payment transactions.
- Inventory System: Manages the stock levels of books.
Scenario: A customer visits the online bookstore, browses the catalog, selects books to purchase, and proceeds to checkout. The system verifies the availability of the selected books, processes the payment through a payment gateway, and updates the inventory. Finally, the customer receives an order confirmation.
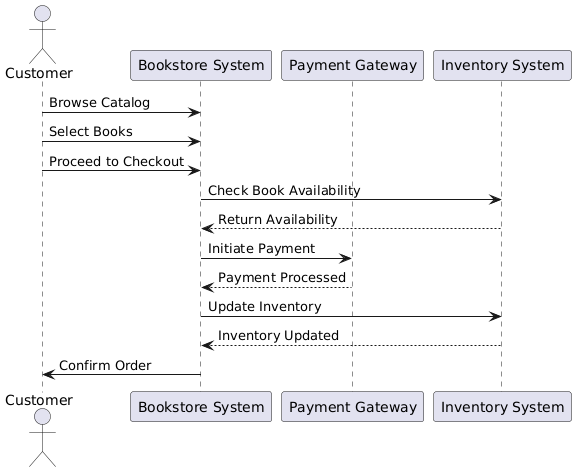
Sequence Diagram
The sequence diagram below illustrates the interactions between the Customer, Bookstore System, Payment Gateway, and Inventory System during the order processing scenario.

Explanation
- Customer browses the catalog on the Bookstore System.
- Customer selects books and proceeds to checkout.
- Bookstore System checks the availability of the selected books with the Inventory System.
- Inventory System returns the availability status to the Bookstore System.
- Bookstore System initiates the payment process with the Payment Gateway.
- Payment Gateway processes the payment and sends a confirmation back to the Bookstore System.
- Bookstore System updates the inventory in the Inventory System.
- Inventory System confirms the inventory update to the Bookstore System.
- Bookstore System sends an order confirmation to the Customer.
This sequence diagram helps visualize the flow of interactions and messages between different components of the online bookstore system during the order processing scenario.
Tips and Tricks for Creating Effective Sequence Diagrams
- Start with Use Cases:
- Define Clear Participants:
- Clearly define the objects or actors involved in the scenario. Participants can be users, systems, or external entities that interact with the system3.
- Use Descriptive Message Labels:
- Manage Complex Interactions:
- For complex interactions, use combined fragments to show loops, alternatives, or parallel processing. This helps in organizing and managing complex message flows2.
- Keep It Simple:
- Avoid overcomplicating the diagram. Focus on the key interactions and messages that are essential for understanding the use case. Too much detail can make the diagram hard to read and understand.
- Use Consistent Naming Conventions:
- Maintain consistency in naming participants, messages, and lifelines. This makes the diagram easier to read and understand.
- Add Notes and Comments:
- Use notes and comments to provide additional context or explanations where necessary. This can help clarify complex interactions or decisions in the diagram.
- Review and Iterate:
- Review your sequence diagram with stakeholders and team members. Gather feedback and iterate on the diagram to ensure it accurately represents the use case and is understandable to everyone involved.
- Use Tools for Efficiency:
- Document Assumptions and Constraints:
- Clearly document any assumptions or constraints that apply to the sequence diagram. This helps in understanding the context and limitations of the interactions modeled in the diagram.
By following these tips and tricks, you can create effective sequence diagrams that clearly communicate the dynamic behavior of your system and aid in designing and documenting complex processes.
Summary
Sequence diagrams are invaluable for visualizing and understanding the dynamic behavior of a system. By following the guidelines and using the key concepts, you can create clear and comprehensive sequence diagrams that help in designing and documenting complex systems. The real-life example and case study provide practical applications of sequence diagrams in different scenarios.
References
- Creating Sequence Diagrams with a Use Case-Driven Approach: A Comprehensive Guide
- UML Sequence Diagrams: Key Concepts and Comprehensive Guide
- Sequence Diagrams – Unified Modeling Language (UML)
- What is Sequence Diagram?
- Understanding Sequence Diagrams: A Comprehensive Guide
- Sequence diagram

