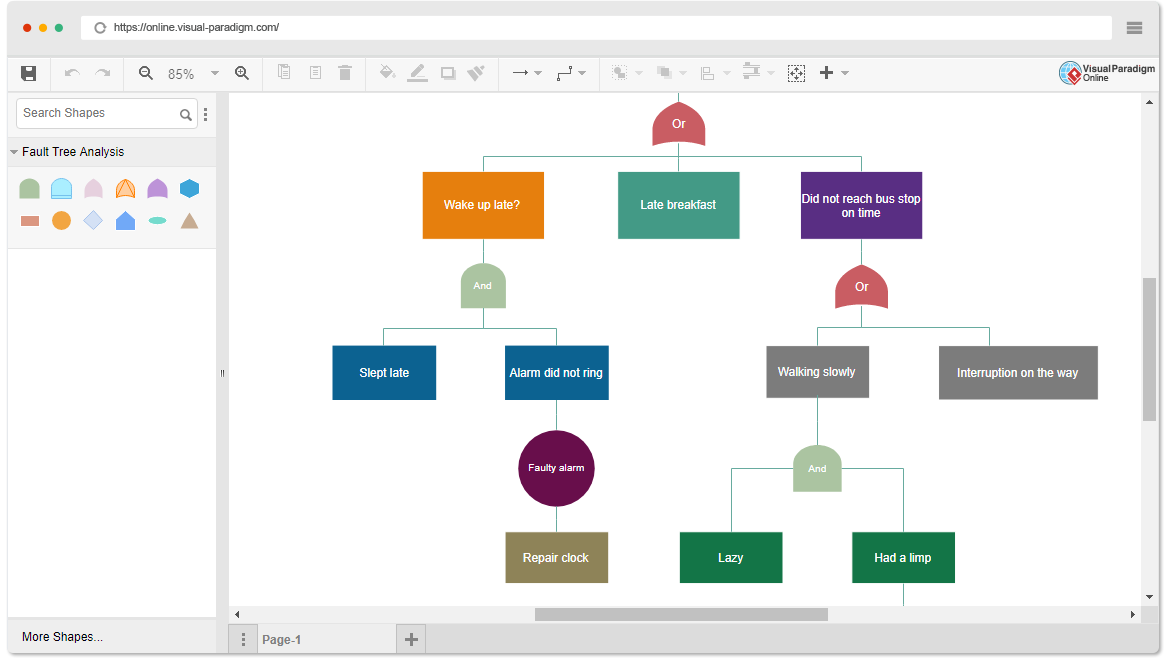
Fault tree analysis is one of the most commonly used methods in system reliability analysis. It is a process of system design or improvement by analyzing various factors that may lead to system failure, including hardware, software, environment, human factors, etc. By drawing the fault tree, we can determine the possible combinations of modes and the probability of the cause of the system failure. The failure probability of the system is calculated and the corresponding measures are taken.
Continue readingCategory: Brainstorming
A Comprehensive Guide for PDCA
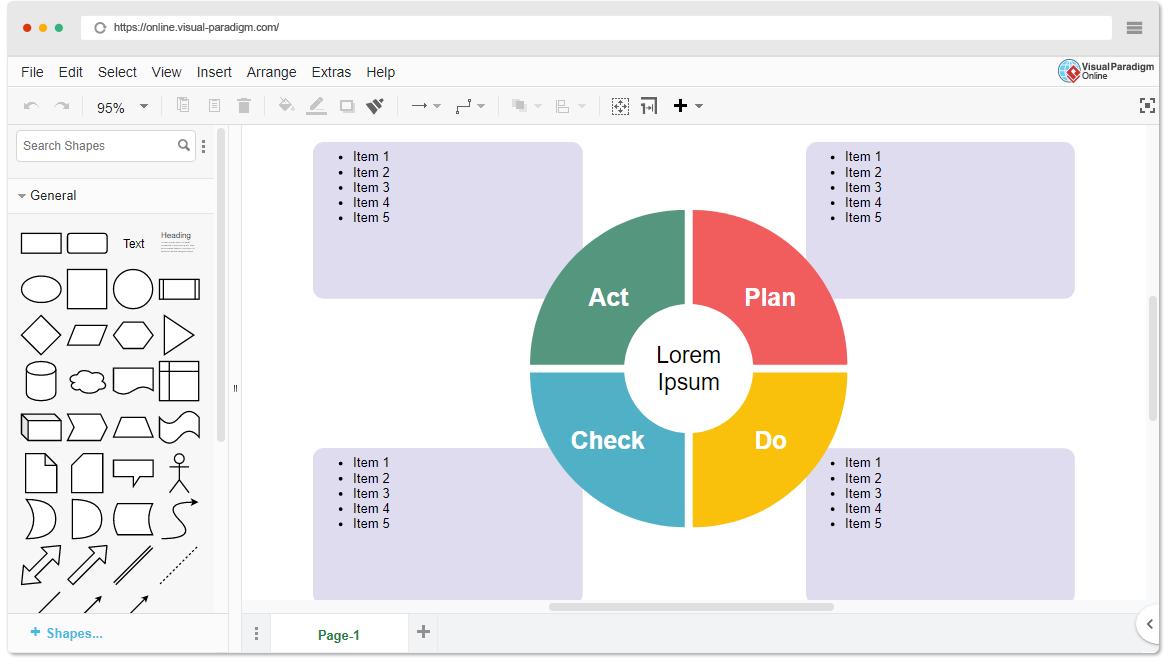
PDCA is considered one of the most popular frameworks for continuous improvement of business processes. PDCA (plan do check action), also known as Deming cycle, is the simplest framework for process improvement. Basically, it’s a series of feedback cycles of continuous improvement — you decide how it works, figure out how to improve it, eventually make changes, and keep repeating the cycle. I believe PDCA is the simplest and most effective way to help you improve your workflow.
Continue readingSix Thinking Hats Tutorial
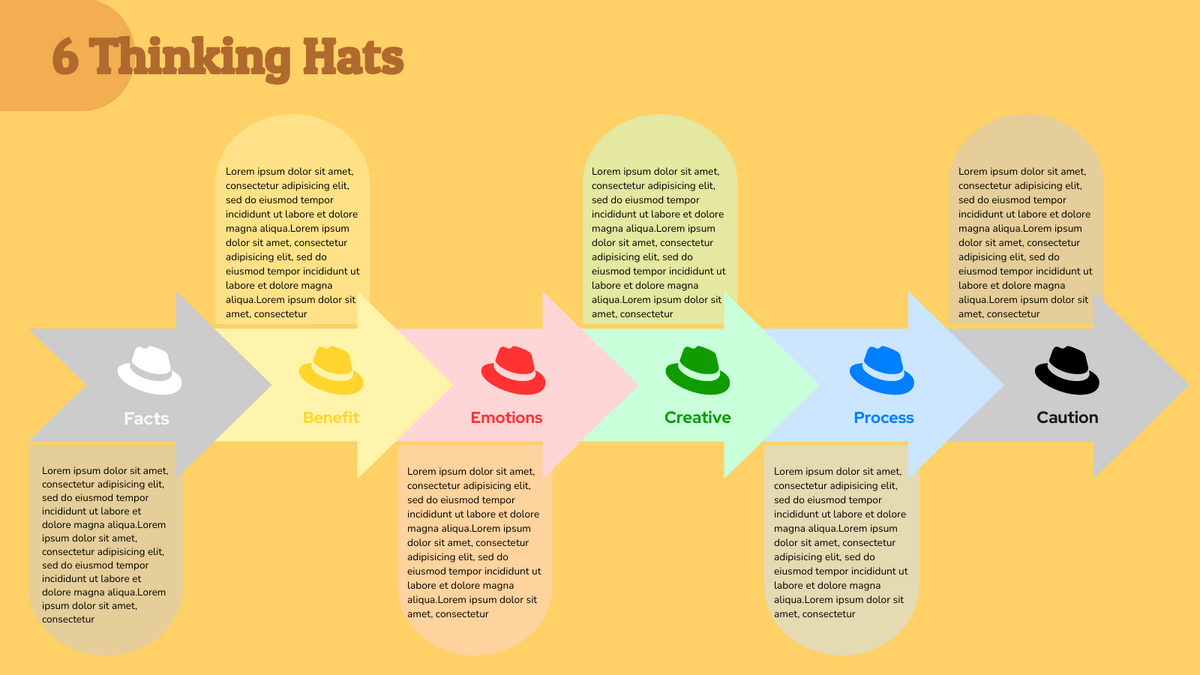
The six thinking hats technique, proposed Edward de Bono in 1999, encourages a group to approach the issue at hand from a number of different perspectives. This forces the team to move outside their habitual thinking style, and helps them to get a more rounded view of a situation. It is an important and powerful technique to debate an issue, solve a problem or to arrive at an important decision.
Continue readingA Comprehensive Guide to Lewin’s Change Model
Organizational Change is a common thread that runs through all businesses regardless of size, industry and age. It is about the process of changing an organization’s strategies, processes, procedures, technologies, and culture, as well as the effect of such changes on the organization. Kurt Lewin developed a change model involving three steps: unfreezing, changing and refreezing.
Continue readingA Comprehensive Guide to Kotter’s 8 Step Model of Change
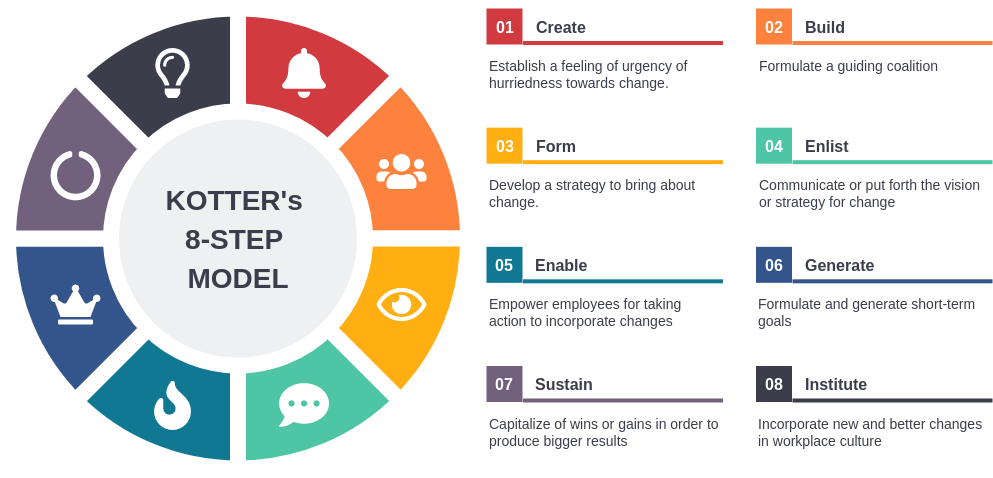
Kotter suggests that for change to be successful, 75% of the practice team needs to “buy into” the change. In other words, you have to really work hard on Step One, and spend significant time and energy building urgency, before moving onto the next steps. Don’t panic and jump in too fast because you don’t want to risk further short-term losses — if you act without proper preparation, you could be in for a very bumpy ride.
Continue readingA Comprehensive Guide to 5 Why Analysis
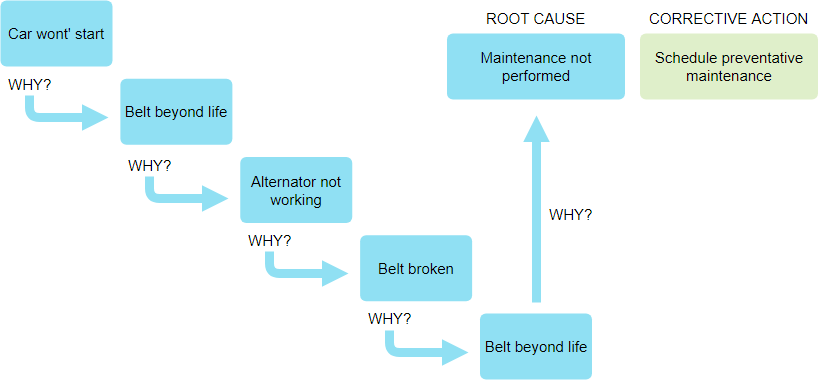
The 5 Whys is a simple tool used to help you understand what’s causing a problem by using an iterative interrogative technique to explore the root cause underlying a particular problem. As the name suggested, 5 Whys takes five iterations of asking “Why” to drill down from one symptom to another until you reached the root cause (Sometimes asking “Why?” five times is too many, and sometimes you need to ask it more than five times).
Continue readingBusiness Model Canvas — Learn By Examples with Free Online Software
Business Model Canvas is a strategic and business management template for developing new or documenting existing business models. It is a visual chart with elements describing a firm’s or product’s value proposition, infrastructure, customers, and finances.
Continue readingDecision Table: Clearer Logic and Better Decision
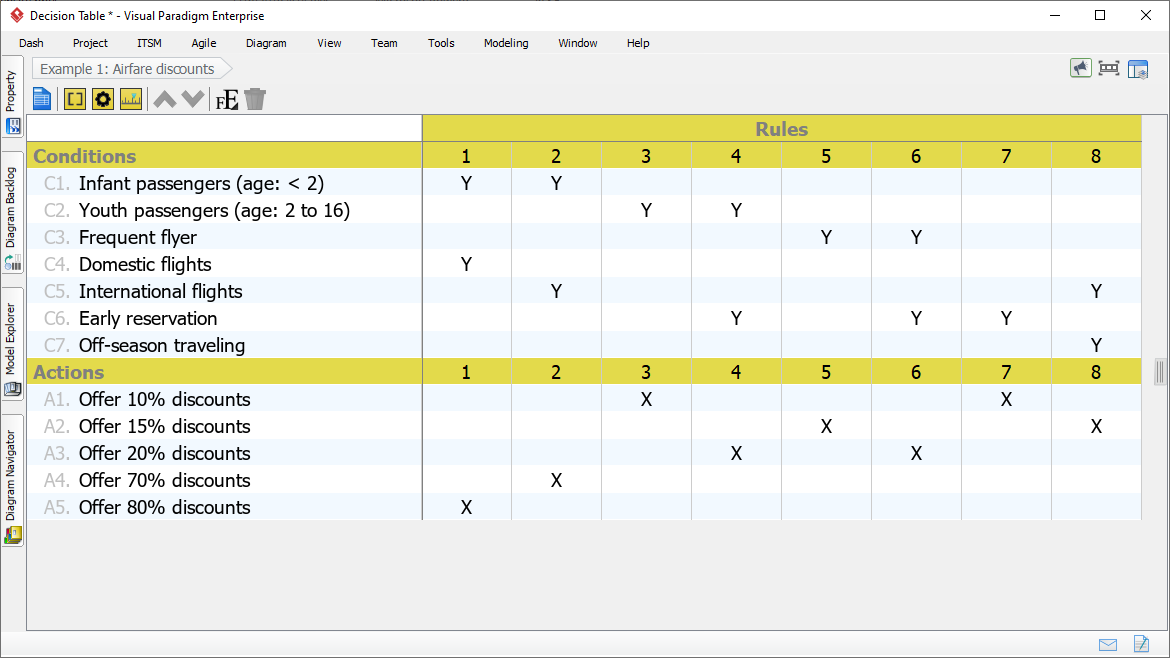
A decision table is an excellent tool to use in both testing and requirements management. Essentially it is a structured exercise to formulate requirements when dealing with complex business rules. In a decision table, business logic is well divided into conditions, actions (decisions) and rules for representing the various components that form the business logic.
Continue readingMind Map — A Practical Tutorial with 30+ Examples
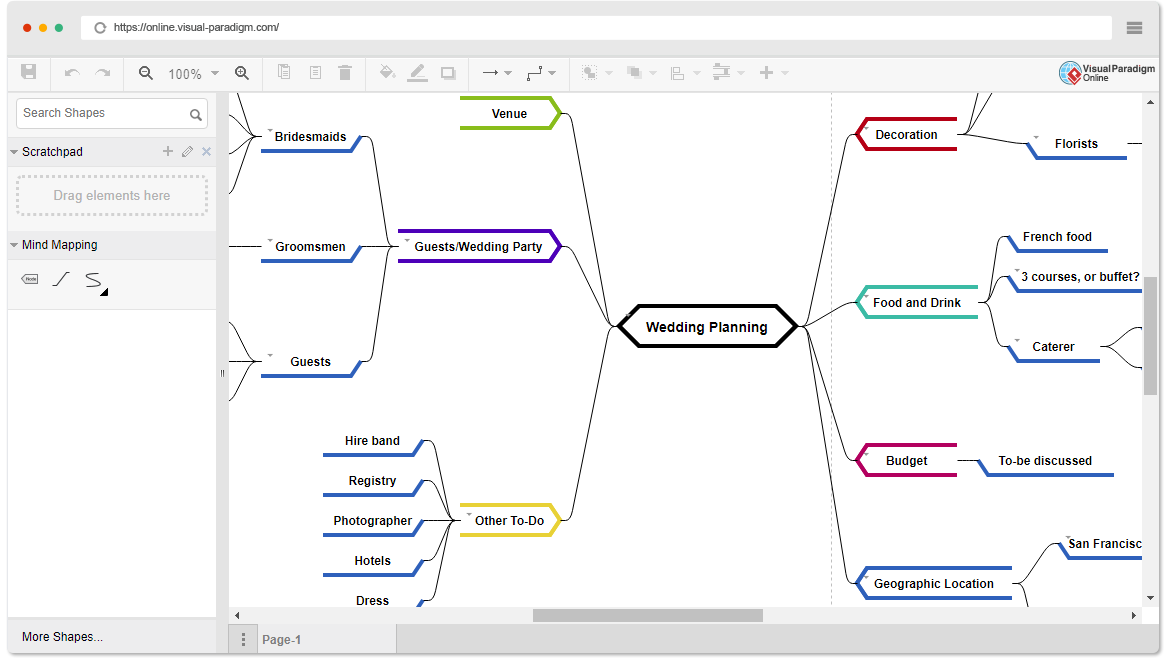
Mind mapping is an effective means to take notes and brainstorm essay topics. A mind map involves writing down a central theme and thinking of new and related ideas which radiate out from the center. By focusing on key ideas written down in your own words and looking for connections between them, you can map knowledge in a way that will help you to better understand and retain information.
Continue readingFishbone Diagram — How to Draw?
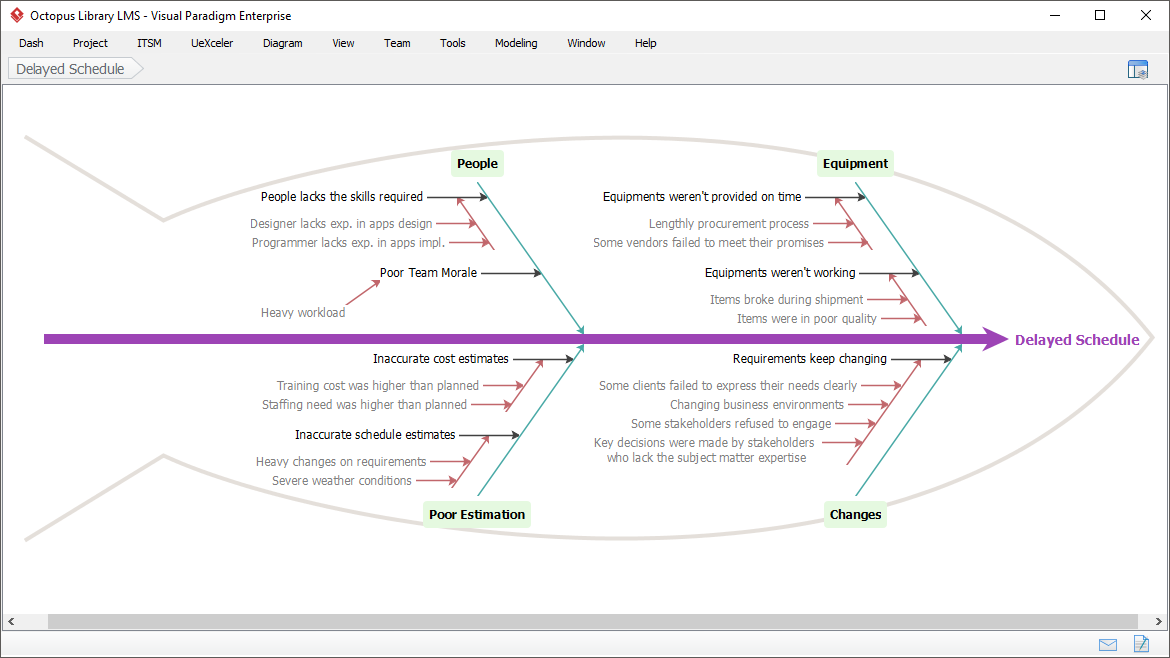
A fishbone diagram (also known as a cause and effect diagram or Ishikawa diagram) visually shows multiple causes of a problem. It helps identify stakeholder ideas about the cause of an issue and allows users to immediately categorize ideas into themes for analysis or further data collection. It can be used in conjunction with the “Five Whys” technique.
Continue reading