In today’s data-driven world, effective data visualization is crucial for making informed decisions. Visual Paradigm Online offers a powerful chart
Continue reading
Learning one new thing everyday


In today’s data-driven world, effective data visualization is crucial for making informed decisions. Visual Paradigm Online offers a powerful chart
Continue reading
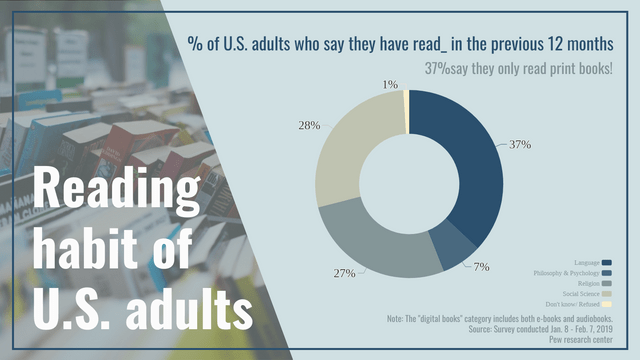
Doughnut charts are a powerful and visually appealing way to present data, especially when you want to show the proportion
Continue reading
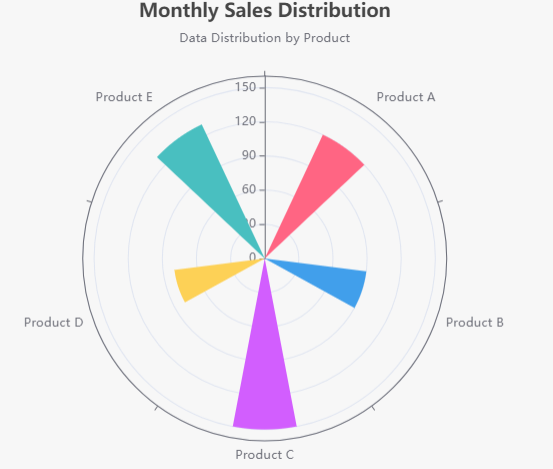
In the world of data visualization, selecting the appropriate chart type is crucial for effectively communicating insights. Two commonly used
Continue reading
Double Doughnut Charts, also known as comparative Doughnut Charts, are a powerful tool for visualizing hierarchical data in a circular
Continue reading
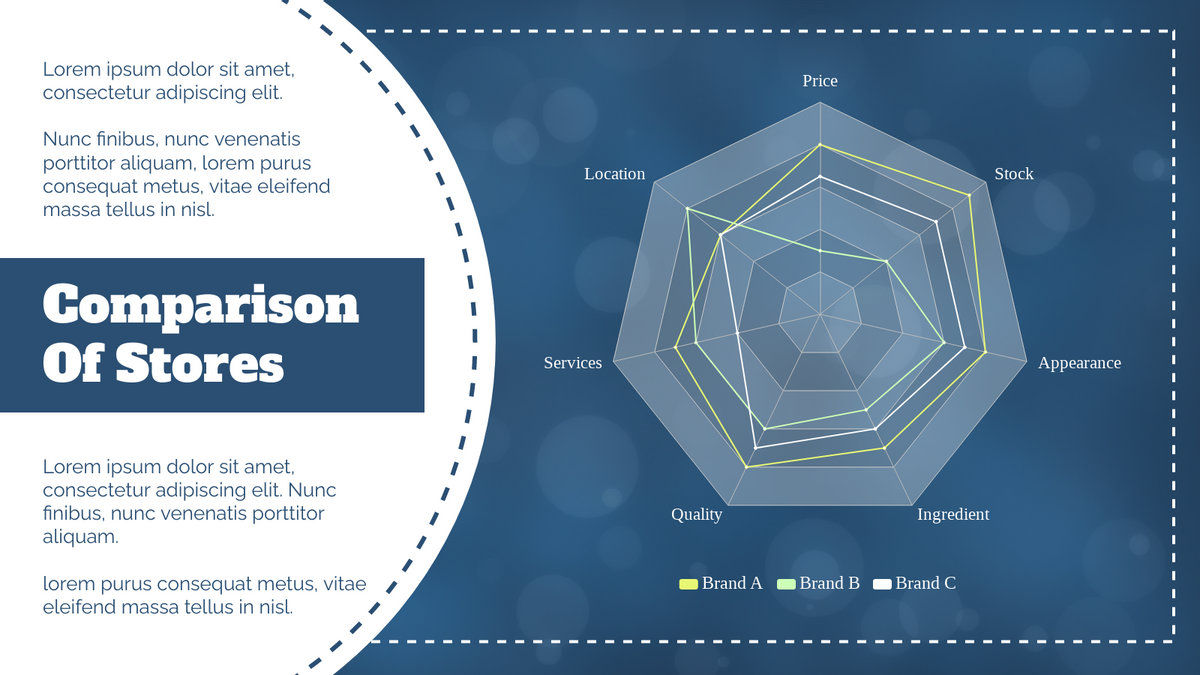
Radar charts, also known as spider charts or web charts, are powerful tools for visualizing multivariate data. They allow you
Continue reading
In the realm of data visualization, having the right tools can make all the difference. Visual Paradigm Online stands out
Continue reading