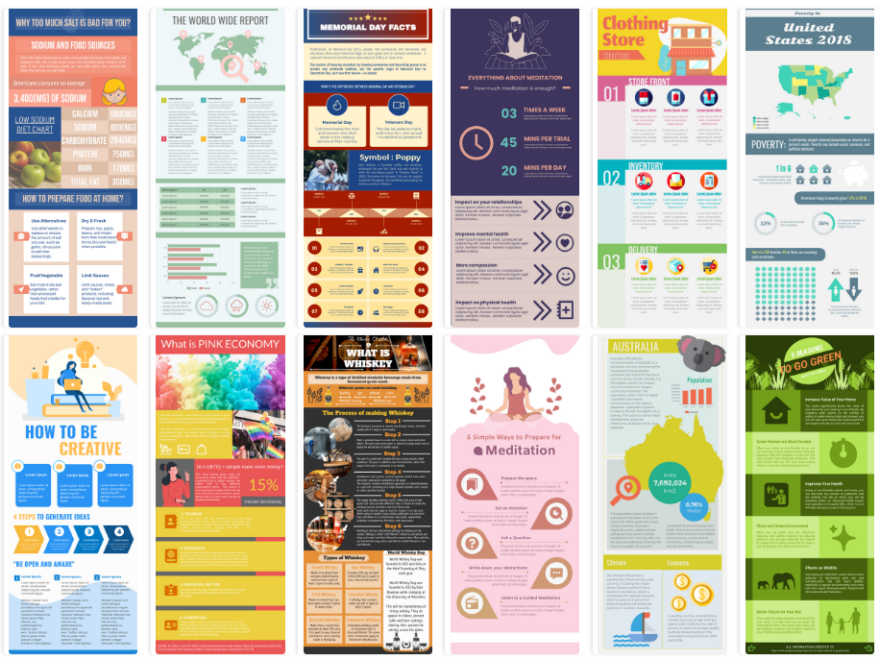
If a picture is worth a thousand words, how much is an infographic worth? Infographics have both text and pictures, so they represent the best of both worlds. If you don’t have design skills, how can you collect research and data into an attractive infographic? Fortunately, there are a good free infographic design tool that can help you create fascinating professional infographics. Whether it is to create social media infographics for your website or for professional presentations, you can use a variety of high-quality tools to make beautiful infographics.
Continue readingCategory: Infographics
Design professional isometric illustration
Like social media, isometric design allows you to have more perspectives on the subject. Isometric technology also allows you to display more details with less complexity. With the ability to display 3D space, it can open corners and gaps that were previously unusable. Give the design more space to accommodate your creativity. They can see the sides and top of the design and let the audience know more. Create eye-catching printable isometric diagrams. Personalize it for free to suit your brand and event, and the product or service looks great in 3D.
Continue readingMake an eye-catching CV with Infographic
The traditional “apply and wait” application process is no longer adopted by many employers. Today, they browse for career seekers on social media, i.e. LinkedIn, visit blog or personal websites and consider more creative job applications. Infographic CV are a creative way for employers to be persuaded that they deserve your attention. Although infographic CVs typically do not replace standard resumes entirely, they are perfect for a blog or social networking site to view, upload, and attach to as a visual portfolio in your applications.
Continue readingHow to Make a beautiful postcard in Just Minutes
Still remember the last time you were in a book shop: Remember that row of ordinary, monotonous postcards? Whether you’re promoting your business, promoting your new product campaign, or creating a fun personal greeting on a social network, you can start with a great postcard. Skip the business-heavy box and create something unique! Use Visual Paradigm Infographic to design your own postcard to show your friends, fans, and loved ones that you care.
Continue readingCreate 2020 Christmas Cards for FREE
A lot of families are preparing to forgo their regular holiday celebrations this year due to the COVID-19 pandemic. Many that miss the celebrations may plan to have video meeting for their long-distance party as well as sharing for their pretty Christmas cards which will make everyone feel a bit more connected to their friends, relatives or loved ones.
Continue readingCreating Impressive Infographic in 5 Minutes
Infographics refers to the visual representation of data, information or knowledge. Infographics are used as a powerful tool that allows people to easily digest information through the use of perspective data, charts, and statistics.
Continue readingA Comprehensive Guide to 5 Why Analysis
The 5 Whys is a simple tool used to help you understand what’s causing a problem by using an iterative interrogative technique to explore the root cause underlying a particular problem. As the name suggested, 5 Whys takes five iterations of asking “Why” to drill down from one symptom to another until you reached the root cause (Sometimes asking “Why?” five times is too many, and sometimes you need to ask it more than five times).
Continue readingVenn Diagram: A Comprehensive Tutorial
Venn diagrams are graphical or pictorial representations of relationships between different groups of things. Venn Diagram was invented by John Venn around 1880. Venn diagrams are also called set diagrams. Venn diagrams give a logical representation of the groups or sets. Relationships between two or three sets can be easily understood with the help of Venn diagrams. In mathematics, Venn diagrams are used to analyze known information obtained from surveys, data reports, and tables.
Continue readingVisualize Data with Online Charts
Choose from over 50 chart types to find the perfect representation of your data. Both common and advanced chart types are supported, including bar, line, area, pie, doughnut, radar, and rose charts. Visualize your data and statistics quickly and easily with Visual Paradigm’s online chart maker.
Continue readingThe Best Easy Dashboard for BI 2019
The latest update of Visual Paradigm Online features a powerful dashboard software, which is a highly configurable data visualization tool that help people see and understand their data easily. Visual Paradigm Online helps you visualize your data into valuable insights. Build dashboards and perform ad-hoc data analyses in just a few steps. A wide range of chart and graph are available to fulfill different business needs. Together with the intuitive spreadsheet editor, anyone can visualize data in few minutes. No coding, just insight.
Continue reading