What is SWOT Analysis? SWOT consists of four aspects, starting with the first character of the word: ” Strengths”, “Weaknesses”,
Continue reading
Learning one new thing everyday


What is SWOT Analysis? SWOT consists of four aspects, starting with the first character of the word: ” Strengths”, “Weaknesses”,
Continue reading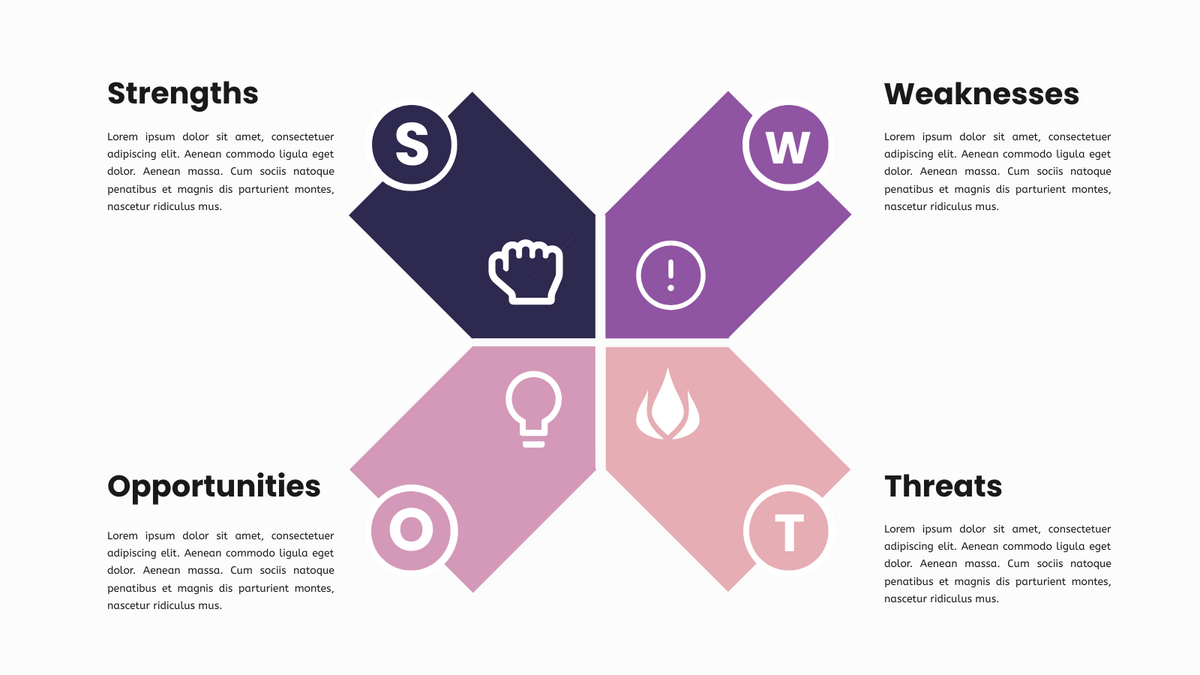
What is SWOT Analysis? SWOT Analysis (also known as strengths, weaknesses, opportunities and threats analysis) is the easiest way to
Continue reading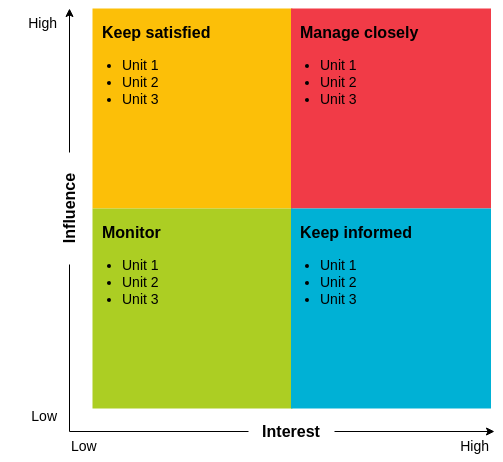
Stakeholder Analysis is a project management tool. It helps to identify internal and external stakeholders that may influence or be influenced by the solutions proposed during the project implementation which an important process that successful people use to win support from others. Managing stakeholders can help you to ensure that your projects succeed where others might fail.
Continue reading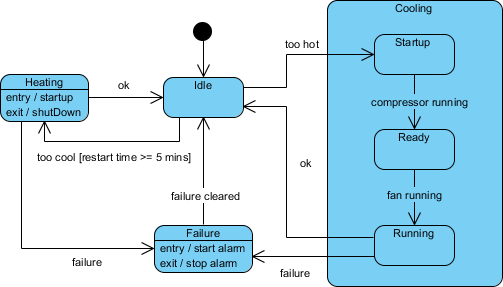
A simple state is one which has no substructure. A state which has substates (nested states) is called a composite state. Substates may be nested to any level. A nested state machine may have at most one initial state and one final state. Substates are used to simplify complex flat state machines by showing that some states are only possible within a particular context (the enclosing state).
Continue reading
Strategic analysis is the core step of the strategic planning cycle. Every strategist should have a set of analytical model tools to deal with. However, there are many techniques and tools available for strategic analysis. If you search Google on the Internet, you will find many options available.
Continue reading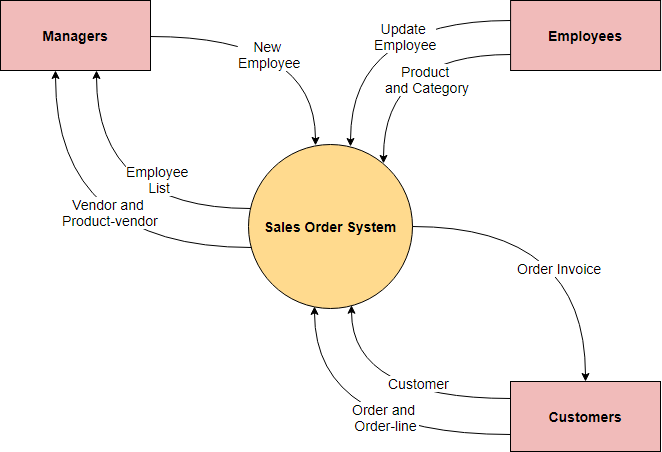
The context diagram shows the system considered as a single high-level process, and then shows the relationship of the system to other external entities (systems, organizational groups, external data stores, and so on). Another name for a context diagram is a context-level data flow graph or 0-level DFD.
Continue reading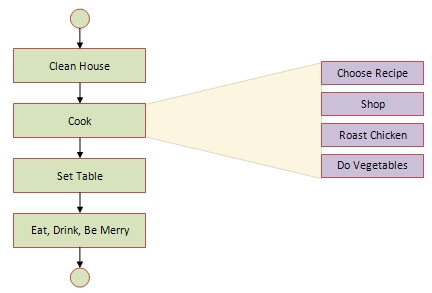
One of the effective way to solve a complex problem is to break it down into simpler sub-problems. You start by breaking down the whole task into simpler parts. Step-by-step refinement is essentially a decomposition of the system to gain insight into the subsystems that make up the system, known as the top-down decomposition method.
Continue reading
A Scatter Plot (also known as a scatter Chart, and Correlation Plot) is a tool for analyzing the relationship between two variables, used to determine the degree of correlation between two variables. One variable is plotted on the horizontal axis and the other on the vertical axis. The pattern of their intersection points graphically displays the relational pattern. It is one of the Seven Basic Tools of Quality.
Continue reading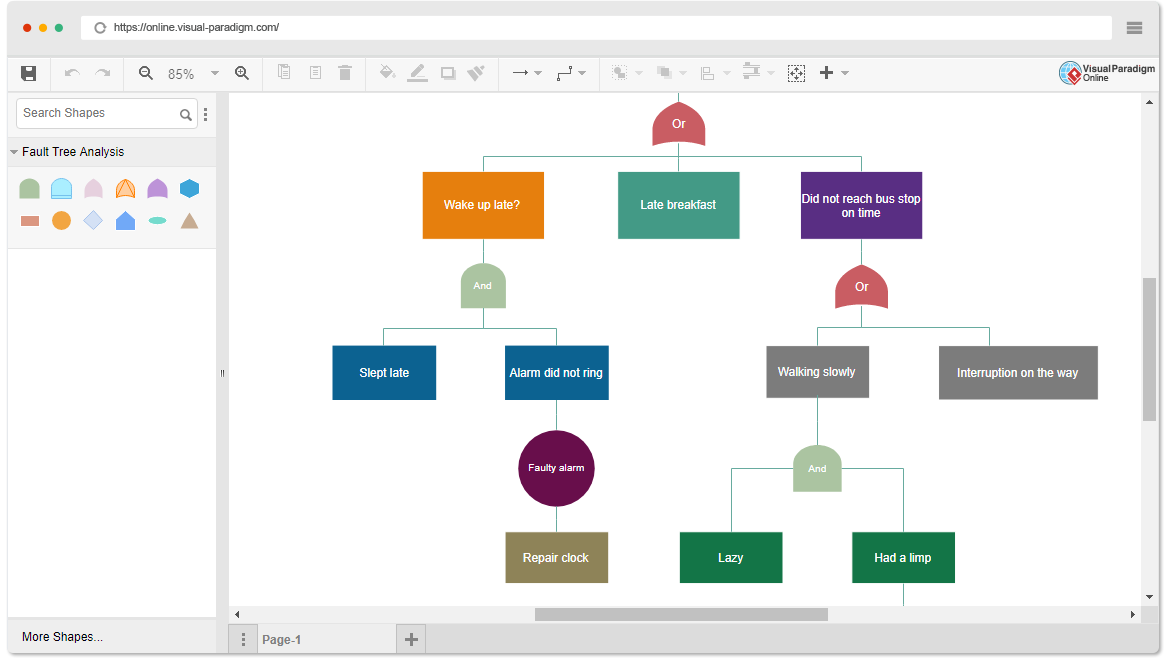
Fault tree analysis (FTA) is a top-down deductive fault analysis in which Boolean logic is used in conjunction with a series of low-level events to analyze the unexpected states of the system. This analysis method is primarily used in safety engineering and reliability engineering to understand how systems fail, determine the best way to reduce risk, and determine (or feel) the event rate of safety incidents or specific system-level (functional) failures.
Continue reading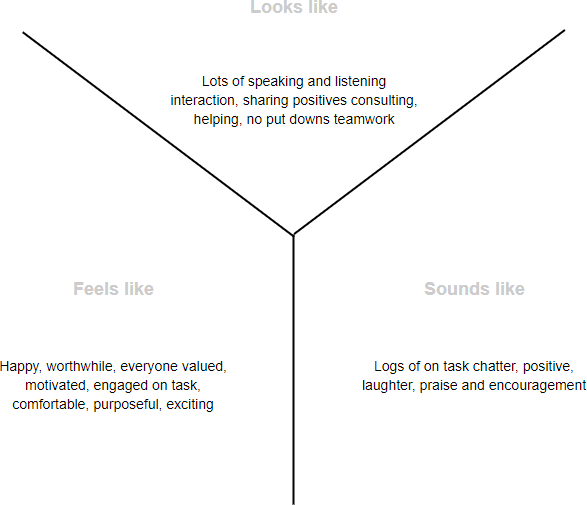
Both T-charts and Y-charts help to graphically organize and record ideas, feelings and information, while identifying and focusing on what teachers / students already know, understand, value and can do. It enables students / teachers / teachers to compare and contrast ideas, feelings and information in various context.
Continue reading