


Introduction to Flowcharts
Flowcharts are visual representations of processes, algorithms, or workflows. They use standardized symbols and arrows to illustrate the sequence of steps, decisions, and actions involved in a process. Flowcharts are widely used in various fields, including software development, business process management, and engineering, to simplify complex processes and improve communication among stakeholders.
Key Components of Flowcharts
Flowcharts consist of several key components, each represented by specific shapes and symbols:
- Start/End: Represented by an oval or rounded rectangle, these symbols indicate the beginning and end of a process.
- Process: Represented by a rectangle, this symbol denotes a specific task or action within the process.
- Decision: Represented by a diamond, this symbol indicates a point where a decision is made, leading to different paths based on the outcome.
- Input/Output: Represented by a parallelogram, this symbol denotes input or output operations.
- Flow Lines: Arrows that connect the symbols, showing the direction of the process flow.
Example Flowchart: Robot Vacuum Cleaner Operation
Let’s walk through an example flowchart that illustrates the operation of a robot vacuum cleaner. This example will demonstrate the key components and steps involved in creating a flowchart.
Step-by-Step Explanation
-
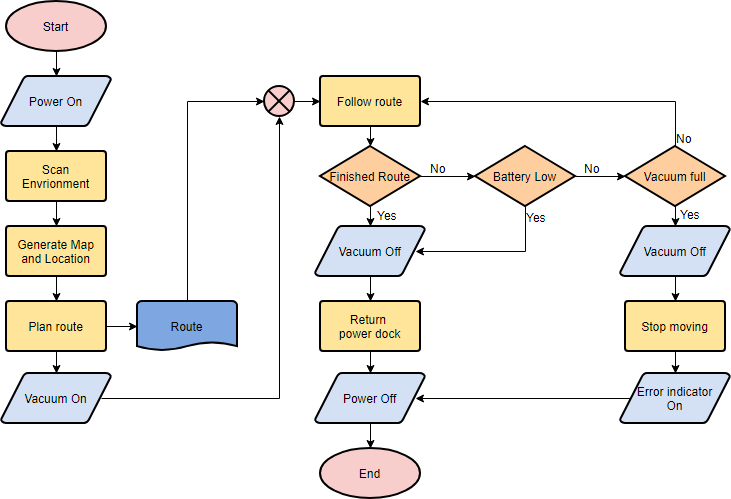
Start: The flowchart begins with a “Start” symbol, indicating the initiation of the process.
-
Power On: The first process step is to power on the robot vacuum cleaner. This is represented by a rectangle labeled “Power On.”
-
Scan Environment: The next process step is to scan the environment to understand the layout and obstacles. This is represented by another rectangle labeled “Scan Environment.”
-
Generate Map and Location: The process then moves to generate a map of the environment and determine the robot’s location. This is represented by a rectangle labeled “Generate Map and Location.”
-
Plan Route: Based on the map and location, the robot plans its cleaning route. This is represented by a rectangle labeled “Plan Route.”
-
Vacuum On: The vacuum function is activated, and the robot starts cleaning. This is represented by a rectangle labeled “Vacuum On.”
-
Follow Route: The robot follows the planned route to clean the area. This is represented by a rectangle labeled “Follow Route.”
-
Decision: Finished Route?: The process reaches a decision point where it checks if the route is finished. This is represented by a diamond labeled “Finished Route?”
- If Yes, the robot turns the vacuum off and returns to the power dock.
- If No, the process checks if the battery is low.
-
Decision: Battery Low?: If the route is not finished, the process checks if the battery is low. This is represented by a diamond labeled “Battery Low?”
- If Yes, the robot turns the vacuum off and returns to the power dock.
- If No, the process checks if the vacuum is full.
-
Decision: Vacuum Full?: If the battery is not low, the process checks if the vacuum is full. This is represented by a diamond labeled “Vacuum Full?”
- If Yes, the robot turns the vacuum off and stops moving.
- If No, the robot continues to follow the route.
-
Return Power Dock: If the route is finished or the battery is low, the robot returns to the power dock. This is represented by a rectangle labeled “Return Power Dock.”
-
Power Off: The robot powers off, and the process ends. This is represented by a rectangle labeled “Power Off.”
-
Error Indicator On: If the vacuum is full, the robot stops moving and turns on the error indicator. This is represented by a rectangle labeled “Error Indicator On.”
-
End: The flowchart concludes with an “End” symbol, indicating the completion of the process.
Flowchart Diagram
Detailed Explanation of Each Step
- Start: The process begins.
- Power On: The robot vacuum cleaner is powered on.
- Scan Environment: The robot scans the environment to understand the layout and obstacles.
- Generate Map and Location: The robot generates a map of the environment and determines its location.
- Plan Route: The robot plans its cleaning route based on the map and location.
- Vacuum On: The vacuum function is activated, and the robot starts cleaning.
- Follow Route: The robot follows the planned route to clean the area.
- Decision: Finished Route?: The process checks if the route is finished.
- If Yes, the robot turns the vacuum off and returns to the power dock.
- If No, the process checks if the battery is low.
- Decision: Battery Low?: The process checks if the battery is low.
- If Yes, the robot turns the vacuum off and returns to the power dock.
- If No, the process checks if the vacuum is full.
- Decision: Vacuum Full?: The process checks if the vacuum is full.
- If Yes, the robot turns the vacuum off and stops moving.
- If No, the robot continues to follow the route.
- Return Power Dock: The robot returns to the power dock.
- Power Off: The robot powers off.
- Error Indicator On: The robot turns on the error indicator if the vacuum is full.
- End: The process ends.
Benefits of Using Flowcharts
Flowcharts offer several benefits, including:
- Clarity: They provide a clear and concise visual representation of complex processes, making them easier to understand.
- Communication: Flowcharts facilitate better communication among team members by providing a common language for discussing processes.
- Efficiency: They help identify inefficiencies and bottlenecks in processes, leading to improved performance.
- Documentation: Flowcharts serve as valuable documentation for training, auditing, and compliance purposes.
Conclusion
Flowcharts are essential tools for visualizing and understanding processes. By breaking down complex workflows into simple, standardized symbols, flowcharts enhance clarity, communication, and efficiency. Whether you are a software developer, business analyst, or engineer, mastering the art of creating flowcharts can significantly improve your ability to manage and optimize processes. The example provided in this article demonstrates the steps involved in creating a flowchart, from start to end, and highlights the key components and benefits of using flowcharts in various applications.
References
- Online Flowchart Tool – Visual Paradigm’s online flowchart tool is described as the easiest and most powerful in the world, allowing users to create diagrams quickly and collaboratively. It supports creating flowcharts from scratch or using templates.
- Flowchart Tutorial (with Symbols, Guide and Examples) – This tutorial provides a step-by-step guide on how to draw flowcharts using Visual Paradigm. It covers the basics of flowcharts, their symbols, and examples to help users understand and create flowcharts effectively.
- Free Online Flowchart Maker – Visual Paradigm Online offers a free flowchart maker with an intuitive drag-and-drop editor. It includes extensive built-in templates and allows users to create professional flowcharts quickly and easily.
- Flowchart Templates – This resource provides a variety of free online flowchart templates and examples. Users can sign up to create a free online workspace and start designing professional flowcharts using Visual Paradigm’s online flowchart maker.
- Flowchart Tutorial – This tutorial covers what a flowchart is, how to create one, and when to use it. It includes flowchart examples and tips, helping users learn about flowcharts and how to draw them step-by-step using Visual Paradigm.
- Easy-to-Use Flowchart Maker – Visual Paradigm is highlighted as an intuitive and powerful flowchart software, ideal for users who need a reliable and easy-to-use tool for creating visually appealing flowcharts quickly.
- Free Online Flowchart Editor – Visual Paradigm Online features a state-of-the-art online flowchart editor that allows users to create flowcharts flexibly and simply. It supports various diagram types, including mind maps, org charts, UML, ERD, and floor plans.
- Web-Based Free Flowchart Maker – This web-based flowchart maker by Visual Paradigm Online supports creating professional and beautiful flowcharts online. It offers drag-and-drop functionality, alignment tools, grouping, and formatting tools for easy diagramming.
- The Flowchart is an Online Visual Paradigm – Yonyx – This article discusses flowcharts as an online visual paradigm that promotes ideation, investigation, revision, experimentation, and deep visualization. It explores how flowcharts can be used to model processes and develop new concepts.
- Free Flowchart Tool – Visual Paradigm Online offers a free flowchart tool that allows users to create exceptional flowcharts online. It supports inserting text, external graphics, and links, making flowcharts rich in content and visually tidy.
This post is also available in Deutsch, Español, فارسی, Français, English, Bahasa Indonesia, 日本語, Polski, Portuguese, Ру́сский, Việt Nam, 简体中文 and 繁體中文.