Introduction
In today’s competitive business environment, optimizing processes is crucial for maintaining efficiency and customer satisfaction. One powerful tool for achieving this is the swimlane activity diagram. This guide will walk you through the steps of identifying a problem scenario, creating a swimlane activity diagra, interpreting the findings, and formulating actions for improvement.
Problem Scenario
Let’s consider a manufacturing company experiencing delays in its order fulfillment process. The process involves multiple departments: Sales, Production, Quality Control, and Shipping. These delays are leading to customer dissatisfaction and increased operational costs. The company aims to use a swimlane activity diagram to model the current process, identify bottlenecks, and implement improvements.
Creating a Swimlane Activity Diagram
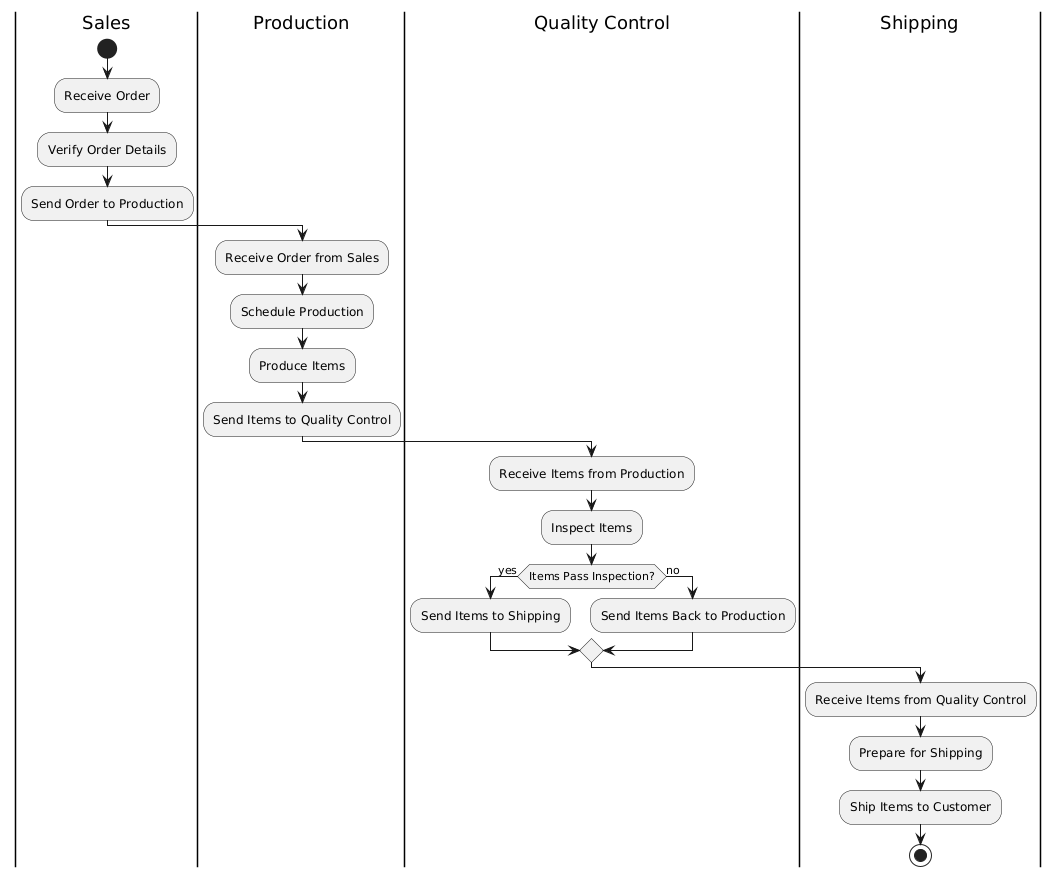
A swimlane activity diagram visually represents the process flow, highlighting the responsibilities of each department and the sequence of activities.

Interpreting the Swimlane Activity Diagram
- Identifying Bottlenecks:
- The diagram reveals that the Quality Control department is a potential bottleneck. If items do not pass inspection, they are sent back to Production, causing delays.
- The Shipping department is dependent on the timely completion of tasks by Quality Control, which can lead to further delays if there are issues in the previous steps.
- Pinpointing Inefficiencies:
- There is a lack of parallel processing. For example, the Production department waits for the order to be verified by Sales before starting production, which could be optimized.
- Redundancies exist in the communication between Production and Quality Control, as items may be sent back and forth multiple times.
- Recognizing Communication Gaps:
- The diagram shows that there is a linear flow of information, which can lead to delays if any department faces issues. Improved communication and parallel processing could mitigate these delays.
Formulating Actions for Improvement
- Implement Parallel Processing:
- Introduce parallel processing where possible. For example, the Production department can start preparing for production as soon as the order is received, even before the order details are fully verified by Sales.
- Enhance Quality Control:
- Improve the Quality Control process to reduce the number of items sent back to Production. This can be achieved by investing in better inspection tools or training the Quality Control team.
- Strengthen Communication:
- Enhance communication between departments to ensure that any issues are quickly addressed. This can be done by implementing a real-time communication system or regular cross-departmental meetings.
- Eliminate Redundancies:
- Identify and eliminate redundant steps in the process. For example, ensure that the Production department receives clear and complete instructions to minimize the need for rework.
- Optimize Resource Allocation:
- Allocate additional resources to the Quality Control department to handle the inspection process more efficiently. This can include hiring more staff or investing in automated inspection tools.
Summary of Findings and Actions
| Finding | Action for Improvement |
|---|---|
| Bottleneck in Quality Control | Enhance the Quality Control process by investing in better inspection tools or training. |
| Lack of Parallel Processing | Implement parallel processing where possible, such as starting production preparation early. |
| Redundancies in Communication | Improve communication between departments using real-time systems or regular meetings. |
| Linear Flow of Information | Introduce parallel processing and enhance communication to mitigate delays. |
| Dependency of Shipping on Quality Control | Allocate additional resources to Quality Control to handle inspections more efficiently. |
| Items Sent Back and Forth | Ensure clear and complete instructions to Production to minimize rework. |
This table provides a clear overview of the identified issues and the corresponding actions needed to address them, ensuring a structured approach to process improvement.
Conclusion
By following this comprehensive guide, you can effectively use swimlane activity diagrams to identify and address inefficiencies in your processes. The visual representation provided by these diagrams makes it easier to pinpoint bottlenecks, improve communication, and implement changes that enhance overall efficiency. This approach not only helps in reducing delays but also ensures higher customer satisfaction and operational excellence.
References
- Activity Diagram, UML Diagrams Example: Swimlane
- A Guide to Swimlane Activity Diagrams
- How to Draw Activity Diagram?
- Activity Diagram, UML Diagrams Example: Swinlane Proposal Process
- How to Draw an Activity Diagram in UML?
- Activity Diagram Tutorial
- What is Activity Diagram?
- Activity Diagram 2 with Swimlanes
- Activity Diagram, UML Diagrams Example: Swimlane for Order Fulfilment
- ATM Activity Diagram with Swimlanes

