Introduction
An Activity Diagram is a type of behavioral diagram in the Unified Modeling Language (UML) used to describe dynamic aspects of a system. It is essentially an advanced version of a flowchart that models the flow from one activity to another. This guide will provide a detailed overview of Activity Diagrams, including their purpose, components, and how to create them.
What is an Activity Diagram?
An Activity Diagram is a graphical representation of workflows of stepwise activities and actions with support for choice, iteration, and concurrency. It is used to model the functionality of a system by describing the sequence of activities that need to be performed to achieve a specific goal.

When to Use Activity Diagrams
Activity Diagrams are particularly useful in the following scenarios:
- Identifying Candidate Use Cases: By examining business workflows.
- Identifying Pre- and Post-Conditions: For use cases to understand the context.
- Modeling Workflows: Between or within use cases.
- Modeling Complex Workflows: In operations on objects.
- Detailing Complex Activities: In a high-level Activity Diagram.
Components of an Activity Diagram
Basic Elements
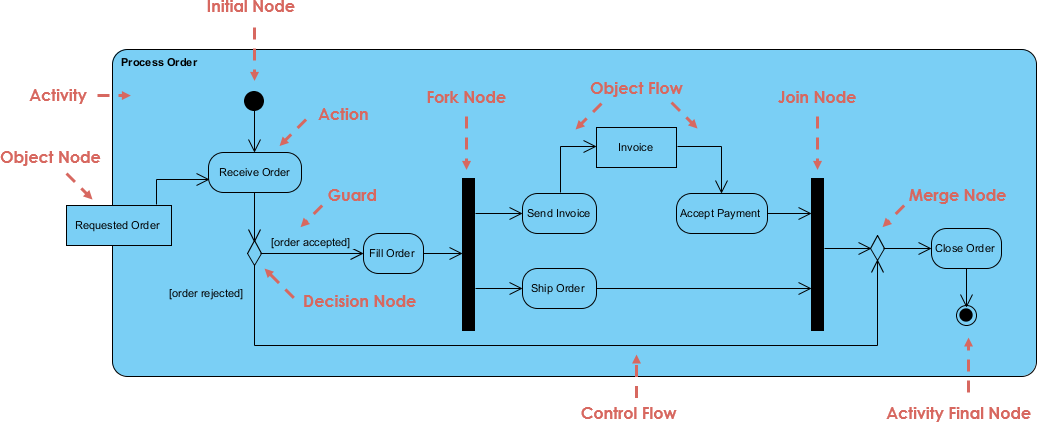
- Activity: Represents a set of actions.
- Action: A task to be performed.
- Control Flow: Shows the sequence of execution.
- Object Flow: Shows the flow of an object from one activity (or action) to another.
- Initial Node: Portrays the beginning of a set of actions or activities.
- Activity Final Node: Stops all control flows and object flows in an activity.
- Object Node: Represents an object connected to a set of Object Flows.
- Decision Node: Represents a test condition to ensure that the control flow or object flow only goes down one path.
- Merge Node: Brings back together different decision paths created using a decision node.
- Fork Node: Splits behavior into a set of parallel or concurrent flows of activities.
- Join Node: Brings back together a set of parallel or concurrent flows of activities.
Advanced Elements
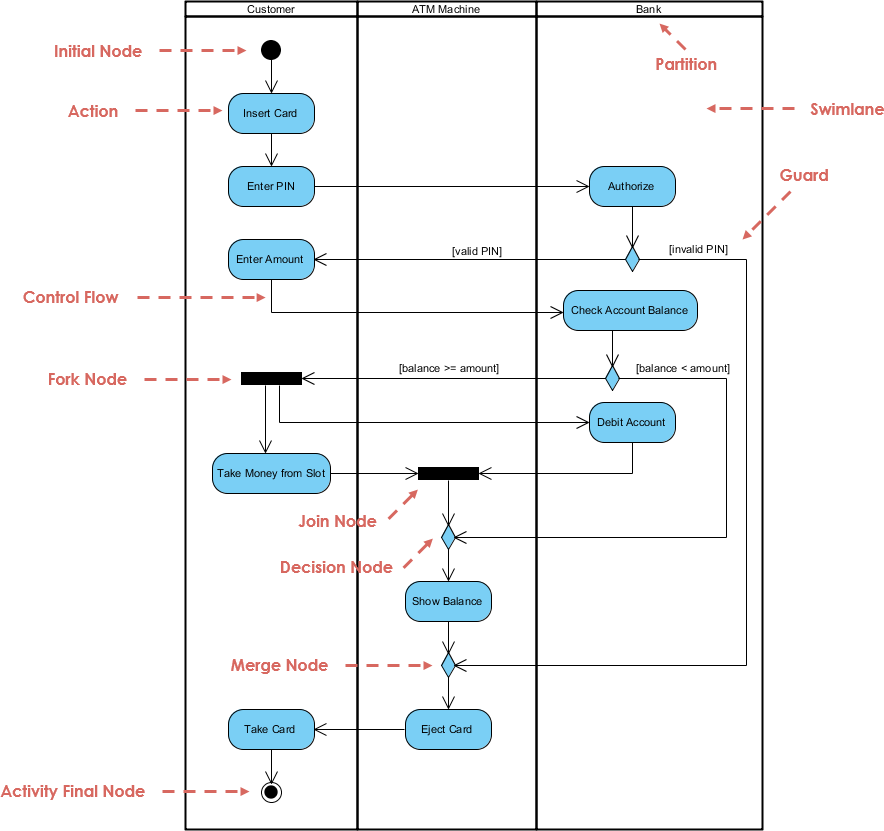
- Swimlane: A way to group activities performed by the same actor on an Activity Diagram or to group activities in a single thread.
- Partition: Similar to a swimlane, it groups activities performed by the same actor or in the same thread.
Creating an Activity Diagram
Step-by-Step Guide
- Identify the Process: Determine the process or workflow you want to model.
- Define Activities: List all the activities involved in the process.
- Sequence the Activities: Arrange the activities in the order they occur.
- Add Control Flows: Connect the activities with control flows to show the sequence.
- Add Decision Nodes: Include decision nodes where necessary to show alternative paths.
- Add Fork and Join Nodes: Use fork nodes to show parallel activities and join nodes to bring them back together.
- Use Swimlanes: Group activities performed by the same actor or in the same thread using swimlanes.
Example: Processing an Order
Let’s create an Activity Diagram for processing an order:

- Initial Node: Start the process.
- Receive Order: The first activity.
- Decision Node: Check if the order needs expedited processing.
- Expedited Processing: If yes, proceed to expedited processing activities.
- Regular Processing: If no, proceed to regular processing activities.
- Fork Node: Split into parallel activities for filling the order and handling billing.
- Fill Order: Activities include picking items, packing, and shipping.
- Handle Billing: Activities include generating an invoice and processing payment.
- Join Node: Combine the parallel activities.
- Close Order: The final activity.
- Activity Final Node: End the process.
Examples of Activity Diagrams
Basic Activity Diagram
A simple flowchart-like diagram showing pre-conditions, actor input, system steps, basic flow, alternative flow, returning alternative flow, parallel activities, and post-conditions.
Modeling a Word Processor
An Activity Diagram describing the workflow for creating a document using a word processor, including steps for opening the package, creating a file, saving the file, typing the document, adding graphics or spreadsheets, printing, and exiting.
Process Order
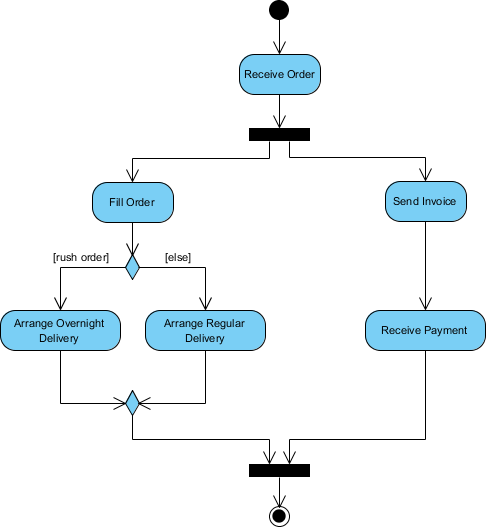
An Activity Diagram visualizing the workflow for processing an order, including parallel activities for filling the order and handling billing, with conditional delivery methods.
Student Enrollment
An Activity Diagram describing the process for student enrollment in a university, including steps for submitting forms, inspecting forms, attending presentations, enrolling in seminars, and paying tuition.
Swimlane Activity Diagram
An Activity Diagram using swimlanes to group activities performed by different actors, such as in the process of staff expenses submission.

Tools for Creating Activity Diagrams
Several tools can help you create Activity Diagrams, such as:
- Visual Paradigm: An award-winning UML modeler that supports all UML diagram types, including Activity Diagrams.
- Microsoft Visio: A diagramming and vector graphics application that supports UML diagrams.
Visual Paradigm is indeed an excellent tool for system modeling using UML (Unified Modeling Language). Here are some reasons why it is highly recommended:
Key Features of Visual Paradigm
- Comprehensive UML Support:
- Visual Paradigm supports all types of UML diagrams, including Activity Diagrams, Use Case Diagrams, Class Diagrams, Sequence Diagrams, and more. This makes it a versatile tool for modeling various aspects of a system.
- User-Friendly Interface:
- The tool is designed to be easy to use, with an intuitive interface that allows users to create diagrams quickly and efficiently. This is particularly beneficial for beginners who are new to UML.
- Collaboration Tools:
- Visual Paradigm offers collaboration features that allow multiple users to work on the same project simultaneously. This is essential for team projects where coordination and communication are crucial.
- Integration with Other Tools:
- The software integrates well with other development tools and platforms, making it easier to incorporate UML models into the broader development process.
- Advanced Modeling Capabilities:
- Visual Paradigm provides advanced modeling capabilities, including support for swimlanes, decision nodes, fork and join nodes, and more. These features help in creating detailed and complex Activity Diagrams.
- Customization and Flexibility:
- Users can customize diagrams to fit their specific needs. The tool offers a range of customization options, allowing users to tailor diagrams to their project requirements.
- Documentation and Reporting:
- Visual Paradigm includes robust documentation and reporting features. Users can generate detailed reports and documentation directly from their UML models, which is useful for project management and stakeholder communication.
- Free Community Edition:
- Visual Paradigm offers a free Community Edition, which is ideal for students, educators, and small projects. This edition includes many of the core features, making it accessible to a wide range of users.
How to Get Started with Visual Paradigm
- Download and Install:
- Visit the Visual Paradigm website and download the Community Edition or the version that suits your needs. Follow the installation instructions to set up the software on your computer.
- Learn the Basics:
- Familiarize yourself with the interface and basic features. Visual Paradigm provides tutorials and documentation to help new users get started.
- Create Your First Diagram:
- Start by creating a simple UML diagram, such as an Activity Diagram. Use the drag-and-drop interface to add activities, control flows, decision nodes, and other elements.
- Explore Advanced Features:
- As you become more comfortable with the tool, explore its advanced features, such as swimlanes, collaboration tools, and integration options.
- Collaborate and Share:
- If you are working on a team project, use the collaboration features to work with others. Share your diagrams and models with team members and stakeholders to ensure everyone is on the same page.
Conclusion
Activity Diagrams are powerful tools for modeling the dynamic aspects of a system. By understanding their components and how to create them, you can effectively use Activity Diagrams to visualize and communicate complex workflows. Whether you are identifying use cases, modeling workflows, or detailing complex activities, Activity Diagrams provide a clear and concise way to represent the sequence of activities in a system.
Visual Paradigm is a powerful and versatile tool for system modeling using UML. Its comprehensive support for UML diagrams, user-friendly interface, collaboration features, and advanced modeling capabilities make it an ideal choice for both beginners and experienced users. Whether you are working on a small project or a large-scale system, Visual Paradigm provides the tools you need to create detailed and effective UML models.
UML References
UML (Unified Modeling Language)
- Wikipedia – Unified Modeling Language
- UML was adopted as a standard by the Object Management Group (OMG) in 1997 and has been managed by this organization ever since. In 2005, UML was also published by the International Organization for Standardization (ISO) and the International Electrotechnical Commission (IEC) as the ISO/IEC 19501 standard1.
- GeeksforGeeks – Unified Modeling Language (UML) Diagrams
- UML is a standardized visual modeling language used to represent and communicate complex system designs, facilitating collaboration among stakeholders in software development2.
- Visual Paradigm – What is Unified Modeling Language (UML)?
- UML is a standardized modeling language consisting of an integrated set of diagrams, developed to help system and software developers for specifying, visualizing, constructing, and documenting the artifacts of software systems, as well as for business modeling and other non-software systems3.
- UML.org – Welcome To UML Web Site!
- UML is OMG’s most-used specification, and the way the world models not only application structure, behavior, and architecture, but also business process and data structure4.
-
Activity Diagram
- Visual Paradigm – What is Activity Diagram?
- Activity Diagrams describe how activities are coordinated to provide a service which can be at different levels of abstraction. They are an important behavioral diagram in UML used to describe dynamic aspects of the system6.
- GeeksforGeeks – Activity Diagrams – Unified Modeling Language (UML)
- Activity diagrams show the steps involved in how a system works, helping us understand the flow of control. They display the order in which activities happen and whether they occur one after the other (sequential) or at the same time (concurrent)7.
-
- Wikipedia – Activity diagram
- Activity diagrams are graphical representations of workflows of stepwise activities and actions with support for choice, iteration, and concurrency. In the Unified Modeling Language, activity diagrams are intended to model both computational and organizational processes (i.e., workflows), as well as the data flows intersecting with the related activities9.
- Microsoft Support – Create a UML activity diagram
- A UML activity diagram in Visio looks like a flow chart. The flow of control is triggered by the completion of actions (or activities) within the system10.
Visual Paradigm Tool
- Visual Paradigm – Homepage
- Visual Paradigm features a rich set of Agile and Scrum tools for project management. It is used by over 320,000 professionals and organizations, including small businesses, Fortune 500 companies, universities, and government sectors11.
- Wikipedia – Activity diagram
- Visual Paradigm – What is Activity Diagram?

