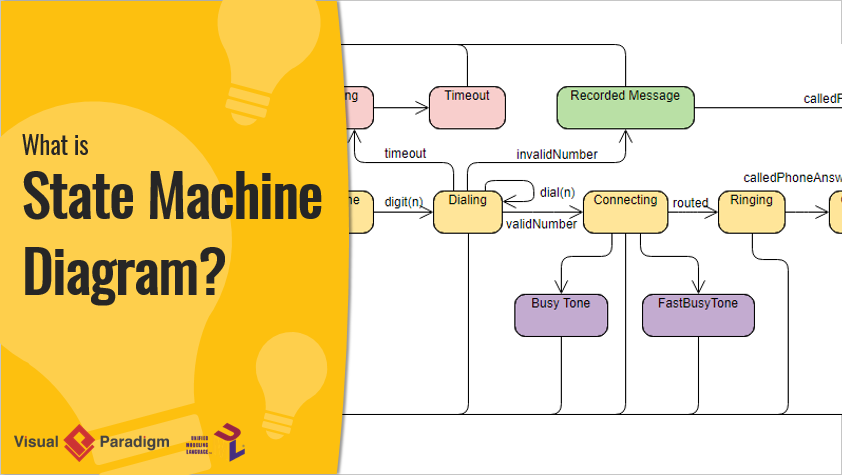
State Machine Diagrams are a crucial part of the Unified Modeling Language (UML), used to model the dynamic behavior of systems by illustrating the different states an object can be in and the transitions between those states. This tutorial will provide an in-depth look at State Machine Diagrams, their key components, and how to create them effectively. We will also introduce Visual Paradigm, one of the best software modeling tools for developers.

What is a State Machine Diagram?
A State Machine Diagram, also known as a Statechart or State Diagram, is a behavioral diagram in UML that shows the different states of an object and the transitions between those states in response to events. It is particularly useful for modeling the lifecycle of an object, from its creation to its termination.
Key Components of a State Machine Diagram
1. States
States represent the conditions or situations in which an object can exist. Each state can have entry actions, exit actions, and actions that occur while the object is in that state.
2. Transitions
Transitions are the paths between states, indicating a change in state due to an event. Transitions can have guards (conditions) and actions associated with them.
3. Events
Events are occurrences that trigger transitions between states. They can be external (e.g., user input) or internal (e.g., a timer expiring).
4. Actions
Actions are operations performed during a transition or within a state. They can be entry actions (performed when entering a state), exit actions (performed when exiting a state), or actions in state (performed while in a state).
5. Initial and Final States
The initial state is the starting point of the state machine, represented by a solid circle. The final state is the end point, represented by a solid circle with a surrounding circle.
6. Decision Nodes
Decision nodes (diamonds) represent points where the flow can branch based on certain conditions.
Creating a State Machine Diagram
Step-by-Step Guide
- Identify the States: Determine the different states your object can be in. For example, in a simple login system, states might include “Idle,” “Waiting for Input,” “Authenticating,” and “Logged In.”
- Define Transitions: Identify the events that cause transitions between states. For example, entering a username and password might trigger a transition from “Waiting for Input” to “Authenticating.”
- Add Actions and Guards: Specify any actions that occur during transitions or within states. Add guards to transitions to define conditions that must be met for the transition to occur.
- Draw the Diagram: Use a UML tool to draw the State Machine Diagram. Start with the initial state and add states, transitions, actions, and guards as needed.
Example Diagram
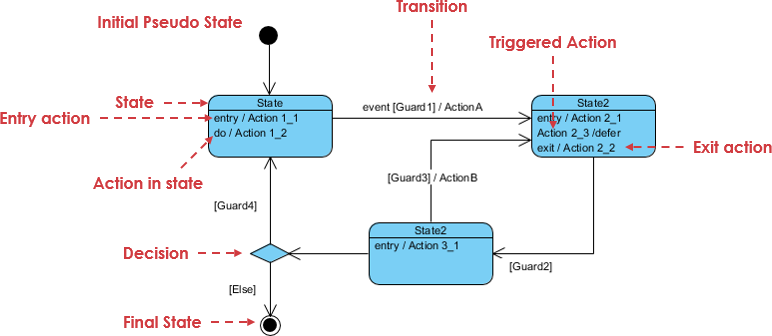
Let’s break down the provided example diagram:

- Initial Pseudo State: The diagram starts with an initial pseudo state, represented by a solid circle.
- State1: The first state is “State1,” with entry actions (Action 1_1) and actions in state (Action 1_2).
- Transition: The transition from “State1” to “State2” is triggered by the event [Guard1] and performs ActionA.
- State2: The second state is “State2,” with entry actions (Action 2_1), actions in state (Action 2_3), and exit actions (Action 2_2).
- Decision Node: A decision node branches the flow based on guards [Guard3] and [Guard2], leading to different actions (ActionB and Action 3_1).
- Final State: The diagram ends with a final state, represented by a solid circle with a surrounding circle.
Best Practices for State Machine Diagrams
- Keep It Simple: Avoid overcomplicating the diagram. Focus on the essential states and transitions.
- Use Descriptive Names: Name states and events clearly to make the diagram easy to understand.
- Document Actions and Guards: Clearly document any actions and guards associated with transitions to ensure the diagram is self-explanatory.
- Review and Iterate: Regularly review and update the diagram as the system evolves.
Introducing Visual Paradigm for UML
Visual Paradigm is a leading software modeling tool that supports a wide range of UML diagrams, including State Machine Diagrams. It offers an intuitive interface, powerful features, and extensive documentation, making it an ideal choice for software developers.
Key Features of Visual Paradigm
- User-Friendly Interface: Easy-to-use drag-and-drop interface for creating and editing diagrams.
- Comprehensive UML Support: Supports all types of UML diagrams, including Class Diagrams, Sequence Diagrams, and Use Case Diagrams.
- Collaboration Tools: Allows multiple users to work on the same project simultaneously, with version control and collaboration features.
- Integration: Integrates with popular development tools and platforms, such as Eclipse, Visual Studio, and Git.
- Extensive Documentation: Provides detailed documentation, tutorials, and examples to help users get started quickly.
Getting Started with Visual Paradigm
- Download and Install: Visit the Visual Paradigm website to download and install the software.
- Create a New Project: Open Visual Paradigm and create a new project for your UML diagrams.
- Draw Your Diagram: Use the State Machine Diagram tool to start drawing your diagram. Drag and drop states, transitions, and other elements onto the canvas.
- Customize and Document: Customize the diagram by adding actions, guards, and other details. Use the documentation features to add notes and descriptions.
- Collaborate and Share: Share your diagram with team members and collaborate in real-time. Export the diagram in various formats for presentations and documentation.
Conclusion
State Machine Diagrams are a powerful tool for modeling the dynamic behavior of systems. By understanding the key components and best practices, you can create effective diagrams that help in designing and documenting complex systems. Visual Paradigm for UML is an excellent choice for software developers, offering a comprehensive set of features and an intuitive interface for creating and managing UML diagrams.
Start your journey with State Machine Diagrams and Visual Paradigm today, and elevate your software modeling capabilities to the next level.

