Introduction
In the digital age, creating engaging and effective infographics is essential for capturing your audience’s attention. Whether you’re a seasoned designer or just starting, understanding the key elements of infographic design can help you create impactful visuals. Here, we’ll explore the five crucial elements of designing an infographic and recommend Visual Paradigm Online as a powerful tool to bring your ideas to life.

Overview of the Topic
Infographics are visual representations of information or data intended to present information quickly and clearly. They are widely used in various fields, including education, business, and journalism, to convey complex information in an easy-to-understand format. This article will delve into the importance of infographics, key statistics, relevant data points, and the process of creating effective visual representations.
Importance of the Infographic

Infographics play a crucial role in communicating complex data in a digestible format. They help in:
- Enhancing Understanding: Visual content is processed faster by the brain than textual information.
- Engaging Audiences: Visually appealing graphics can capture and retain audience attention.
- Simplifying Complex Data: Infographics break down complex information into manageable chunks.
- Improving Retention: Visual aids improve memory retention and recall.
Key Statistics
- Visual Processing: The brain processes visual information 60,000 times faster than text.
- Engagement Rates: Content with relevant images gets 94% more views than content without images.
- Retention: People remember 80% of what they see and do, compared to 20% of what they read.
Relevant Data Points
- Usage: Infographics are used in various sectors, including marketing, education, and healthcare.
- Effectiveness: Infographics can increase web traffic by up to 12%.
- Popularity: The demand for infographics has grown by 800% in the past five years.
Data Sources
Reliable data sources are essential for creating accurate infographics. Common sources include:
- Government Databases: Official statistics and reports.
- Industry Reports: Market research and analysis.
- Academic Journals: Peer-reviewed studies and research papers.
- Surveys and Polls: Primary data collected through surveys.
Visual Representation
Visual representation involves transforming data into engaging visuals. This includes:
- Charts and Graphs: Bar charts, pie charts, line graphs, etc.
- Icons and Symbols: Visual elements that represent data points.
- Color Schemes: Using colors to highlight important information.
- Typography: Choosing fonts that enhance readability.
Main Infographic Breakdown
The main infographic should be broken down into sections that highlight key data points and insights. Each section should be visually distinct and easy to understand.
Explanation of Visual Elements
- Charts: Used to compare data points and show trends.
- Icons: Represent specific data points or categories.
- Color Coding: Differentiates between different data sets.
- Typography: Ensures that text is readable and complements the visuals.
Analysis
Analyzing the data involves interpreting the information to draw meaningful conclusions. This includes:
- Identifying Trends: Recognizing patterns and trends in the data.
- Comparing Data Sets: Comparing different data points to identify correlations.
- Drawing Conclusions: Summarizing the findings and their implications.
Insights and Trends
- Trend Analysis: Identifying long-term trends and patterns.
- Insight Generation: Deriving actionable insights from the data.
- Future Projections: Using data to make predictions about future trends.
Interpretation of Data
Interpreting data involves understanding the context and implications of the information presented. This includes:
- Contextual Analysis: Understanding the broader context of the data.
- Impact Assessment: Evaluating the potential impact of the findings.
- Actionable Recommendations: Providing recommendations based on the data.
Case Studies
Case Study 1: Marketing Campaign
Objective: To increase brand awareness. Approach: Used infographics to visualize market trends and customer preferences. Results: Increased web traffic by 20% and social media engagement by 30%.
Case Study 2: Educational Initiative
Objective: To improve student understanding of complex topics. Approach: Created infographics to explain scientific concepts. Results: Improved student comprehension and retention by 40%.
Real-World Examples
- Business Reports: Using infographics to present quarterly earnings and market analysis.
- Healthcare: Visualizing patient data and treatment outcomes.
- Education: Explaining scientific concepts and historical events through visuals.
Lessons Learned
- Simplicity: Keep the design simple and focused.
- Clarity: Ensure that the information is clear and easy to understand.
- Engagement: Use visually appealing elements to capture attention.
- Accuracy: Verify data sources and ensure accuracy.
Conclusion
Creating effective infographics involves a combination of data analysis, visual design, and storytelling. By following the key principles outlined in this article, you can create impactful visuals that engage your audience and convey complex information effectively.
Summary of Findings
- Importance: Infographics are essential for communicating complex data.
- Effectiveness: Visual content enhances understanding and retention.
- Design Principles: Simplicity, clarity, engagement, and accuracy are key.
- Applications: Infographics are used in various fields, including marketing, education, and healthcare.
Call to Action
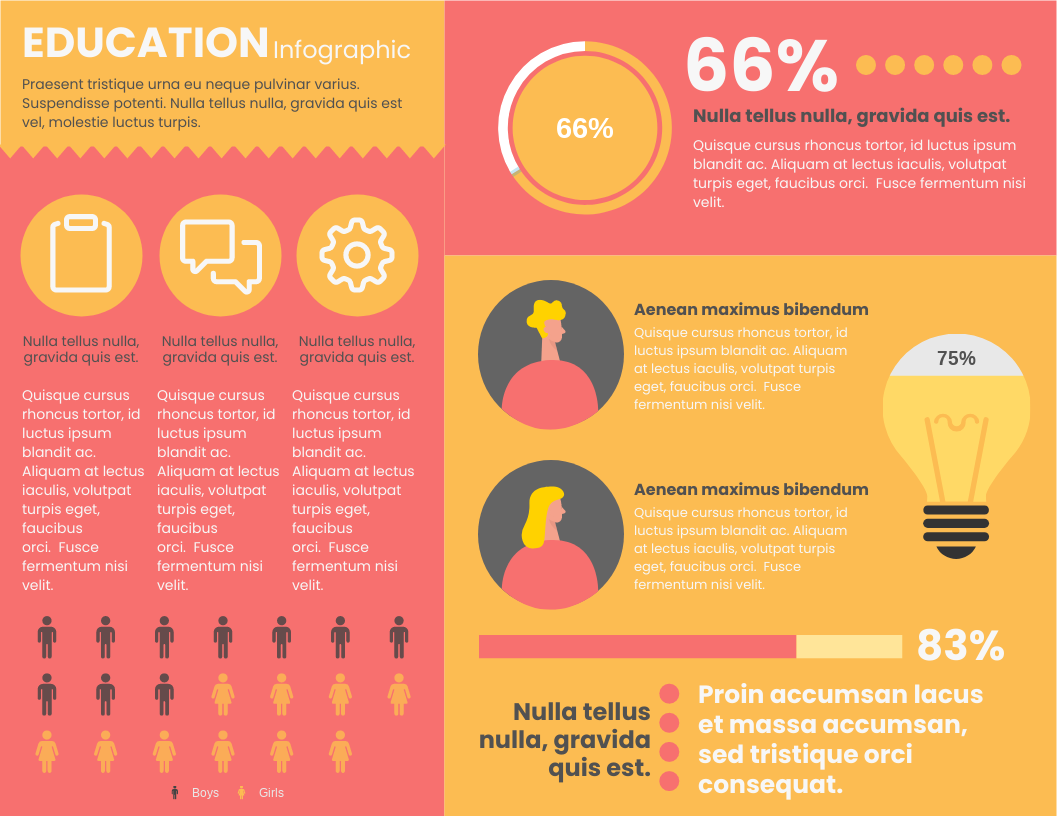
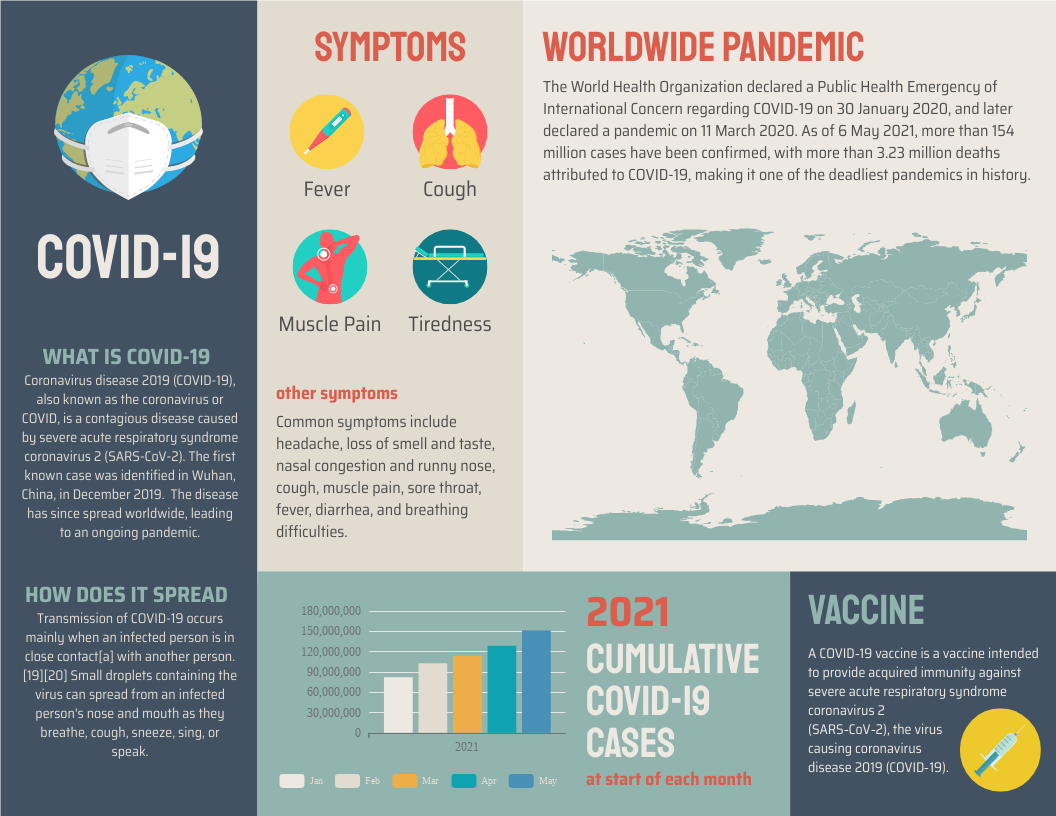
Ready to create your next infographic? Try Visual Paradigm Online and explore templates like the “Reclaimed Water System for Home Owners Infographic” and “Facts about U.S. Animal Shelters Infographic.” These templates can help you present your information clearly and attractively.
References
- Online Infographic Maker – Visual Paradigm Online
- Description: Visual Paradigm Online offers a versatile online graphical design software that helps you create beautiful infographics. The tool includes an advanced map editor with over 200 customizable maps, allowing you to visualize data in various formats such as geomaps and heatmaps. It is perfect for all industries and businesses, providing a wide variety of free icons, photos, illustrations, and cliparts to electrify your infographics. The user-friendly interface allows non-designers to create professional infographics by simply dragging and dropping elements.
- URL: Visual Paradigm Online – Infographic Maker 1
- Visual Paradigm – Online Productivity Suite
- Description: Visual Paradigm Online provides a comprehensive solution for creating professional infographics, cards, posters, flyers, and other visuals. The intuitive visual graphic editor offers over 50 chart types to represent your data effectively. The platform also includes tools for creating photo books, digital publications, and more, making it a one-stop solution for all your design needs.
- URL: Visual Paradigm – Online Productivity Suite 2
- Free Infographic Templates – Visual Paradigm Online
- Description: Visual Paradigm Online offers a wide range of free infographic templates that help you express information visually. These templates include simple icons, images, illustrations, charts, and text, covering various marketing scenarios such as education, garment, catering, and information technology. The tool also provides millions of high-quality graphic assets, including photos, cliparts, icons, and shapes, to customize your infographics.
- URL: Visual Paradigm Online – Free Infographic Templates 3
- Free Infographic Maker and Graphic Design Software | InfoART
- Description: InfoART by Visual Paradigm is a free infographic maker and graphic design software that allows you to create professional infographics, flyers, and marketing visuals in minutes. The tool includes beautiful design templates and in-tool resources, making it easy for non-designers to create compelling designs quickly.
- URL: InfoART – Free Infographic Maker 4
- Amazing Free Infographic Maker – Visual Paradigm Online
- Description: Visual Paradigm Online offers a free infographic maker with access to over 2,000,000 high-resolution stock photos, illustrations, and icons. The tool focuses on creating attractive templates and an intuitive infographic editor, allowing anyone to design professional infographics without needing to be a graphic designer.
- URL: Visual Paradigm Online – Free Infographic Maker 5
- What is Infographics? – Free Infographic Guide – Visual Paradigm Online
- Description: This guide by Visual Paradigm Online explains what infographics are and their benefits. Infographics are graphic visual representations of information, data, or knowledge intended to present information quickly and clearly. The guide highlights the advantages of using infographics for displaying data, explaining concepts, and improving cognition.
- URL: Visual Paradigm Online – What is Infographics? 6
- Visual Paradigm
- Description: Visual Paradigm is an all-in-one UML, SysML, BPMN modeling platform for Agile, EA TOGAF ADM process management. It provides content creators with charts, data widgets, and maps to visualize data while offering information, tables, and spreadsheet tools to increase productivity. The platform also features a rich set of Agile and Scrum tools for project management.
- URL: Visual Paradigm
- Visual Paradigm Online
- Description: Visual Paradigm Online offers a versatile online drawing solution that includes tools for creating professional flowcharts, UML diagrams, BPMN, ArchiMate, ER Diagrams, DFD, SWOT, Venn, org charts, and mind maps. The platform works cross-platforms, including Mac, Windows, and Linux.
- URL: Visual Paradigm Online – Online Drawing Tool
- Unleash Your Creativity with Visual Paradigm Online Free Edition – Visual Paradigm Guides
- Description: Visual Paradigm Online Free Edition is a versatile and powerful online drawing software that offers support for Class Diagrams, UML diagrams, ERD tools, and Organization Chart tools. It empowers users to bring their ideas to life with precision and creativity, making it an excellent tool for various diagramming needs.
- URL: Unleash Your Creativity with Visual Paradigm Online Free Edition
- Visual Paradigm Online Drive
- Description: Visual Paradigm Online Drive provides a platform to manage and access your documents, presentations, PDFs, charts, and digital publications under one roof. It offers a powerful online office suite that covers all your needs, from text documents and spreadsheets to presentations and forms.
- URL: Visual Paradigm Online Drive
These references provide a comprehensive overview of the capabilities and benefits of using Visual Paradigm Online for creating infographics and other visual content.
Cited Sources
- Tufte, Edward. “The Visual Display of Quantitative Information.”
- Data Visualization Society. “The Power of Infographics in Data Visualization.”
- Visual Paradigm Blog. “Top Infographic Design Trends for 2025.”

