Scatter Diagram Tutorial

آموزش نمودار پراکندگی

A Scatter Plot (also known as a scatter Chart, and Correlation Plot) is a tool for analyzing the relationship between two variables, used to determine the degree of correlation between two variables. One variable is plotted on the horizontal axis and the other on the vertical axis. The pattern of their intersection points graphically displays the relational pattern. It is one of the Seven Basic Tools of Quality.

Continue reading
Fault Tree Diagram Tutorial

آموزش نمودار درخت خطا

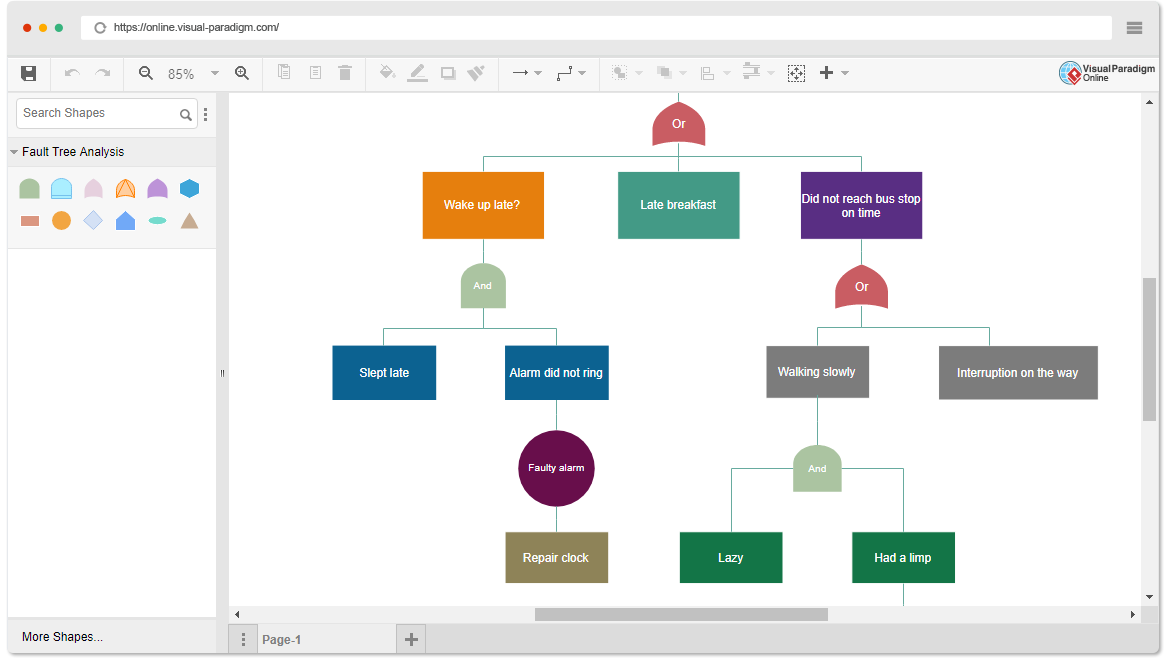
Fault tree analysis (FTA) is a top-down deductive fault analysis in which Boolean logic is used in conjunction with a series of low-level events to analyze the unexpected states of the system. This analysis method is primarily used in safety engineering and reliability engineering to understand how systems fail, determine the best way to reduce risk, and determine (or feel) the event rate of safety incidents or specific system-level (functional) failures.

Continue reading