Learn how to develop Quality and IV&V Plan. Describes how quality will be managed throughout the whole project management cycle.
Continue reading
یادگیری یک چیز جدید هر روز


Learn how to develop Quality and IV&V Plan. Describes how quality will be managed throughout the whole project management cycle.
Continue reading
In Phase B, C & D — Business, Information Technology Architecture TOGAF is developed based on the Architecture Vision.
Continue reading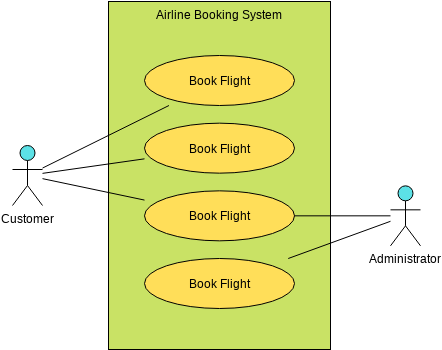
مدلسازی مورد استفاده ابزاری مفید برای ثبت نیازها است. این ابزار نمای گرافیکی از نیازهای یک سیستم نرمافزاری را ارائه
Continue reading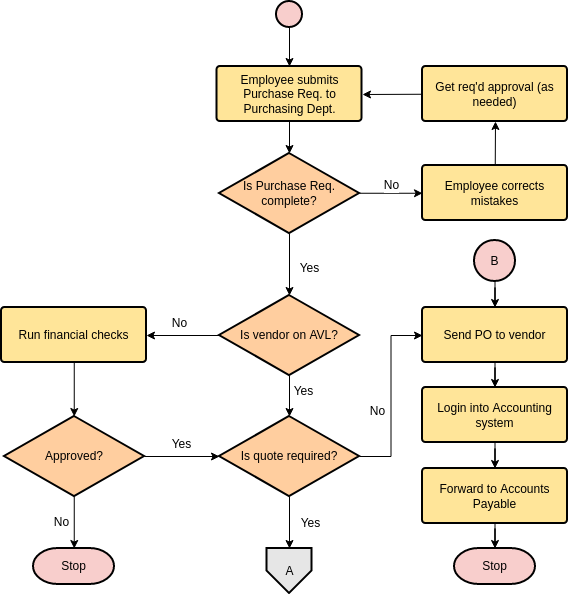
یک نمودار جریانابزاری است که به شما اجازه میدهد هر فرآیند را به فعالیتهای فردی تقسیم کنید و روابط منطقی
Continue reading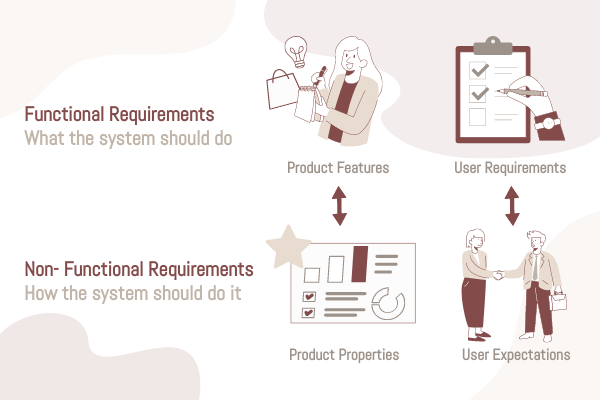
اولین قدم در تعریف یک محصول، خدمت، فرآیند یا سیستم جدید، تعریف الزامات است، یعنی الزامات عملکردی یا غیرعملکردی خاص.
Continue reading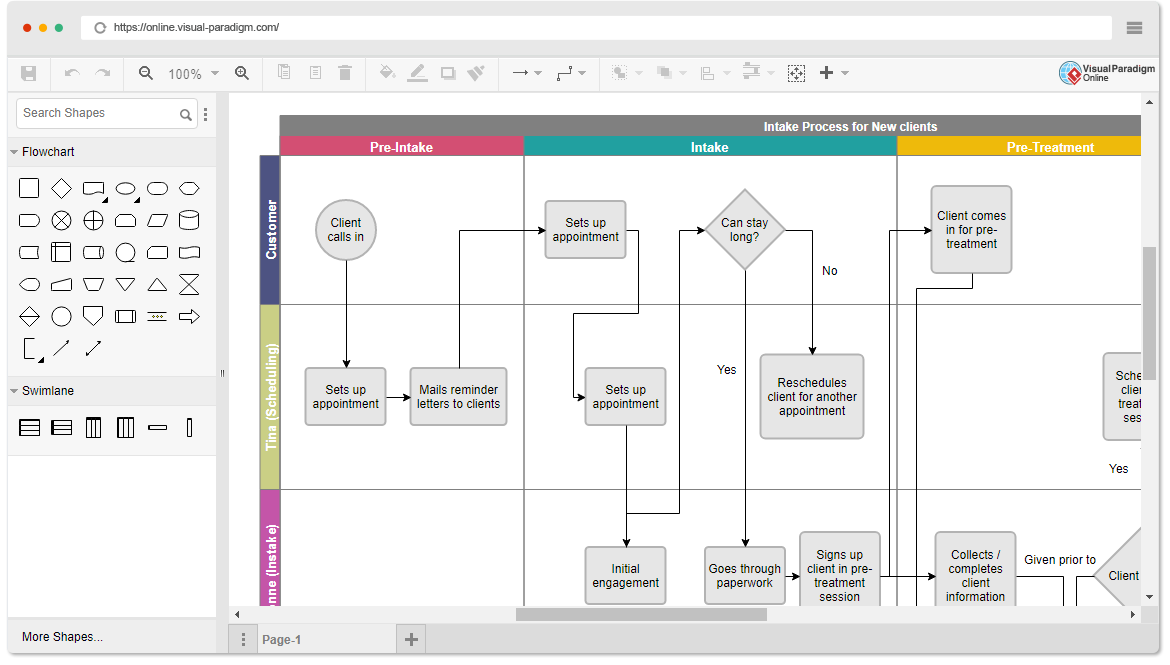
Cross-functional Flowcharts (or known as swimlane diagram, Swimlane flowchart, cross-functional process diagram) bring clarity to processes by defining who does what. Each swim lane is representative of a person, team, or stakeholder, making it evident who is responsible for which stage in the process to help avoid confusion.
Continue reading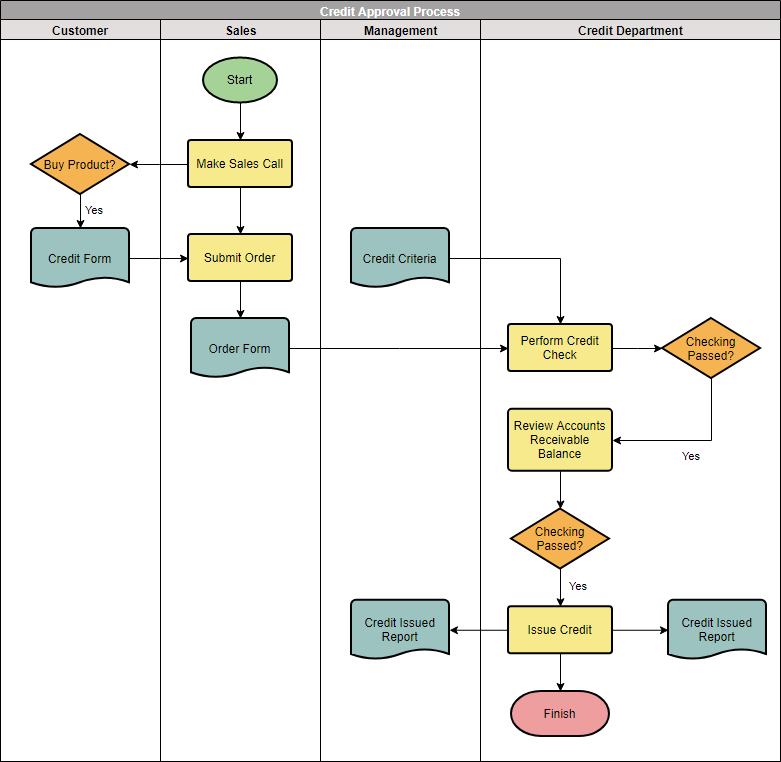
While the basic flowchart clearly illustrates the entire process, it does not clearly show which role is responsible for each step of the process. In order to effectively represent who is responsible for each process, it can be realized by swimlane flowchart, which not only reflects the whole activity control flow, but also clearly knows the responsibility that each role takes in the process.
Continue reading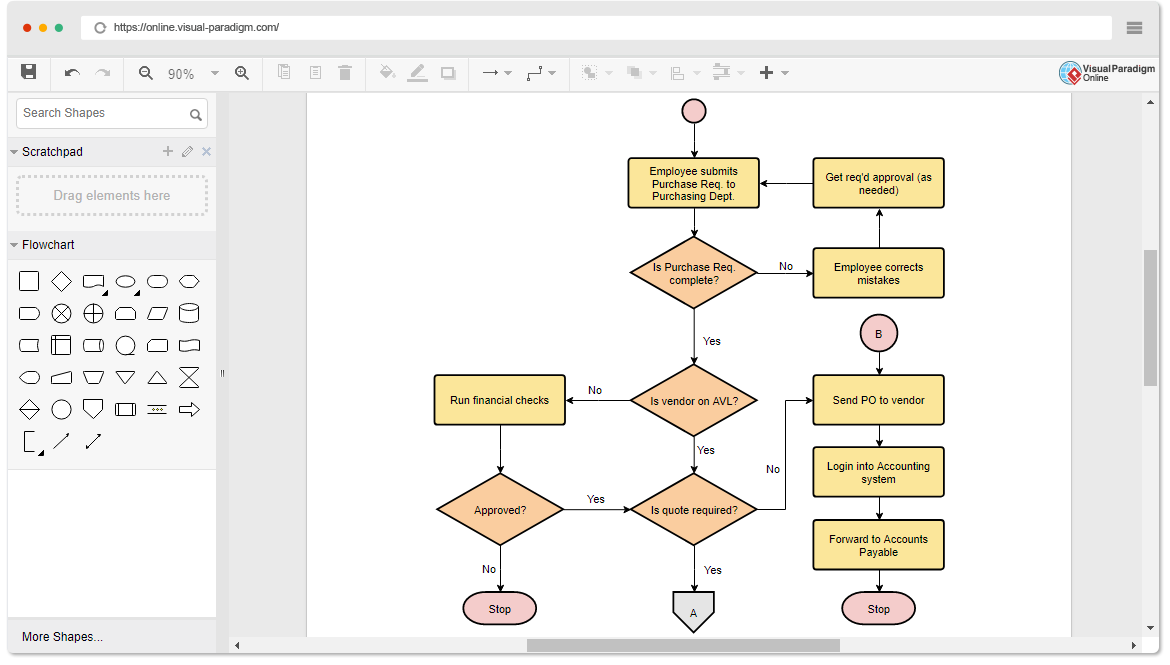
A flowchart is a graphical representation of the operations involved in a data processing system. operations in the system. Often, the best way to understand a problem is to draw a diagram. Diagrams usually give us a more complete picture of a situation than a short set of words or phrases. However, the combination of visual symbols )(shapes) and text provides a very powerful tool for communication and problem solving. Algorithms can be developed more quickly when a flowchart is created to represent them. Flowcharts are much easier to understand than algorithms.
Continue reading
UML use case diagrams are the primary form of system/software requirements for new software programs under development. The purpose of a use case diagram is to visualize what the system should do (what); at this stage, it does not consider how (how) to do it.
Continue reading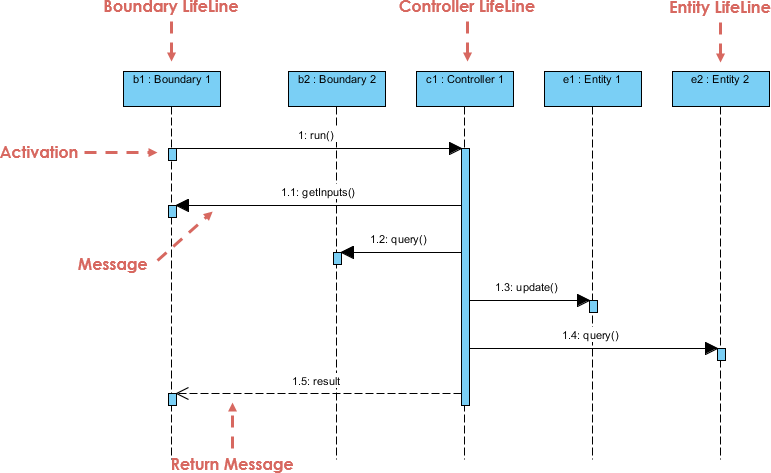
Model-View-Controller (MVC) is a basic design pattern that separates the user interface logic from the business logic. The Model-View-Controller (MVC) pattern is a way of dividing an application into three distinct components; the model, the view and the controller. This model-view-controller can be best described visually using robustness analysis in stereotyped UML notation, which was first proposed by Ivar Jacobson in his award-winning book Object-Oriented Software Engineering.
Continue reading