نقشهبرداری جریان ارزش چیست؟
نقشهبرداری جریان ارزشیک روش مدیریت ناب برای تحلیل وضعیت کنونی و طراحی وضعیت آینده برای مجموعهای از رویدادها است که یک محصول یا خدمت را از آغاز تا مشتری میبرد و در مقایسه با نقشه کنونی، ضایعات ناب را کاهش میدهد. به عبارت دیگر، یک جریان ارزش بر روی بخشهایی از یک شرکت تمرکز میکند که به یک محصول یا خدمت ارزش اضافه میکنند، در حالی که زنجیره ارزش به تمام فعالیتهای داخل یک شرکت اشاره دارد.
هدف این است که جریانهای مواد و اطلاعات را در تمام فرآیندهای ارزشافزا که برای تولید و ارسال محصول به مشتری لازم است، به تصویر بکشد. نقشههای جریان ارزش تمام فرآیندهای مورد استفاده برای تولید و ارسال یک محصول را مستند میکنند، همچنینارزشافزاوغیر ارزشافزافرآیندهای (ضایعات).
کاربردهای نقشهبرداری جریان ارزش
نقشهبرداری جریان ارزش دارای روشهای پشتیبانی است که معمولاً در محیطهای ناب برای تحلیل و طراحی جریانها در سطح سیستم (در چندین فرآیند) استفاده میشود.
اگرچه نقشهبرداری جریان ارزش معمولاً با تولید مرتبط است، اما در صنایع دیگر نیز استفاده میشود، مانند:
- لجستیک،
- زنجیره تأمین،
- صنایع مرتبط با خدمات،
- بهداشت و درمان،
- توسعه نرمافزار،
- توسعه محصول،
- فرآیندهای اداری و دفتری.
زمان ارزشافزا در مقابل زمان غیر ارزشافزا
بیشتر تولیدکنندگان سعی میکنند تمام هزینههای تولید غیرضروری و زمانهای هدر رفته را حذف کنند. این باعث میشود خطوط تولید آنها باریکتر شود و همچنین مشتریان را خوشحالتر کند. شرکتها میتوانند محصولات بهتری را با قیمت ارزانتر ارائه دهند اگر عملیات تولید را به طور روان و کارآمد اجرا کنند. یکی از راههایی که مدیران برای اندازهگیری کارایی خط تولید استفاده میکنند، نگاه کردن به زمان چرخه است.
زمان چرخه مقدار زمانی را که برای تولید یک محصول لازم است اندازهگیری میکند. زمان چرخه شامل زمان فرآیند، زمان بازرسی، زمان جابجایی و زمان انتظار است. تمام این فرآیندها بخشی از تولید یک محصول هستند. زمان بازرسی، زمان جابجایی و زمان انتظار به عنوان فرآیندهای زمان غیر ارزشافزا در نظر گرفته میشوند. بازرسی یک کامپیوتر برای عیبها یا جابجایی آن به بارانداز به بهبود کامپیوتر کمک نمیکند. به عبارت دیگر، این فرآیندها به محصول ارزش اضافه نمیکنند.
زمان ارزشافزا از فرآیندهایی تشکیل شده است که محصولات را بهبود میبخشند. تنها فرآیند زمان ارزشافزا در مثال زمان چرخه، زمان فرآیند است. این مقدار زمانی است که برای واقعاً تولید محصول لازم است. به وضوح، زمان تولید یک زمان ارزشافزا است زیرا محصولی از مواد اولیه ایجاد میکند. محصول در پایان زمان فرآیند بهبود مییابد.
بیشتر اوقات زمانی که یک فرآیند به عنوان یک فرآیند زمان ارزشافزا در نظر گرفته میشود، تنها از دیدگاه مشتری در نظر گرفته میشود. منظور من این است که مشتریان اهمیتی نمیدهند که آیا شرکت باید زمان صرف بستهبندی محصولات کند یا پولی برای ذخیرهسازی آنها خرج کند. هیچیک از این فرآیندها محصول را در نظر مشتری بهتر نمیکند.
مثال ویجت الکترونیکی
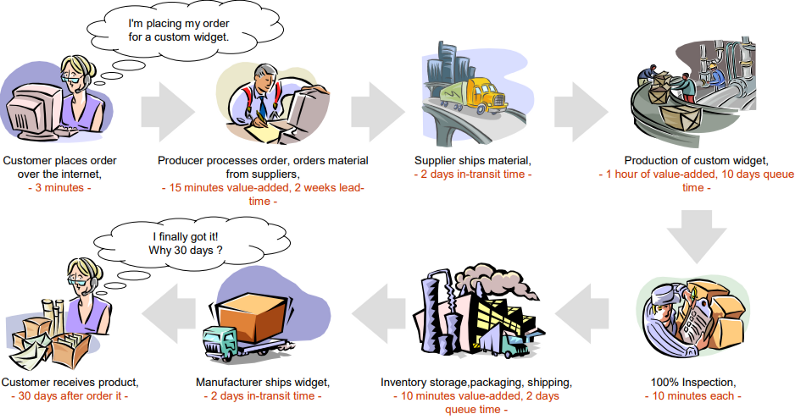
زمان ارزشافزا:
۳ دقیقه (ثبت سفارش) + ۱۵ دقیقه (پردازش سفارش) + ۱ ساعت (محصول ویجت) + ۱۰ دقیقه (بستهبندی) =۱ ساعت و ۲۵ دقیقه
زمان سپری شده از سفارش تا تحویل:۳۰ روز
نوع ضایعات
دانیل تی. جونز (۱۹۹۵) هفت نوع ضایعات معمولاً پذیرفته شده را شناسایی میکند. این اصطلاحات از نامگذاری اصلی سیستم تولید تویوتا (TPS) بهروز شدهاند:
- سرعت سریعتر از حد لازم: ایجاد بیش از حد یک کالا یا خدمت که به جریان تولید، کیفیت و بهرهوری آسیب میزند. قبلاً به عنوان تولید بیش از حد شناخته میشد و منجر به ضایعات ذخیرهسازی و زمان تحویل میشود.
- انتظار: هر زمان که کالاها در حال حمل و نقل یا کار بر روی آنها نیستند.
- جابجایی: فرآیند جابجایی کالاها. قبلاً به عنوان حمل و نقل شناخته میشد و شامل جابجایی دوگانه و حرکت بیش از حد است.
- پردازش: یک راهحل بیش از حد پیچیده برای یک رویه ساده. قبلاً به عنوان پردازش نامناسب شناخته میشد و شامل تولید ناامن است. این معمولاً منجر به چیدمان و ارتباط ضعیف و حرکت غیرضروری میشود.
- موجودی اضافی: فراوانی بیش از حد موجودی که منجر به زمانهای تحویل بیشتر، افزایش دشواری در شناسایی مشکلات و هزینههای ذخیرهسازی قابل توجه میشود. قبلاً به عنوان موجودی غیرضروری شناخته میشد.
- حرکت غیرضروری: ضایعات ارگونومیک که نیازمند استفاده از انرژی اضافی توسط کارکنان است، مانند بلند کردن اشیاء، خم شدن یا کشش. قبلاً به عنوان حرکات غیرضروری شناخته میشد و معمولاً قابل اجتناب است.
- اصلاح اشتباهات: هر هزینهای که با نقصها یا منابع لازم برای اصلاح آنها مرتبط است.
جستجوی ارزشنرمافزار نقشهبرداری جریان?
من یک ابزار خوب برای ایجاد نمودار (VSM) پیشنهاد میکنم.ویژوال پارادایم آنلایناین ابزار ایجاد نقشههای جریان ارزش را آسان و سریع میکند. ابزار نقشهبرداری جریان ارزش با مجموعهای غنی از نمادهای نقشهبرداری جریان ارزش همراه است. با ترکیب ویرایشگر کشیدن و رها کردن VSM و مجموعه ویژگیهای قدرتمند، میتوانید به راحتی نقشههای جریان ارزش حرفهای ایجاد کنید.
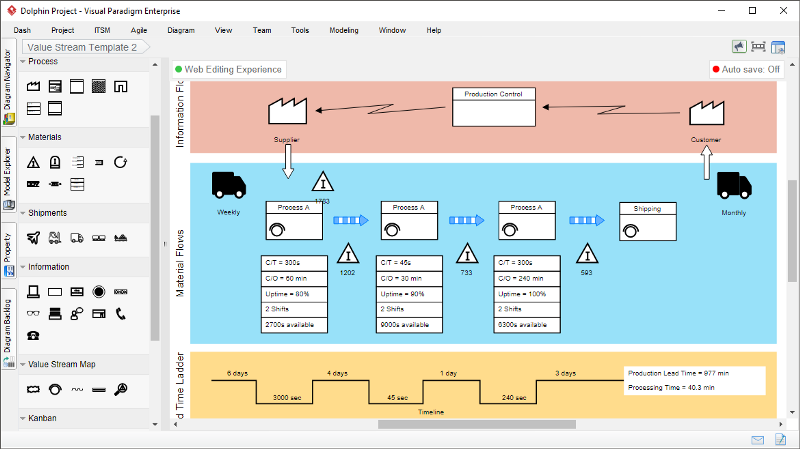
ویرایش ساده
- نقشهبرداری جریان ارزش را به راحتی با کشیدن و رها کردن و کلیکهای ماوس توسعه دهید. از راهنمای تراز برای قرار دادن دقیق اشکال هنگام کشیدن استفاده کنید.
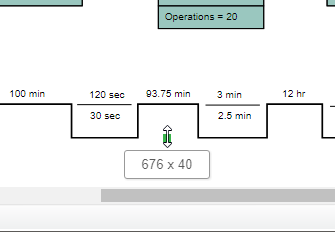
همکاری آسان
- اعضای تیم میتوانند به صورت مشترک و همزمان طراحی کنند. آنها حتی میتوانند بر روی یک نمودار ویرایش کنند بدون اینکه کار دیگران را خراب کنند.

فرمتهای خروجی متعدد
- نمودارهای خود را با همکاران و دوستان خود به اشتراک بگذارید و آنها را به تصاویر (PNG، JPG، SVG، GIF) یا PDF صادر کنید.
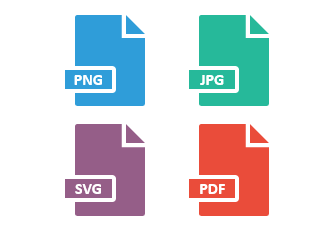
یکپارچگی با MS OFFICE
- به جای کپی و چسباندن تصاویر ثابت، نقشهبرداری جریان ارزش خود را در برنامههای MS جاسازی کنید. Word، PowerPoint، OneNote و Outlook پشتیبانی میشوند.
با اشکال خود طراحی کنید
- یک پالت شامل شابلونهای خود در فرمتهای تصویری (مانند SVG، JPG، PNG و غیره) ایجاد کنید و از آنها در طراحی خود استفاده کنید.
ایجاد نمودار نقشهبرداری جریان بصری
VP Online مجموعهای غنی از الگوهای نقشهبرداری جریان ارزش طراحی شده به صورت حرفهای را ارائه میدهد که شما را به سرعت بهرهور میکند. در زیر چند نمونه از آنها آمده است. بر روی یک الگو کلیک کنید تا آن را مشاهده کنید، یا بر روی ویرایش کلیک کنید تا شروع به ویرایش کنید – نیازی به ثبتنام قبلی نیست!
الگوهای بیشتری از نقشهبرداری جریان ارزش در ابزار نقشهبرداری جریان ارزش موجود است.
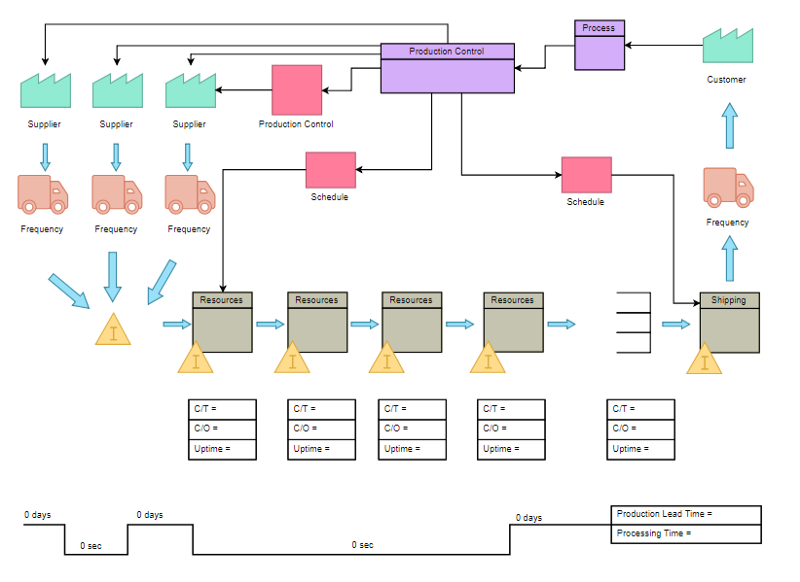
به سرعت کلیک کرده و VSM را ویرایش کنید
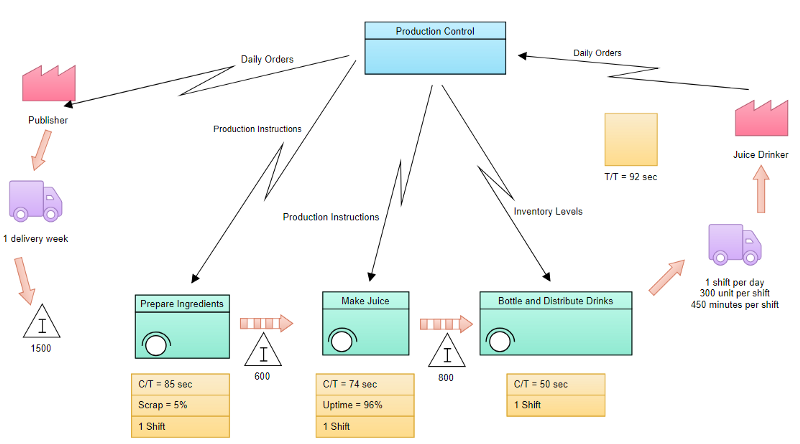
(به سرعت کلیک کرده و VSM را ویرایش کنید)
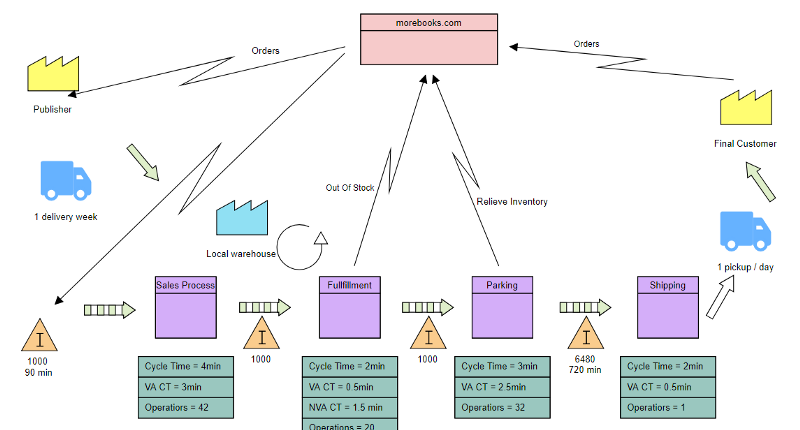
به سرعت کلیک کرده و VSM را ویرایش کنید
نمونههای بیشتری از نقشهبرداری جریان ارزش در گالری (به سرعت ویرایش و باز کنید)
This post is also available in Deutsch, English, Español, Français, Bahasa Indonesia, 日本語, Polski, Portuguese, Ру́сский, Việt Nam, 简体中文 and 繁體中文.


