The Best Easy Dashboard for BI 2019

بهترین داشبورد آسان برای BI 2019

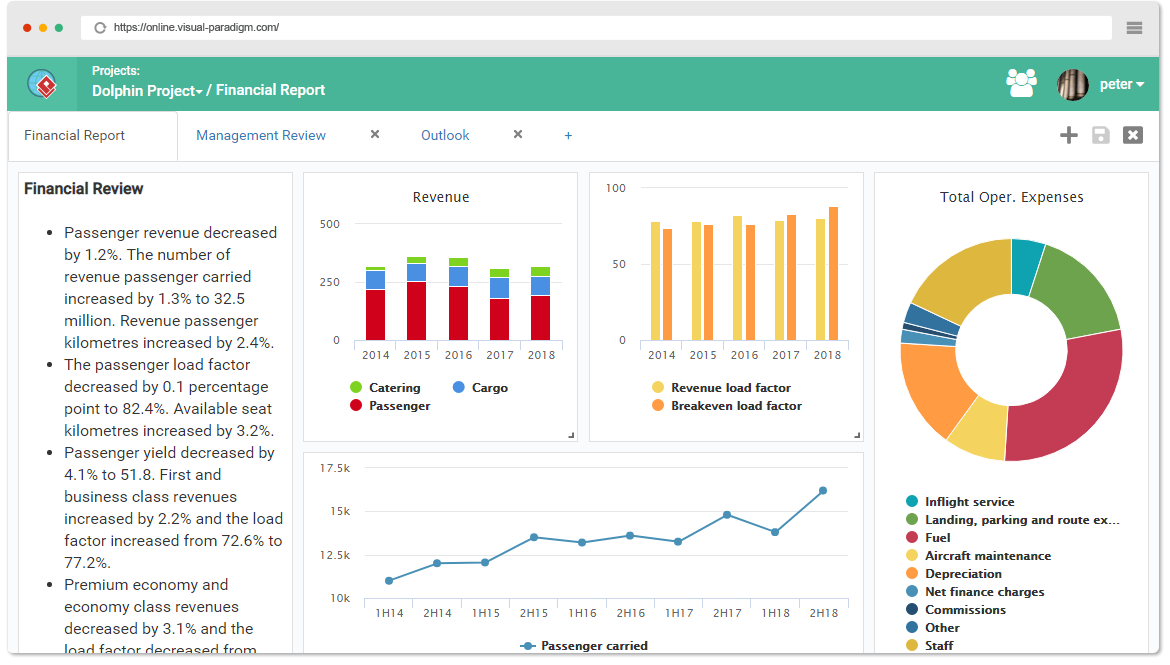
The latest update of Visual Paradigm Online features a powerful dashboard software, which is a highly configurable data visualization tool that help people see and understand their data easily. Visual Paradigm Online helps you visualize your data into valuable insights. Build dashboards and perform ad-hoc data analyses in just a few steps. A wide range of chart and graph are available to fulfill different business needs. Together with the intuitive spreadsheet editor, anyone can visualize data in few minutes. No coding, just insight.

Continue reading
The Best Easy Dashboard for BI 2019

اطلاعات بصری خود را در یک داشبورد رایگان و یکپارچه ایجاد و تجسم کنید

Visualization Paradigm online helps you visualize your data into valuable insights. You can build dashboards and perform AD hoc data analysis in just a few steps. A wide range of charts and graphs are available to meet different business needs. Coupled with an intuitive spreadsheet editor, anyone can visualize data in a matter of minutes. There is no coding, only insight.

Continue reading
Automated Tool — Do-it-Yourself Project Manager

ابزار خودکار – مدیر پروژه خودتان

Businesses, large and small, unquestionably juggle numerous projects, plans, tasks and people. The primary purpose of project management software is to help managers plan, execute and control all aspects of the project management process (such as PMBOK or PRINCE2). Visual Paradigm helps your team to kick-start any size of IT projects with automated guide-through process, with step-by-step instruction, input references and samples.

Continue reading
The Best Online Flowchart Software 2019

بهترین نرم‌افزار آنلاین فلوچارت ۲۰۱۹

The flowchart is only a graphical representation of the steps. It displays steps in a sequential manner and is widely used to display algorithm flow, workflow or process. It is a diagram that uses different symbols to represent a process. These symbols contain information about steps or sequence of events. Each symbol is connected with an arrow to indicate the process direction of the process.

Continue reading
Use Case — Learn By Examples

مورد استفاده – یادگیری از طریق مثال‌ها

A use case describes how a user uses a system to accomplish a specific goal. A use case diagram consists of a system, related use cases, and actors, and relates them to each other in order to visualize: what is being described? (the system), who is using the system? (actor) and what the actor wants to achieve? (use case), so that use cases help ensure that the right system is developed by capturing the requirements from the user’s perspective.

Continue reading
BPMN —Quick Guide

BPMN —راهنمای سریع

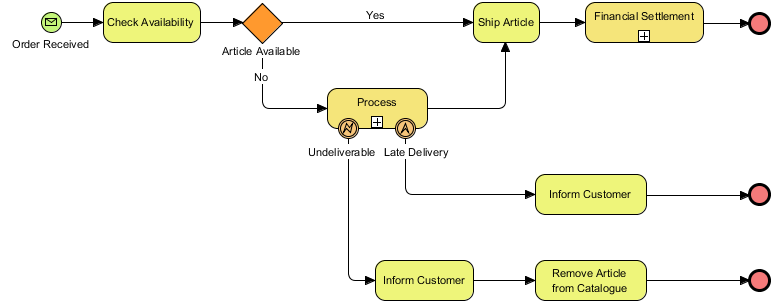
The Business Process Management Initiative (BPMI) has developed a standard Business Process Modeling Notation (BPMN). The BPMN 1.0 specification was released to the public in May 2004. The specification represents more than two years of work by the BPMI Notation Working Group. In February 2006, the OMG released a BPMN specification document. Version 2.0 of BPMN was developed in 2010 and the actual version of the specification was released in December 2013.

Continue reading