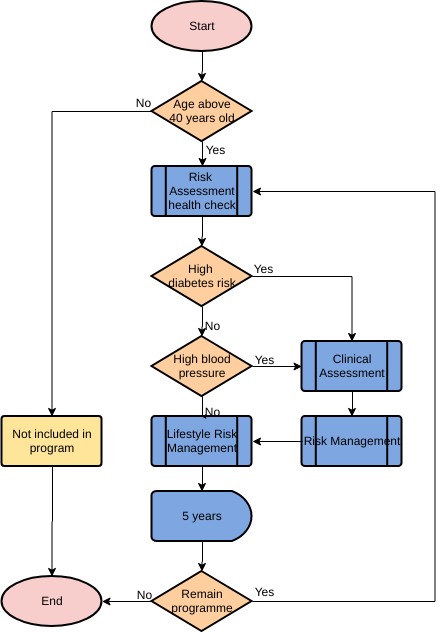
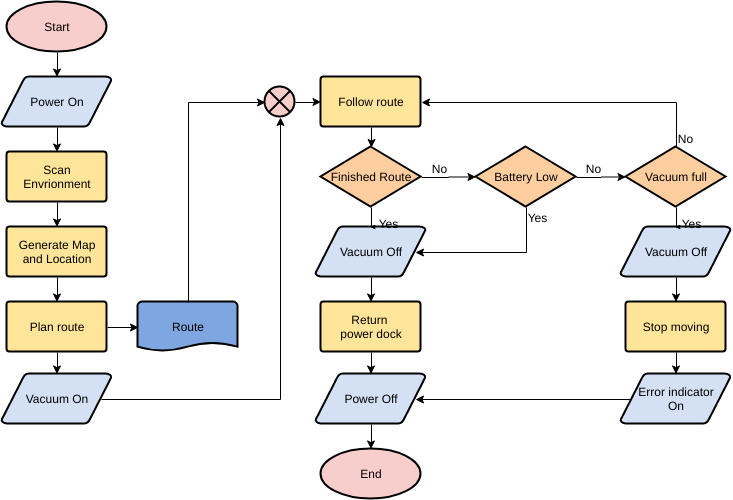
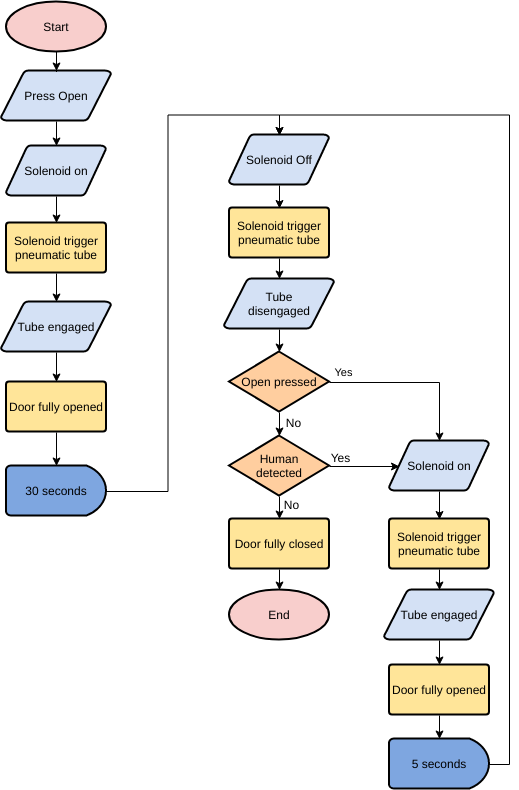
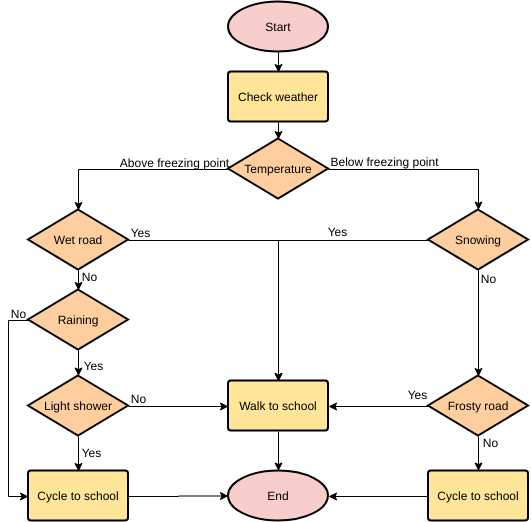
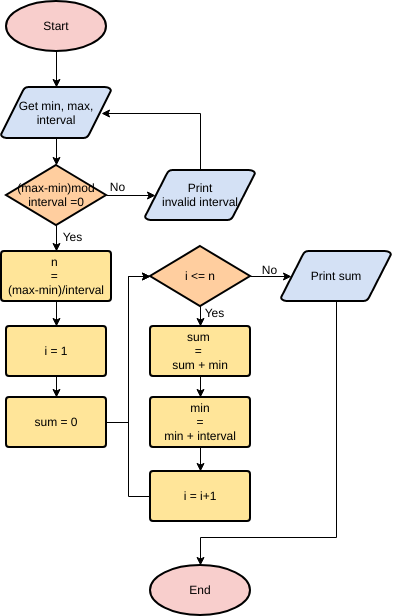
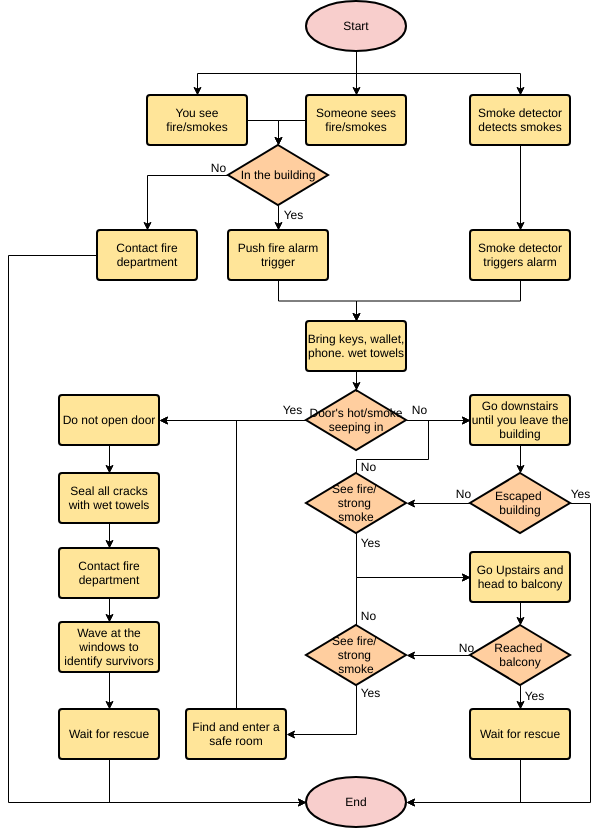
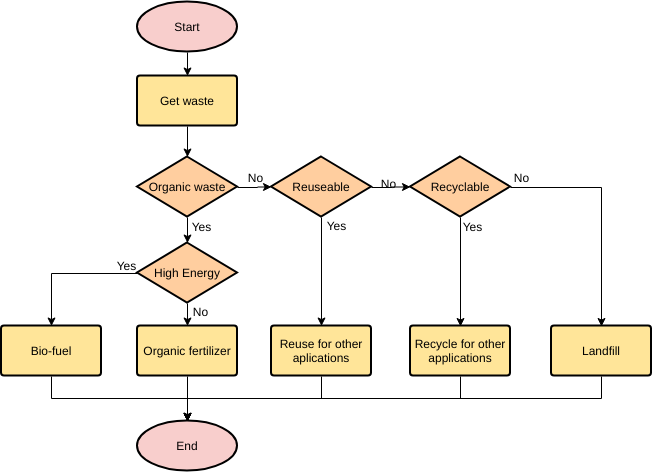
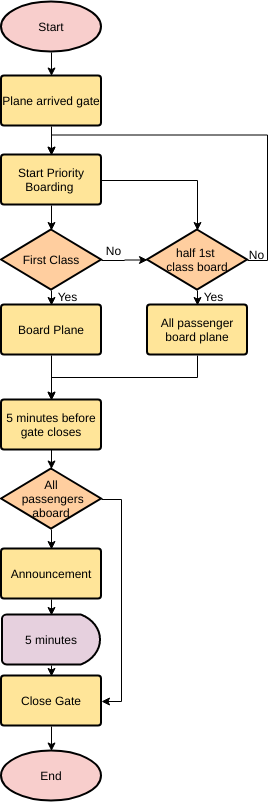
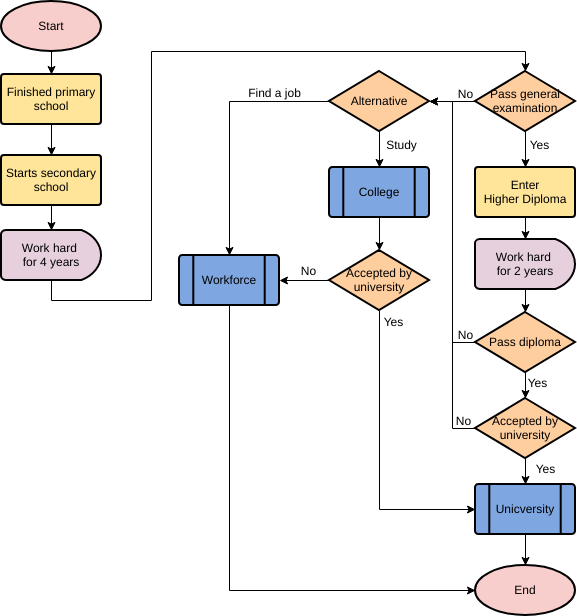
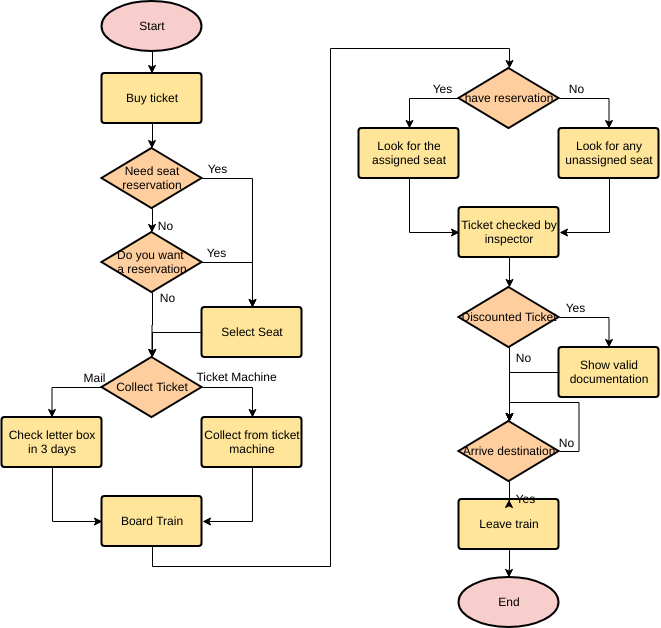
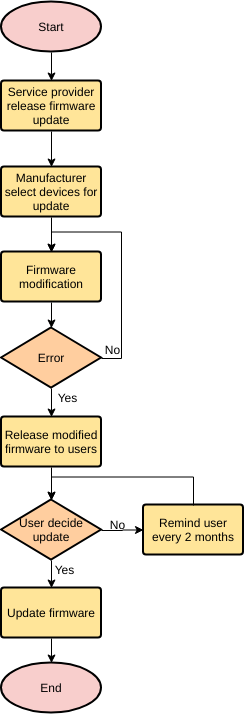
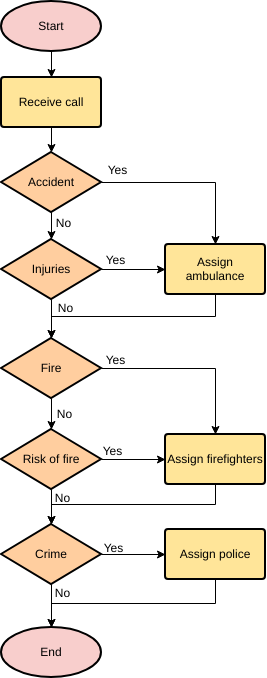
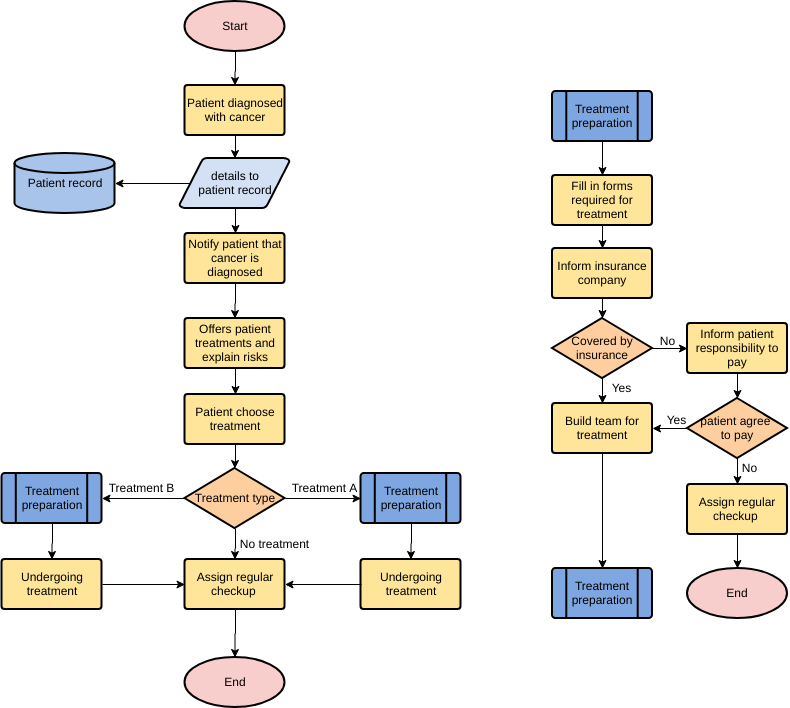
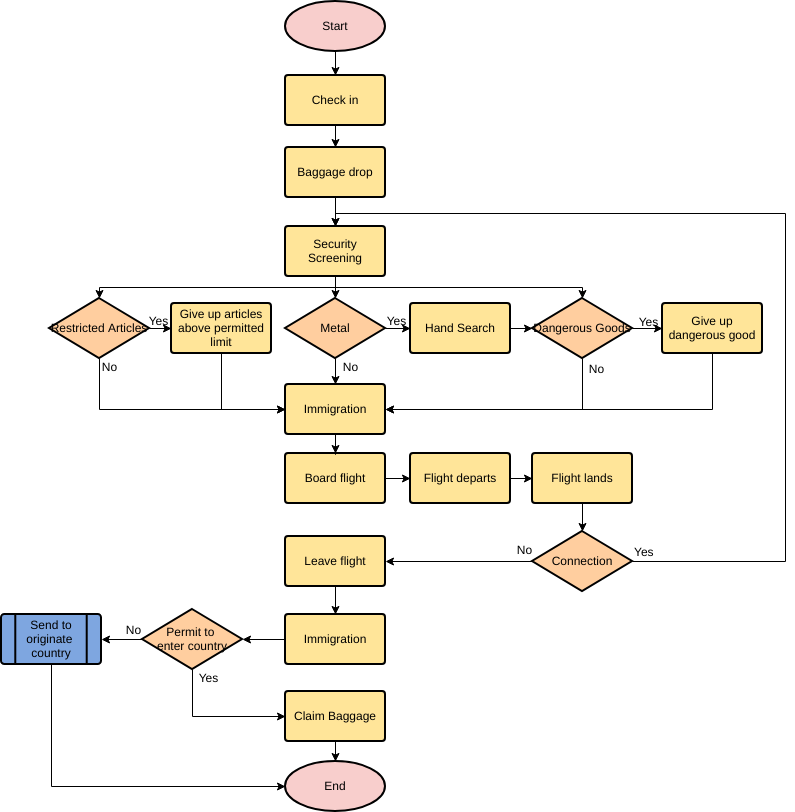
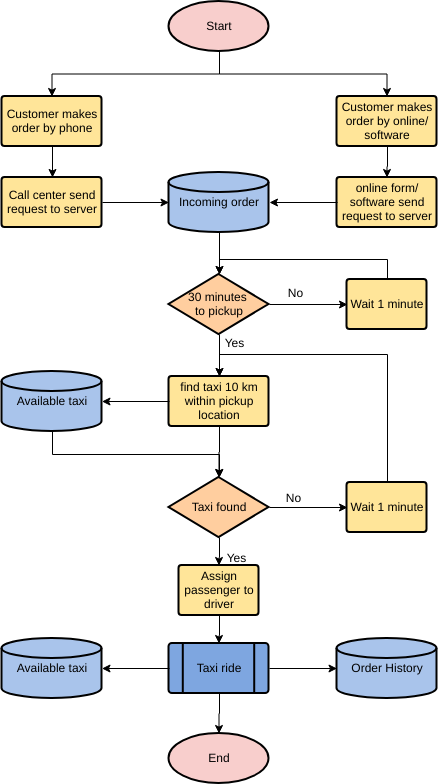
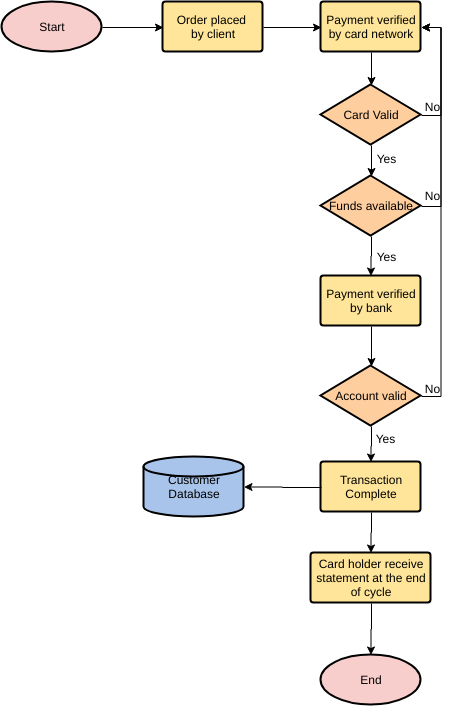
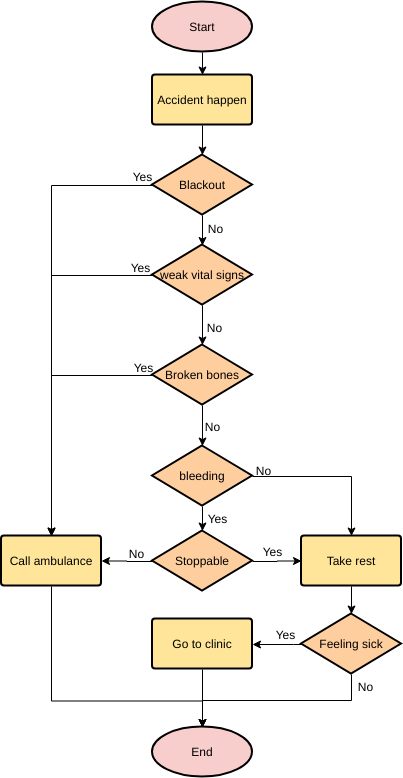
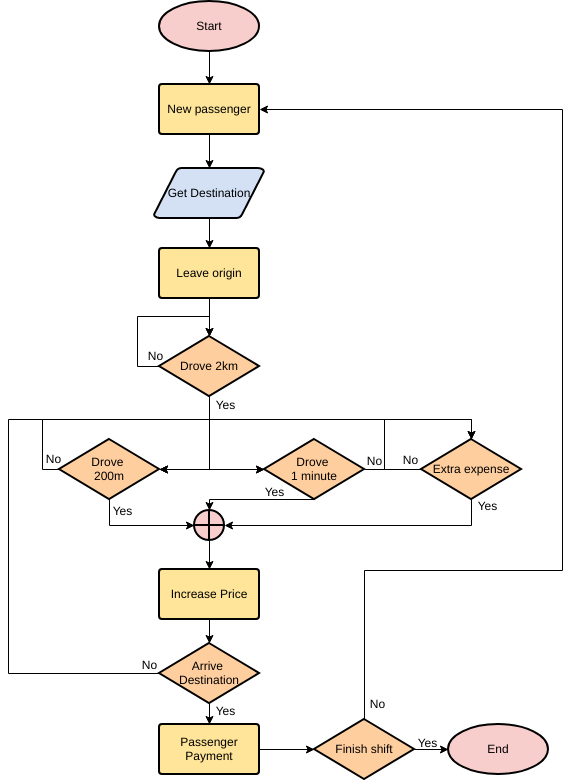
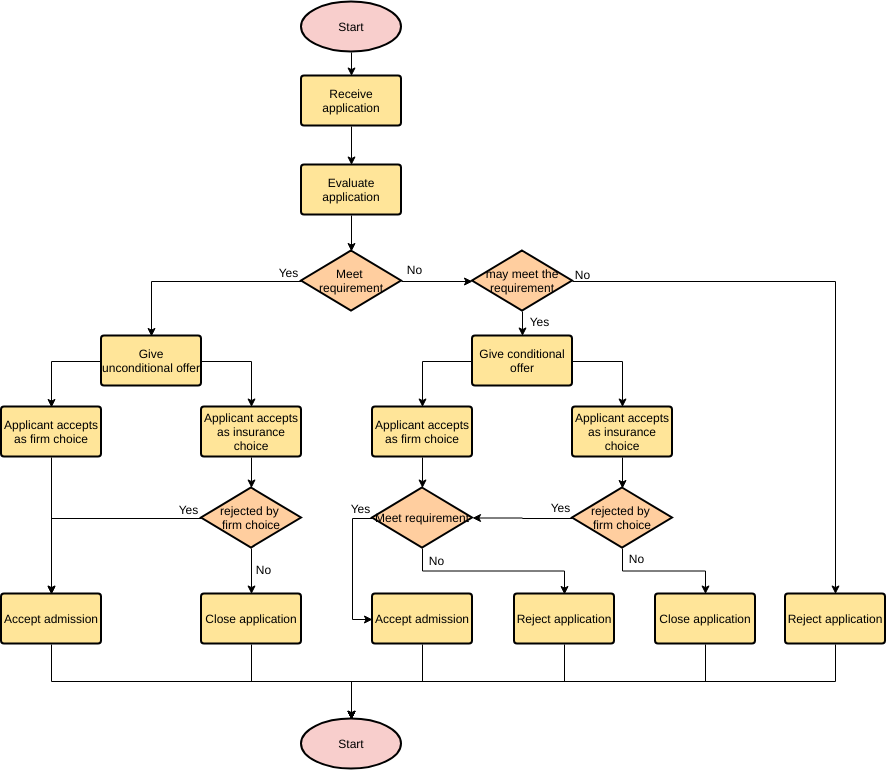
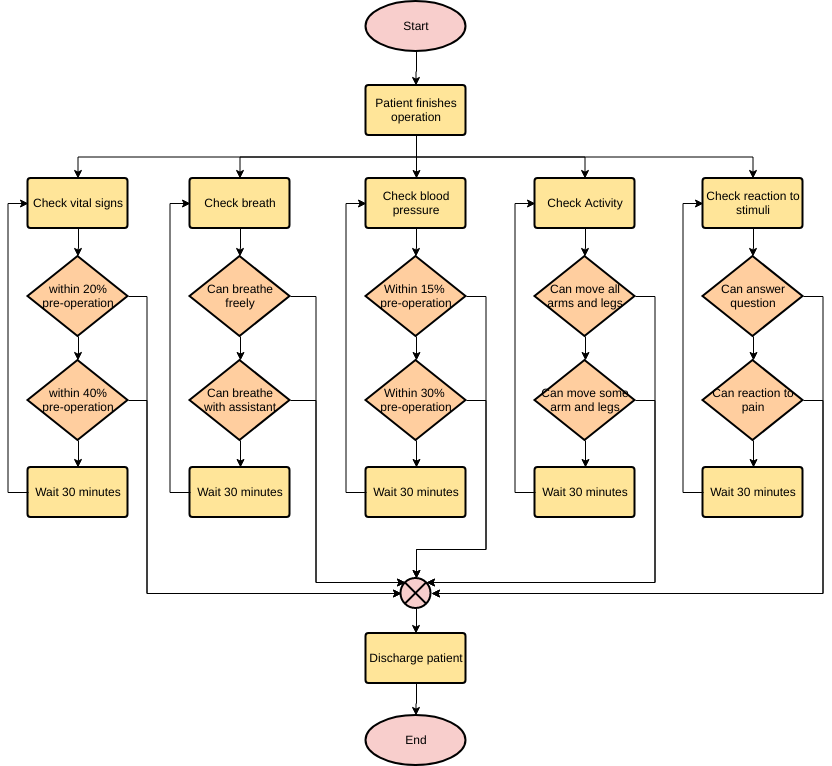
نمودار جریان چیست؟نمودار جریان؟
در سال 1921، فرانک گیلبرت نمودار جریان را توسعه داد که برای اولین بار به انجمن مهندسان مکانیک آمریکا (ASME) ارائه شد. در دهه 1930، صنعتگر آلن موگنسن نمودارهای جریانی را که در صنعت و تجارت قابل استفاده بودند کشف کرد. موگنسن کنفرانسهای آموزشی را آغاز کرد و به دانشآموزان آموزش داد که چگونه از نمودارهای جریان استفاده کنند. در سال 1947، داگلاس هارتری توضیح داد که همکاری بین هرمان گلدستین و جان فون نویمان منجر به توسعه کاربردهای نمودار جریان در برنامهنویسی کامپیوتر شد. سپس نمودارهای جریان به عنوان یک تکنیک برای سادهسازی الگوریتمهای کامپیوتری به کار رفتند.
به طور سنتی،نمودارهای جریاناغلب برای نشان دادن منطق یک برنامه استفاده میشوند. به برنامهریزی یا توضیح منطق برنامه و توضیح جزئیات برنامه کمک میکند. به عنوان یک برنامهنویس، اغلب لازم است که نمودارهای جریان را برای نشان دادن فرآیند اجرای سیستم یا بیان منطق برخی کسبوکارها ترسیم کنید. میتوان گفت که ترسیم نمودارهای جریان یک مهارت است که برنامهنویسان باید به آن تسلط داشته باشند.
از آن زمان، نمودارهای جریان تکامل یافته و پیچیدهتر شدهاند که منجر به توسعه نمودار فعالیت زبان مدلسازی یکپارچه (UML) شده است. ترمینالهای کامپیوتری تعاملی اهمیت نمودارهای جریان را با ارائه الگوریتمهای بسیار قابل خواندن کاهش دادهاند.
امروزه، نمودارهای جریان در بسیاری از صنایع، از جمله مهندسی، علوم فیزیکی، برنامهنویسی کامپیوتر و حتی سرگرمی به طور گستردهای استفاده میشوند.علاوه بر این، نمودارهای جریان میتوانند برای مستندسازی سایر برنامههای ترتیبی نیز استفاده شوند. به عنوان مثال، یک فرآیند تجاری.
چرا به نمودار جریان نیاز داریم؟
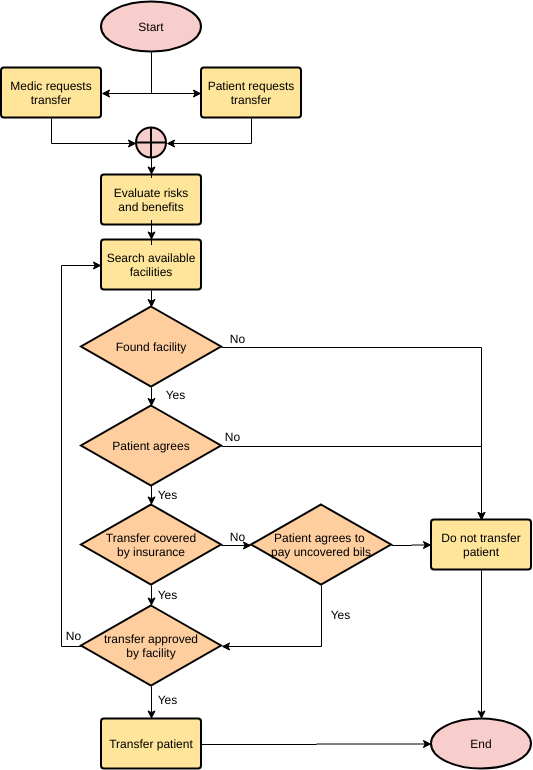
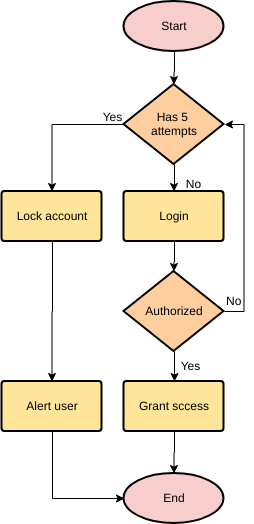
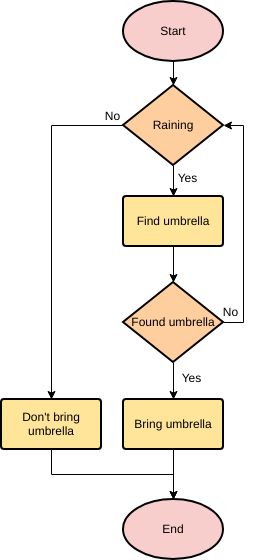
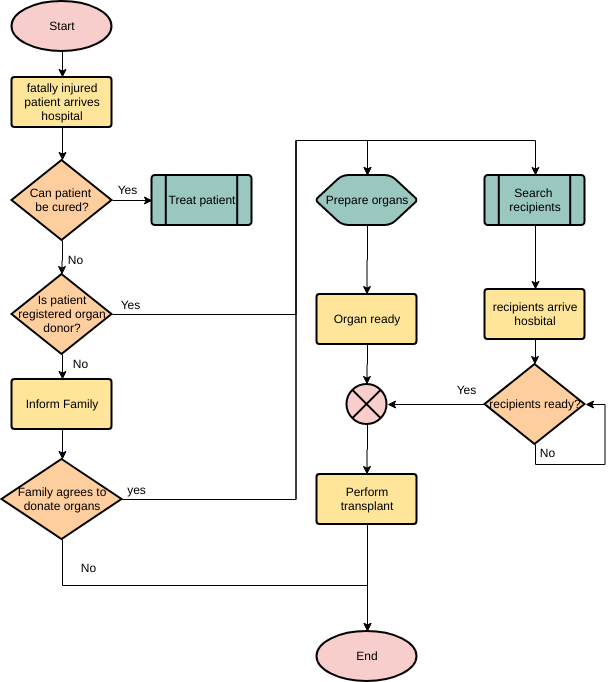
یکی از مزایای نمودارهای جریان این است که میتوانند نشان دهند که یک فرآیند چگونه است یا باید باشد بدون استفاده از اصطلاحات خاص حوزه. برخی از چیزها را نمیتوان تنها با کلمات توضیح داد. اما وقتی یک مفهوم از طریق یک گرافیک بصری به ما ارائه میشود، درک آن بسیار آسانتر است. به همین دلیل بسیاری از مردم از انواع مختلفی از نمودارهای جریان ساده برای انتقال ایدهها استفاده میکنند. مزایای مختلف استفاده از نمودار جریان شامل موارد زیر است:
- حل مسئله
- ارتباط فوری
- وضوح بصری
- افزایش کارایی
- سادهسازی مستندسازی
- ارتباط فوری
- اعتبارسنجی نیاز
نمادهای نمودار جریان:
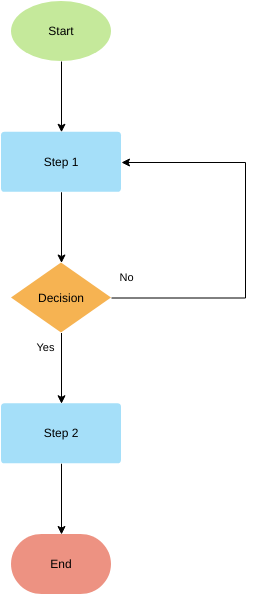
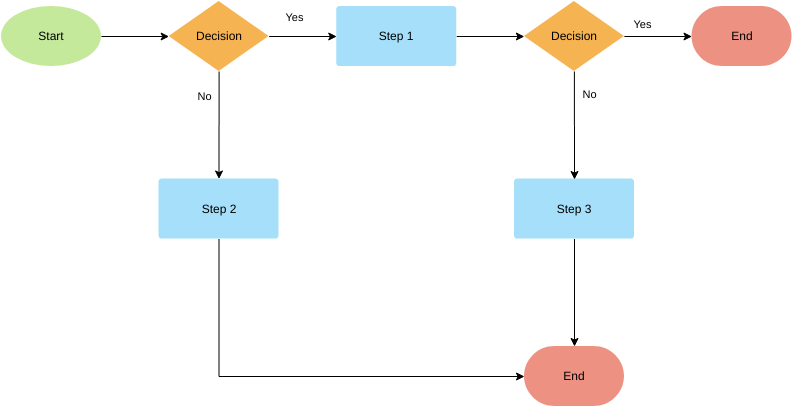
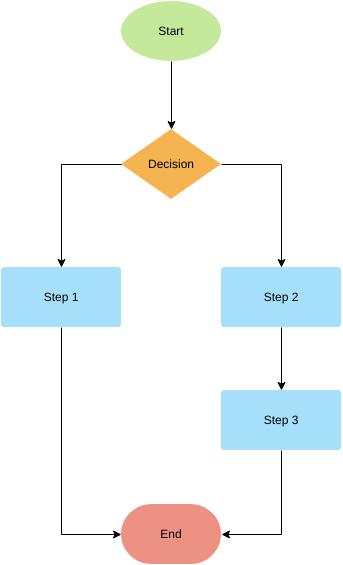
یک نمودار جریان شامل عناصر کلیدی زیر است: گرههای شروع و پایان فرآیند، فعالیتهایی که باید انجام شوند، گرههای تصمیم و اتصالات.
نمادهای مختلف نمودار جریان معانی قراردادی متفاوتی دارند.
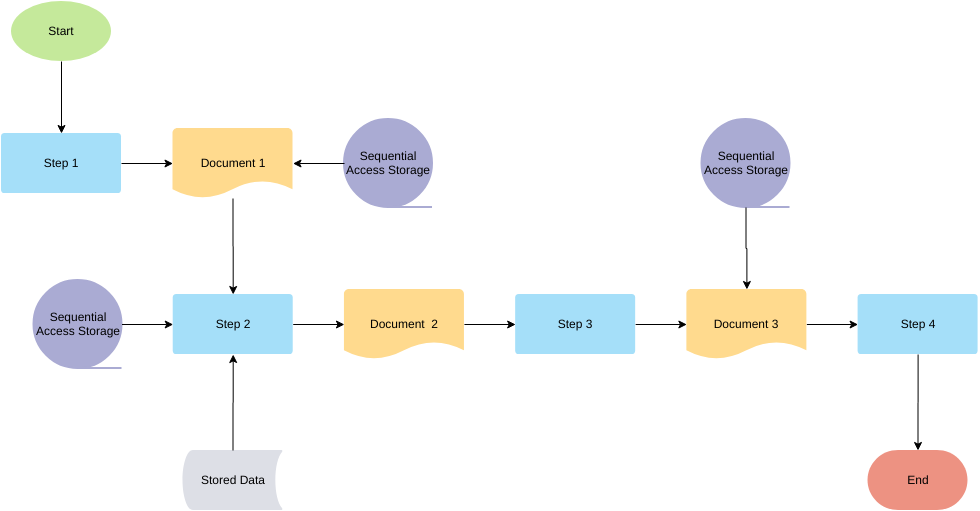
نمادهای مختلفی که در طراحی نمودارهای جریان استفاده میشوند در زیر آورده شده است.
- ترمینال:در نمودار جریان، با کمک یک دایره برای نشان دادن نماد شروع و توقف نمایش داده میشود. نماد زیر برای نشان دادن نماد ترمینال استفاده میشود.

- ورودی/خروجی:نماد ورودی برای نشان دادن دادههای ورودی استفاده میشود و نماد خروجی برای نمایش عملیات خروجی استفاده میشود. نماد زیر برای نشان دادن نماد ورودی/خروجی استفاده میشود.

- نماد پردازش:در یک نمودار جریان با کمک یک جعبه مستطیلی که برای نشان دادن دستورالعملهای حسابی و حرکت دادهها استفاده میشود، نمایش داده میشود. نماد زیر برای نشان دادن نماد پردازش استفاده میشود.

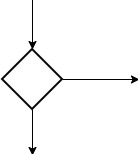
- نماد تصمیم:نماد الماس برای نشان دادن بیانیههای تصمیمگیری استفاده میشود. نماد زیر برای نشان دادن نماد تصمیم استفاده میشود.
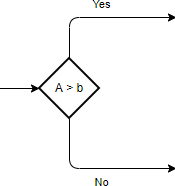
- اتصال:نماد اتصال در صورتی استفاده میشود که جریانها در نقطهای قطع شده و دوباره در مکان دیگری ادامه یابند. نماد زیر نمایانگر نماد اتصال است.

- خطوط جریان:این خطوط ترتیب دقیق اجرای دستورالعملها را نشان میدهد. از پیکانها برای نشان دادن خطوط جریان در یک نمودار جریان استفاده میشود. نماد زیر برای نشان دادن خطوط جریان استفاده میشود:

- نماد مرجع در صفحه:این نماد حاوی یک حرف درون خود است که نشان میدهد جریان در نماد متناسبی که حاوی همان حروف در جای دیگری از همان صفحه است، ادامه مییابد. نماد زیر برای نشان دادن نماد مرجع در صفحه استفاده میشود.

- مرجع خارج از صفحه:این نماد حاوی یک حرف درون خود است که نشان میدهد جریان در نماد متناسبی که حاوی همان حرف در جای دیگری از یک صفحه متفاوت است، ادامه مییابد. نماد زیر برای نشان دادن نماد مرجع خارج از صفحه استفاده میشود.

- نماد ذخیرهسازی داخلی:نماد زیر برای نشان دادن نماد ذخیرهسازی داخلی استفاده میشود.

7 مرحله برای توسعه یک نمودار جریان؟
در اینجا مراحل کلی برای ایجاد یک نمودار جریان آورده شده است.
- مشکل را شناسایی کنید: فرآیندی که نیاز به تجسم دارد چیست؟
- هدف را تعریف کنید
- مراحل مسیر اصلی را به ترتیب صحیح فهرست کنید
- هر مرحله را به عنوان ورودی/خروجی/داده، فرآیند، مستند یا دیگر تعیین کنید
- نمودار جریان خود را با شکستن برخی از وظایف پیچیده به مراحل کوچکتر و خاصتر تصحیح کنید.
- مسیرها و منطق انتخاب و تکرار را در نظر بگیرید و تصحیح کنید
- نمودار جریان را بر اساس هدف مرور و اصلاح کنید.
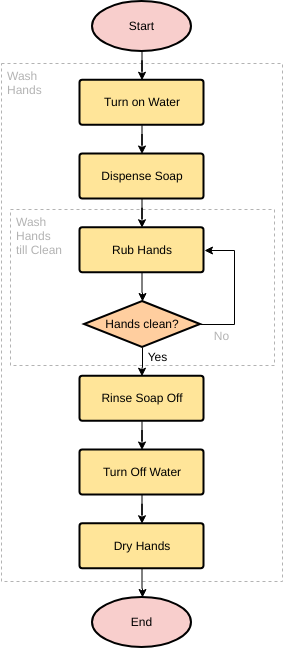
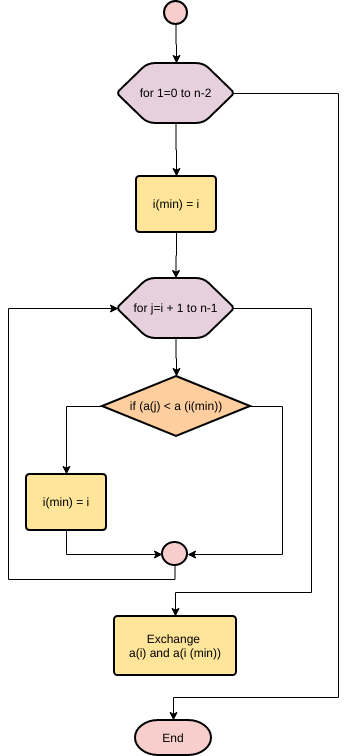
مثال نمودار جریان – مثال شستن دست
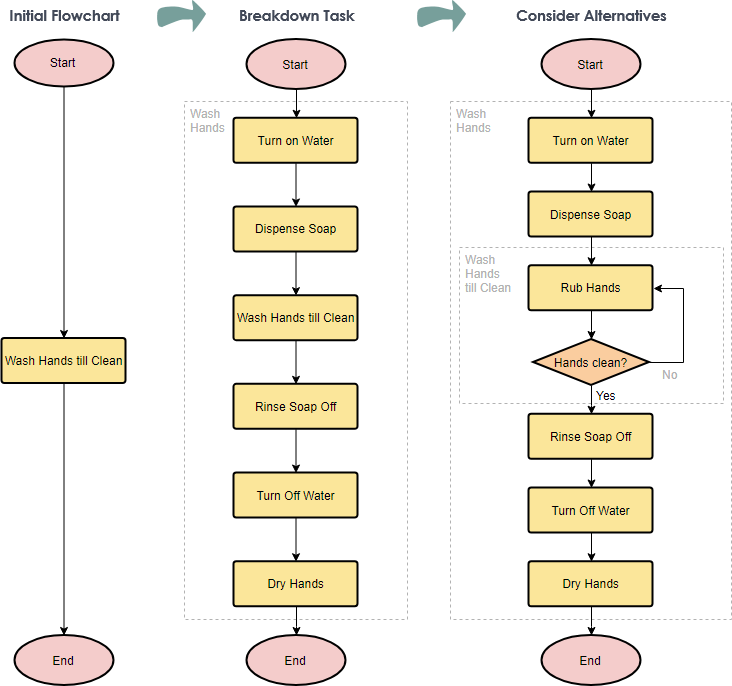
این الگوی نمودار جریان را ویرایش کنید
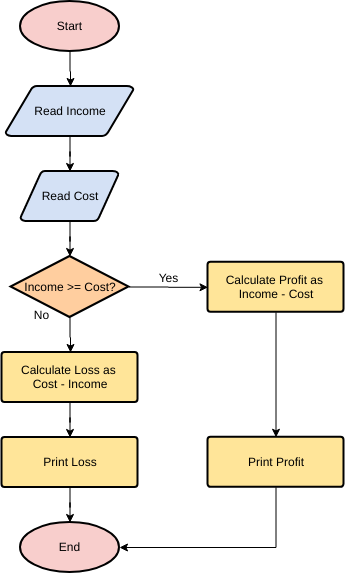
مثال 1: محاسبه سود و زیان
یک نمودار جریان برای جمع دو عدد وارد شده توسط کاربر طراحی کنید.
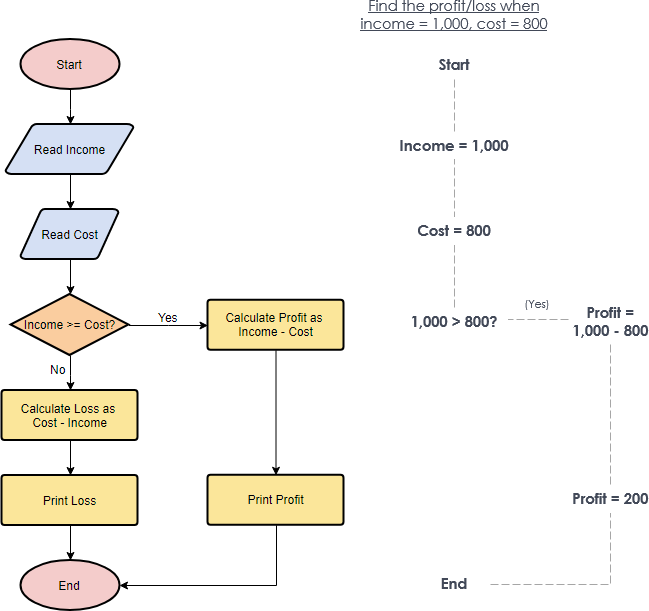
این مثال نمودار جریان را ویرایش کنید
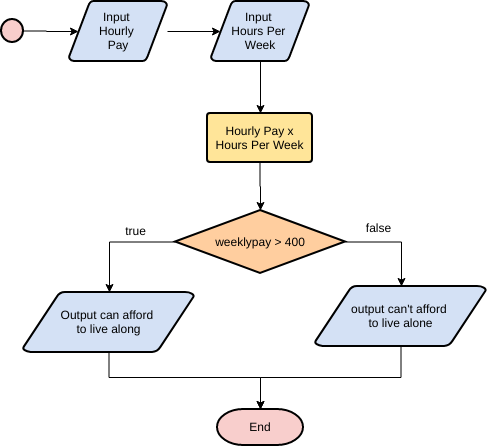
مثال 2:
یک نمودار جریان برای محاسبه سود و زیان بر اساس مقداری که کاربر وارد کرده است طراحی کنید.
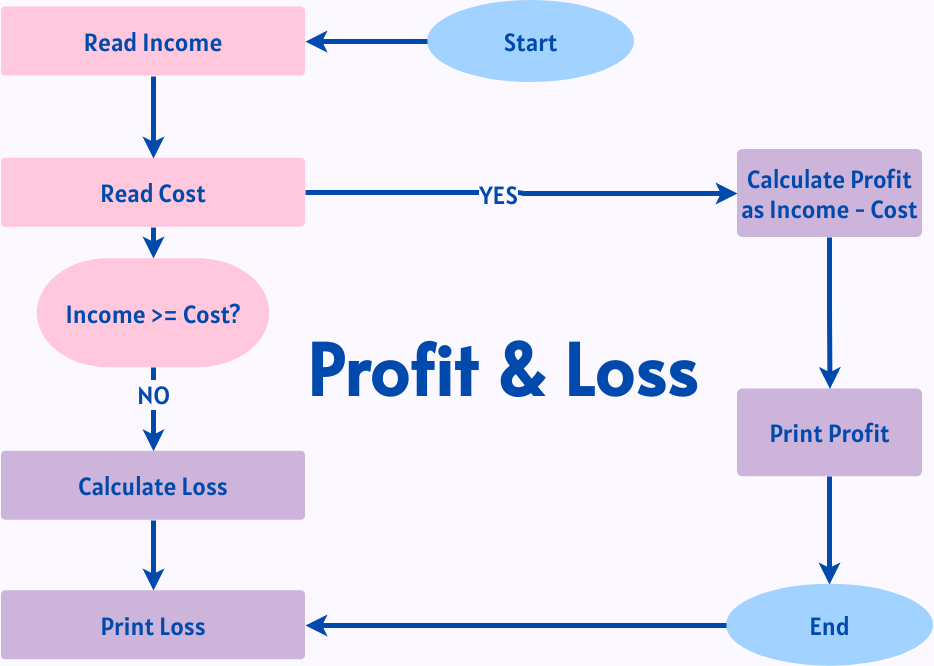
این الگوی نمودار جریان را ویرایش کنید
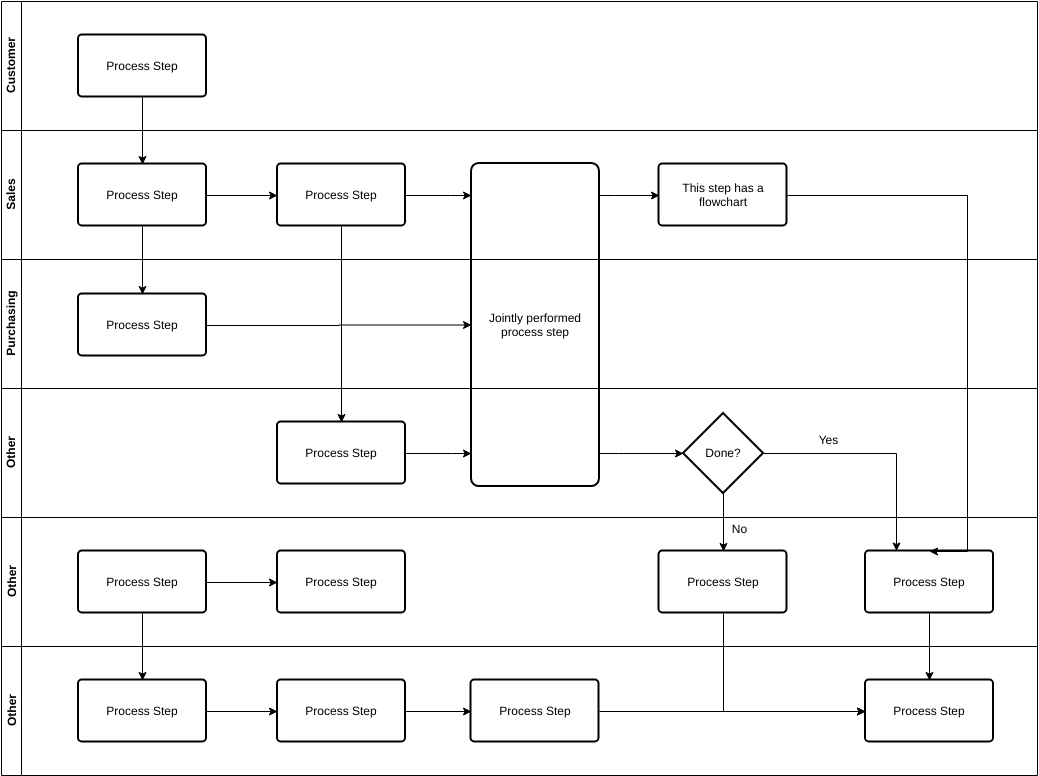
نمودارهای جریان چند وظیفهای در مقابل نمودار جریان پایه
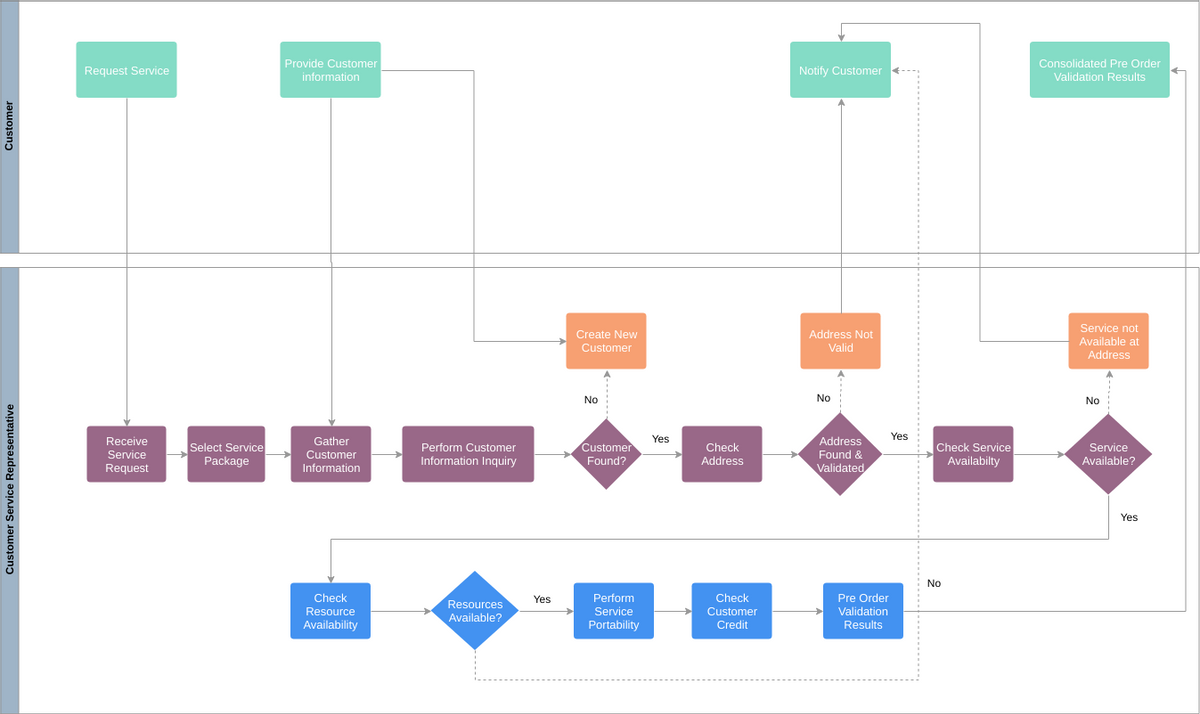
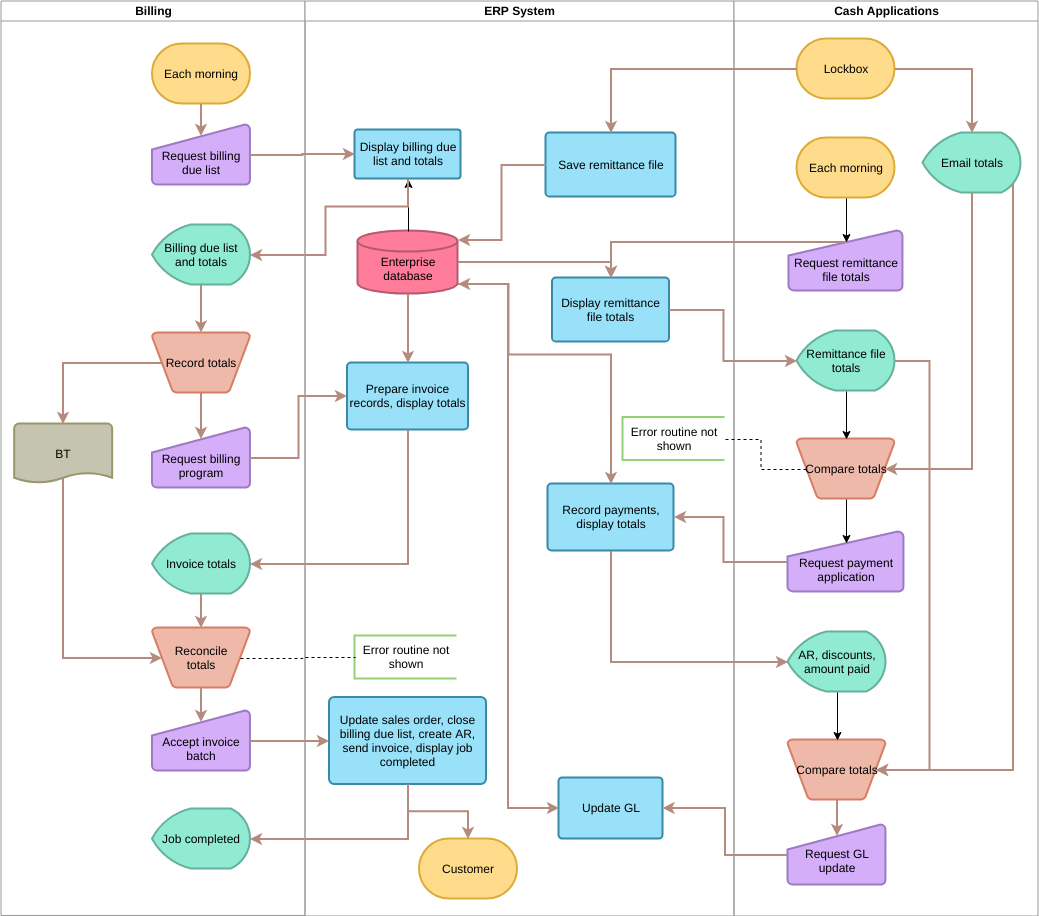
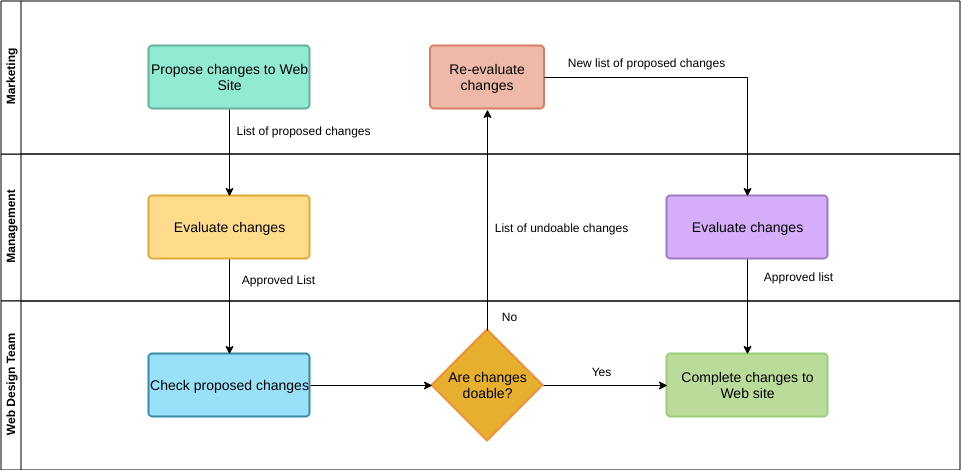
نمودار جریانی که در مورد آن صحبت میکنیم در واقع یک نمودار جریان مدیریت سنتی است که شامل نمودارهای جریان پایه و نمودارهای جریان چند وظیفهای (نمودارهای شناور) است.
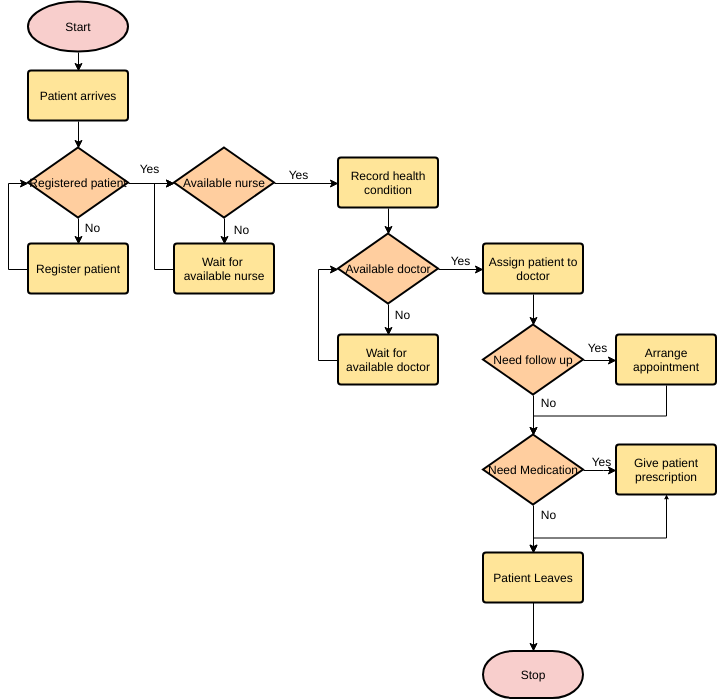
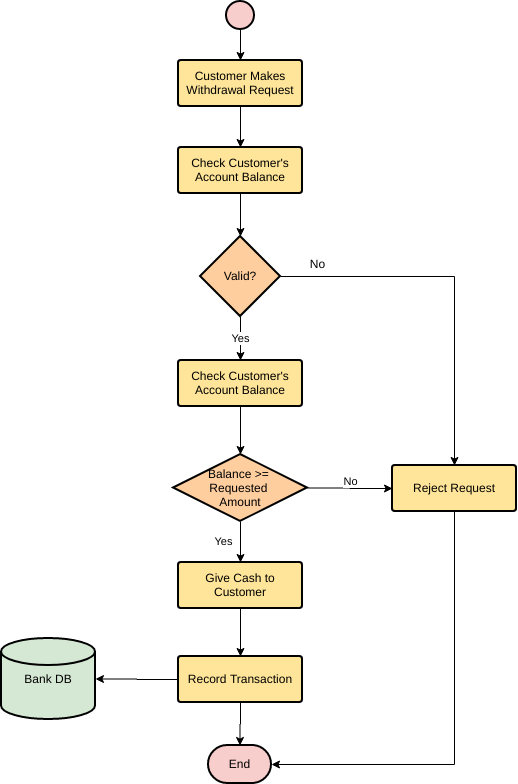
فرآیند ثبتنام بیمارستان را به عنوان مثال در نظر بگیرید.
توضیحات فرآیند تجاری: برای رفتن به بیمارستان، باید به میز خدمات بروید تا بلیط کوچکی از دپارتمانی که میخواهید ببینید (با فرض اینکه باید آن را بگیرید) دریافت کنید، سپس به پنجره ثبتنام بروید و بلیط کوچک را به کارکنان بدهید، هزینه ثبتنام را پرداخت کنید و رسید ثبتنام را دریافت کنید، سپس به دپارتمان خاصی بروید تا پزشک را ببینید.
نمودار جریان پایه
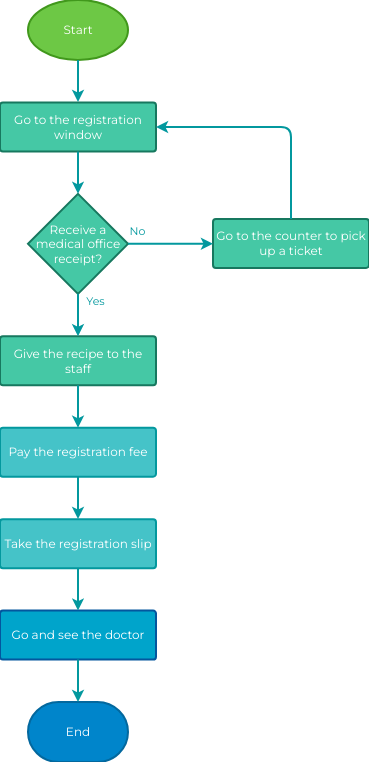
این الگوی نمودار جریان را ویرایش کنید
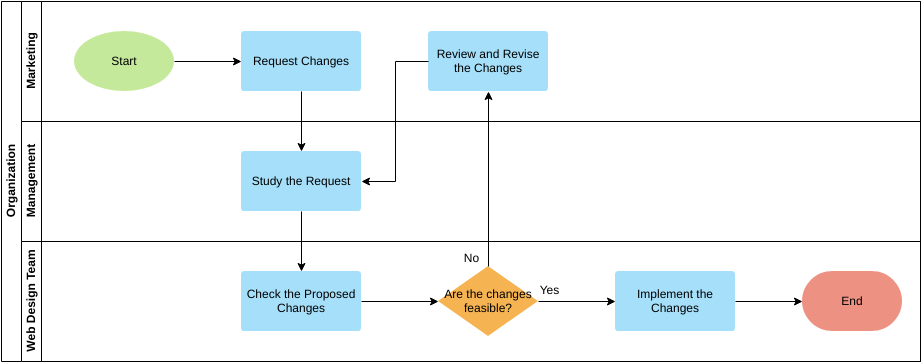
نمودار جریان چند وظیفهای (شناور) در مقابل نمودار جریان پایه
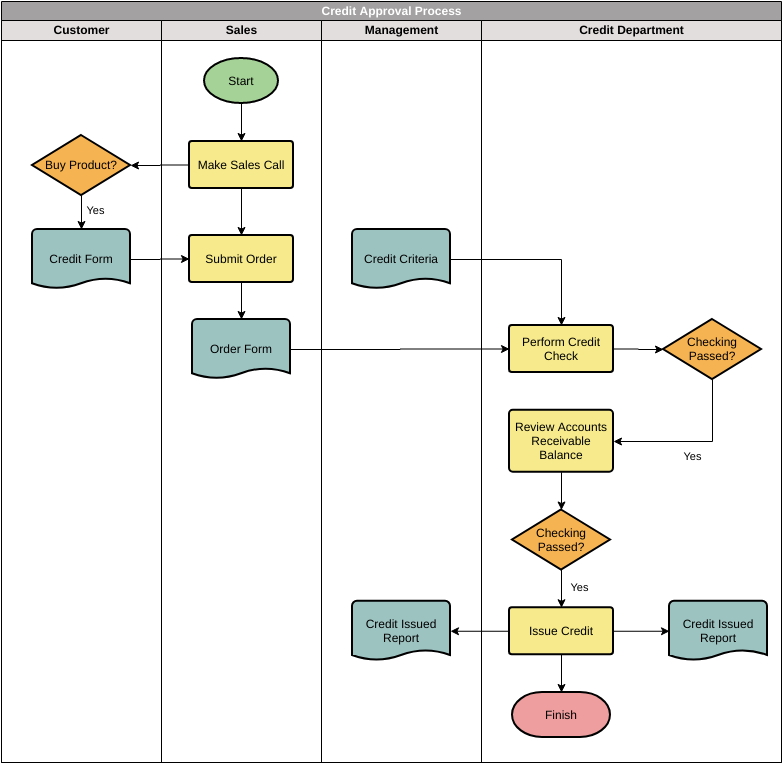
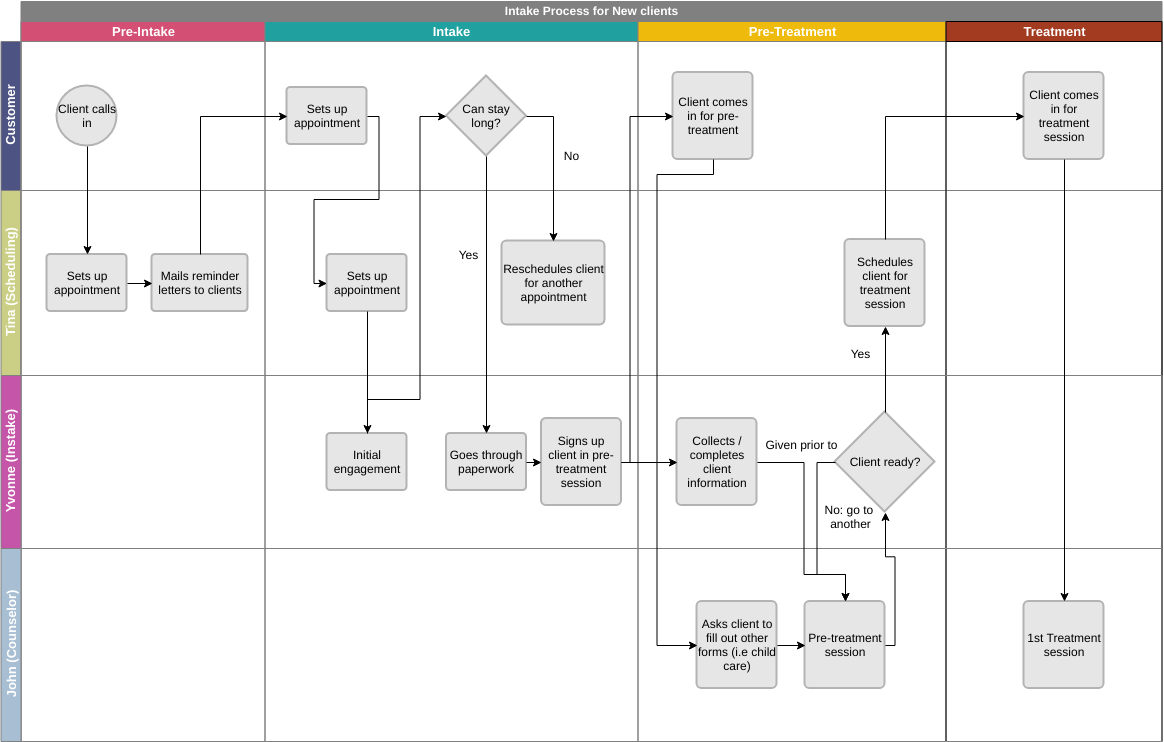
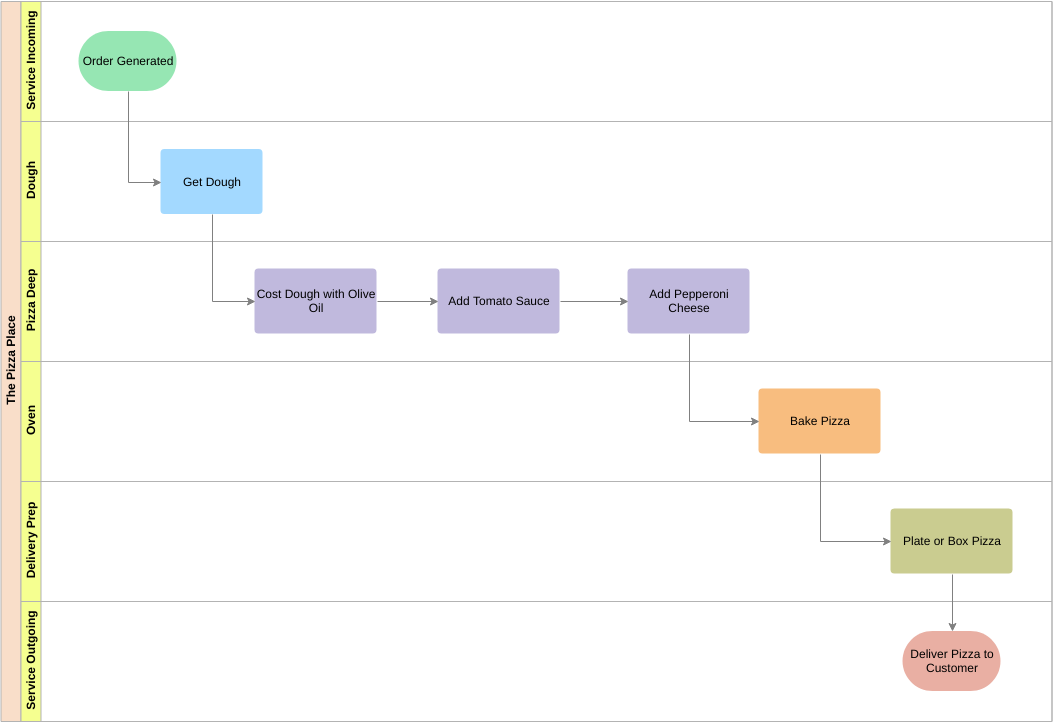
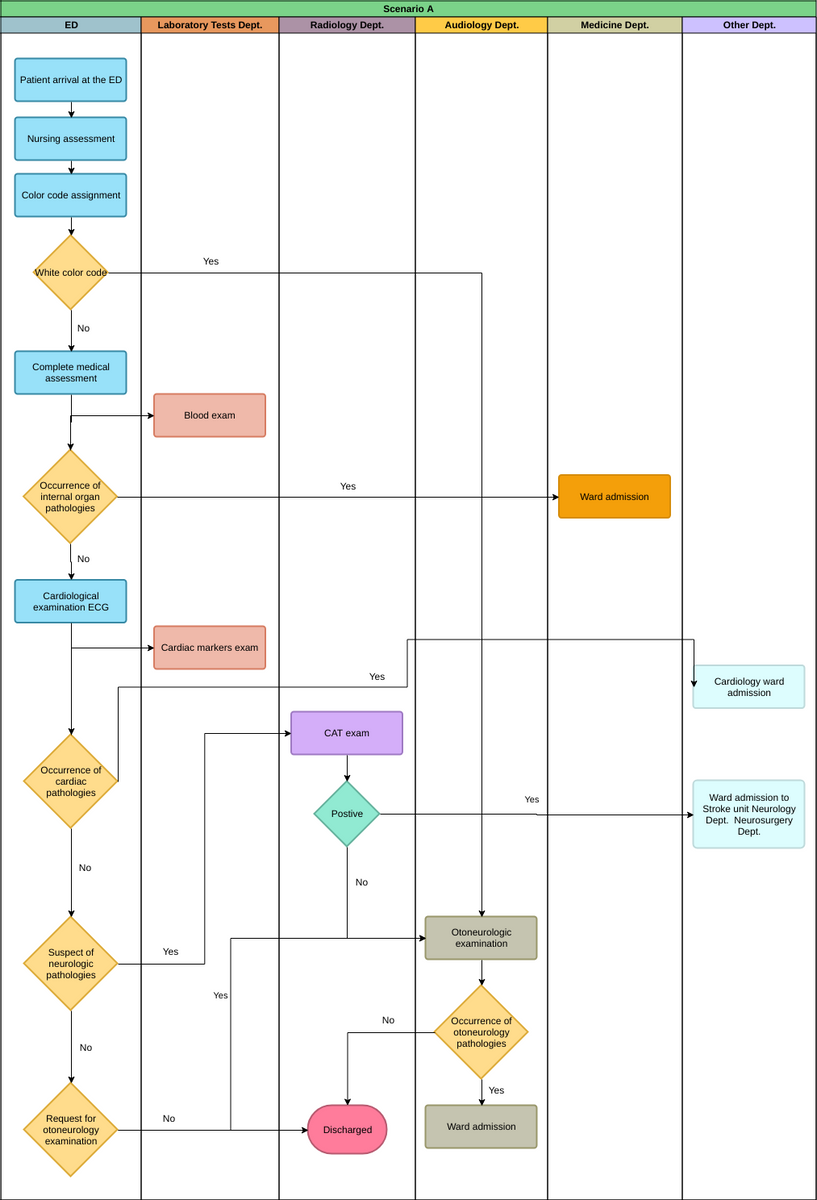
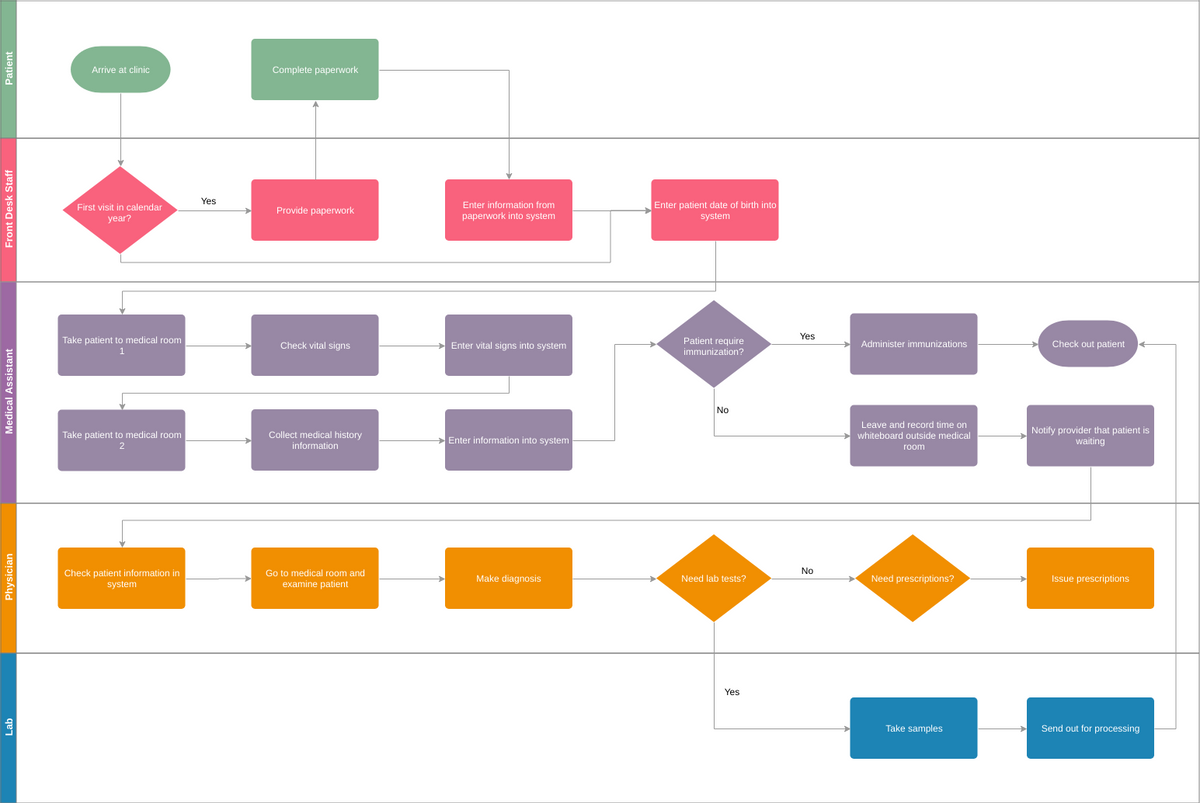
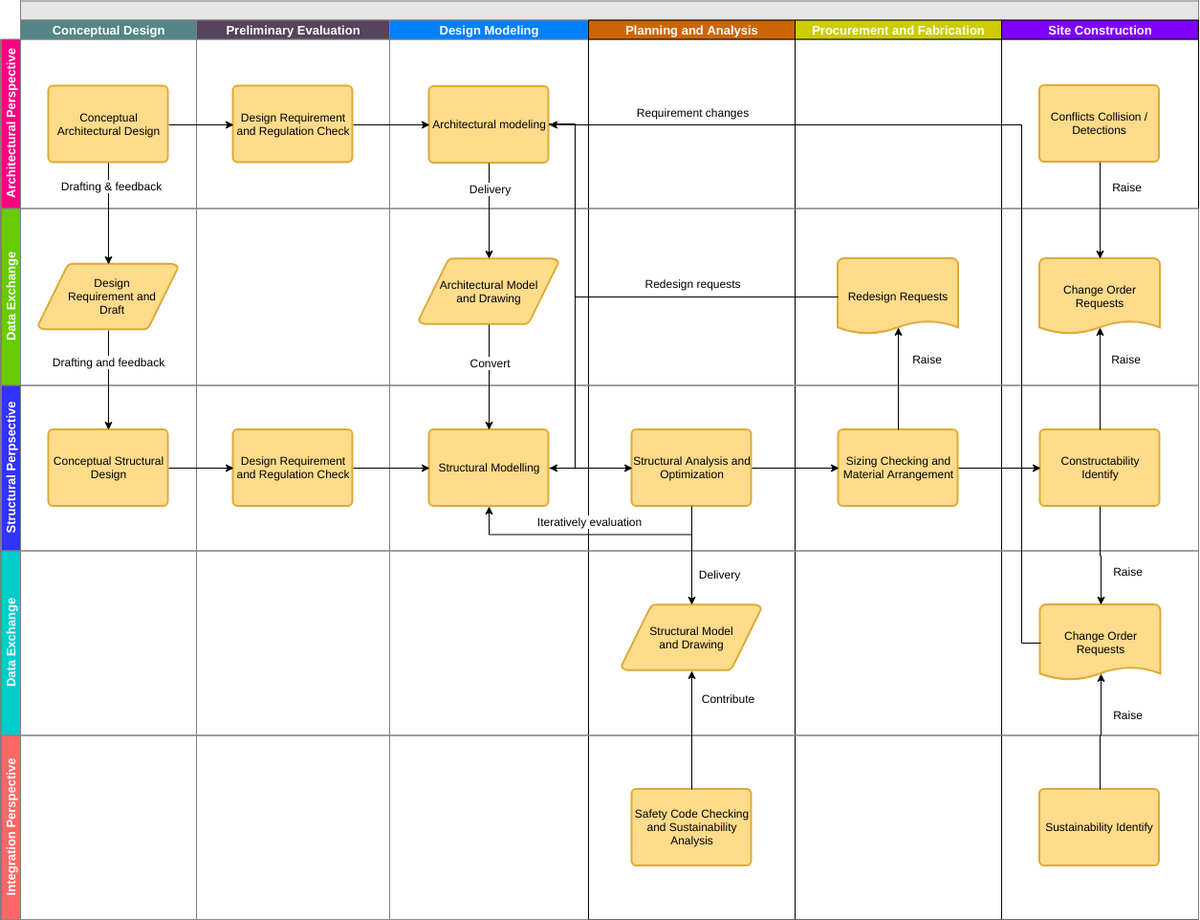
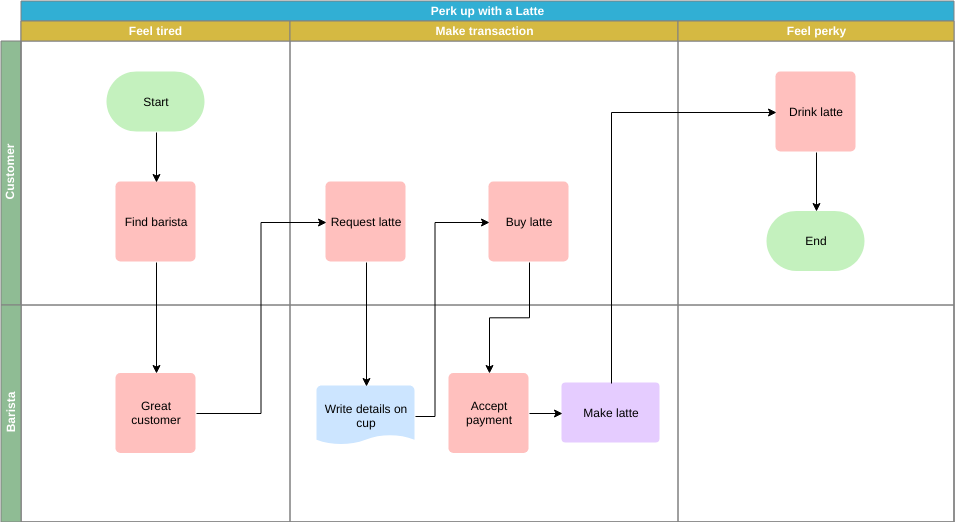
در حالی که نمودار جریان پایه به وضوح کل فرآیند را نشان میدهد، اما به وضوح نشان نمیدهد که کدام نقش مسئول هر مرحله از فرآیند است. برای نمایندگی مؤثر اینکه چه کسی مسئول هر فرآیند است، میتوان از نمودار جریان شناور استفاده کرد که نه تنها جریان کنترل کل فعالیت را منعکس میکند، بلکه به وضوح مسئولیتی را که هر نقش در فرآیند بر عهده دارد، میشناسد.
نمودارهای جریان کسبوکار مدیریت اساساً قادر به بیان جهت فرآیند کسبوکار بودهاند، اما در تعاملات سیستم پیچیده، هنگام بیان مفهوم همزمانی، نمودارهای جریان کسبوکار مدیریت سنتی قادر به بیان آن نبودهاند، که نیاز به استفاده از نمودار فعالیت UML یا نمودار شناور BPMN UML دارد.
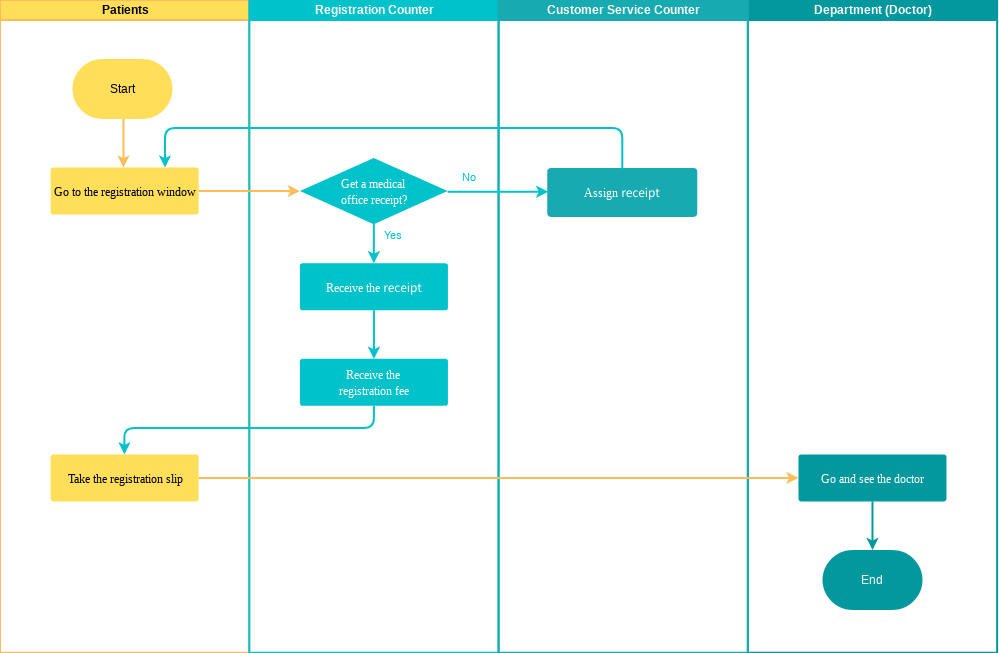
این الگوی نمودار جریان چند وظیفهای را ویرایش کنید
به دنبال نرمافزار نمودار جریان هستید؟
Visual Paradigm Online دارای ابزاری ساده برای رسم نمودار جریان است که به شما امکان میدهد نمودارهای جریان را به روشی انعطافپذیر و آسان ایجاد کنید. به عنوان یک راهحل جامع برای رسم نمودار، VP Online همچنین از نقشههای ذهنی، نمودارهای سازمانی، UML، ERD و نقشههای طبقه پشتیبانی میکند. امروز آن را امتحان کنید. نیازی به ثبتنام نیست.
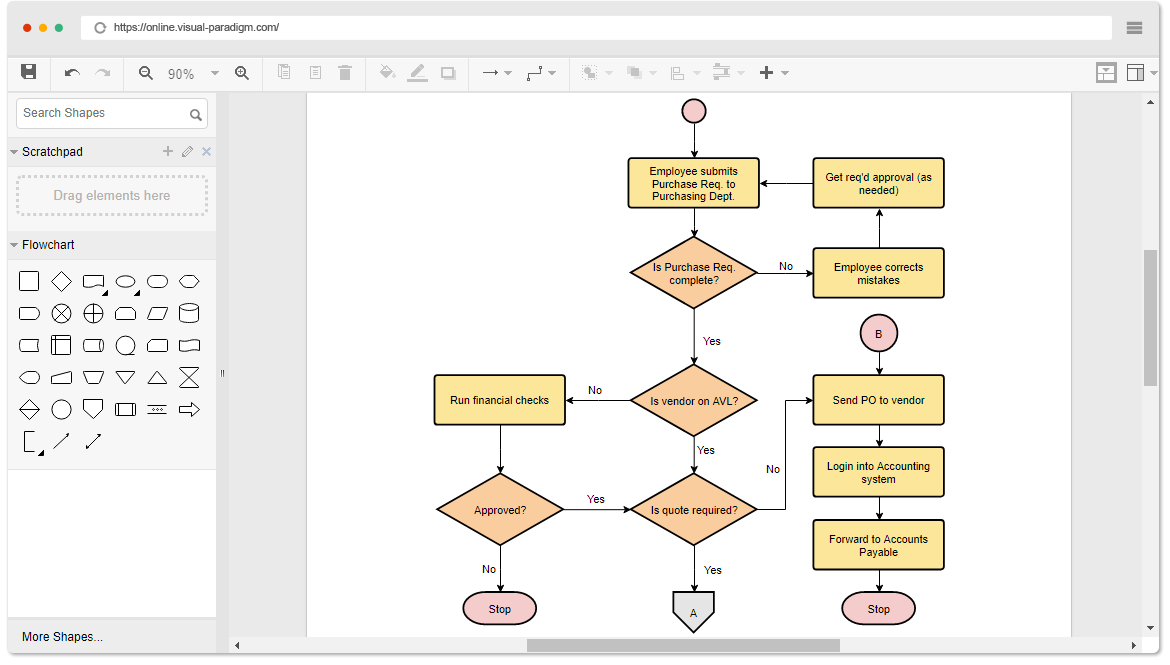
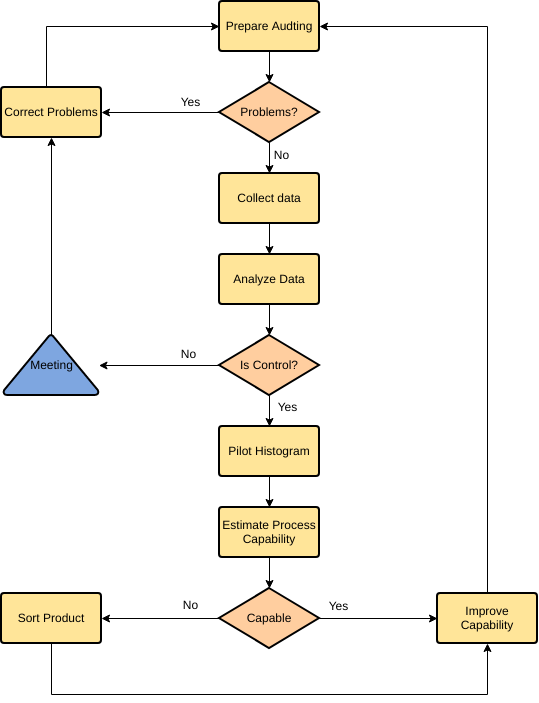
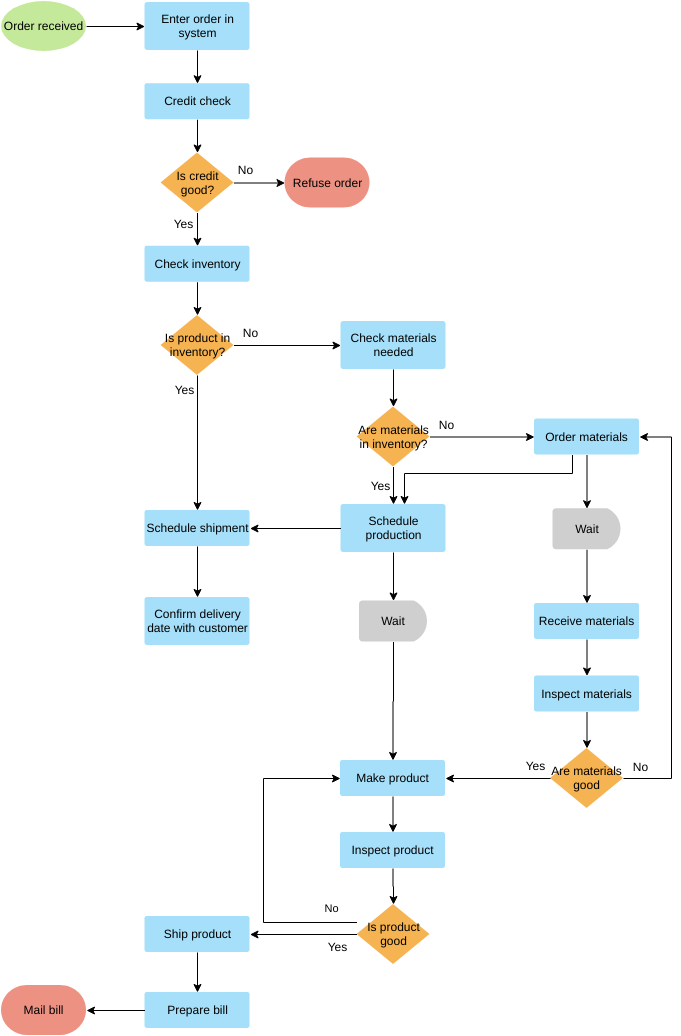
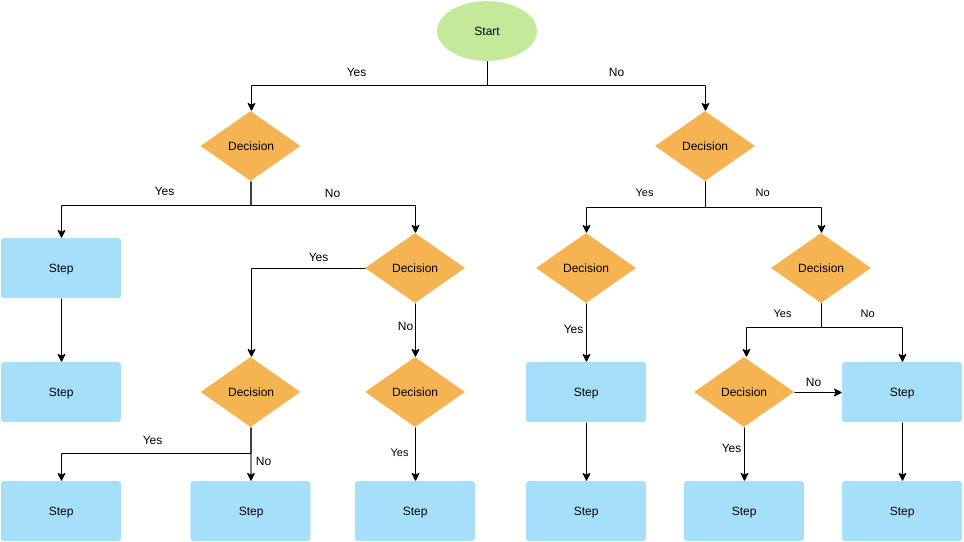
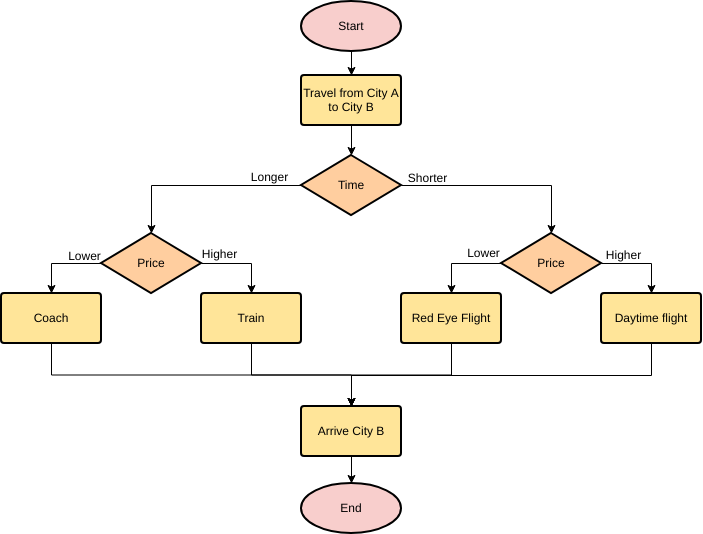
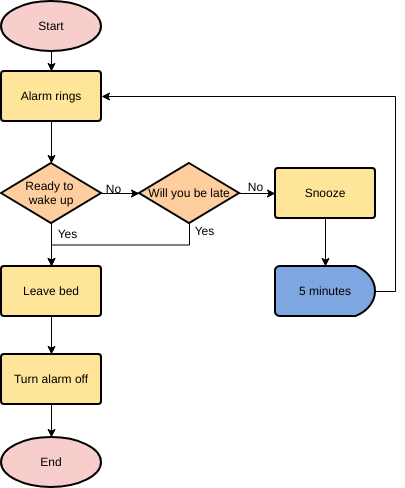
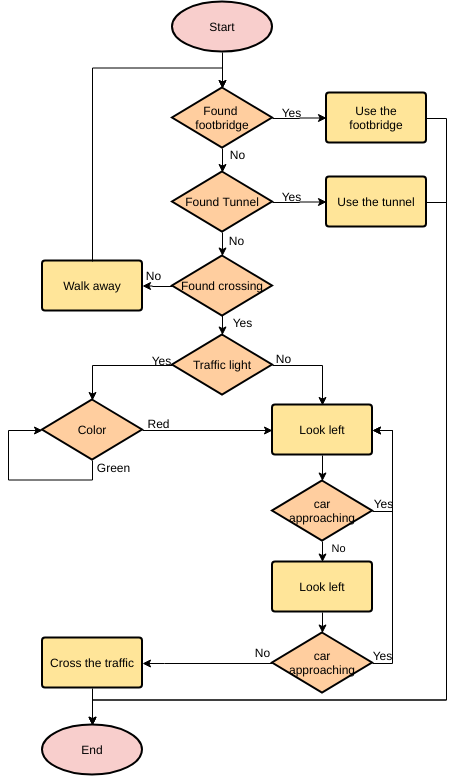
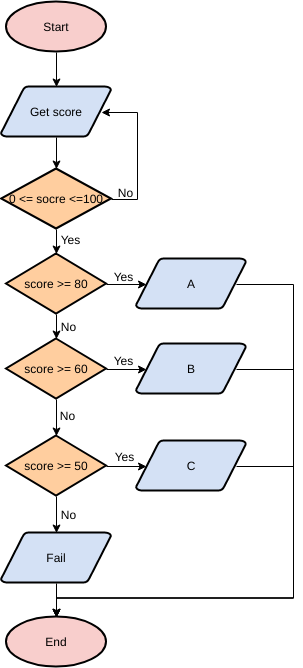
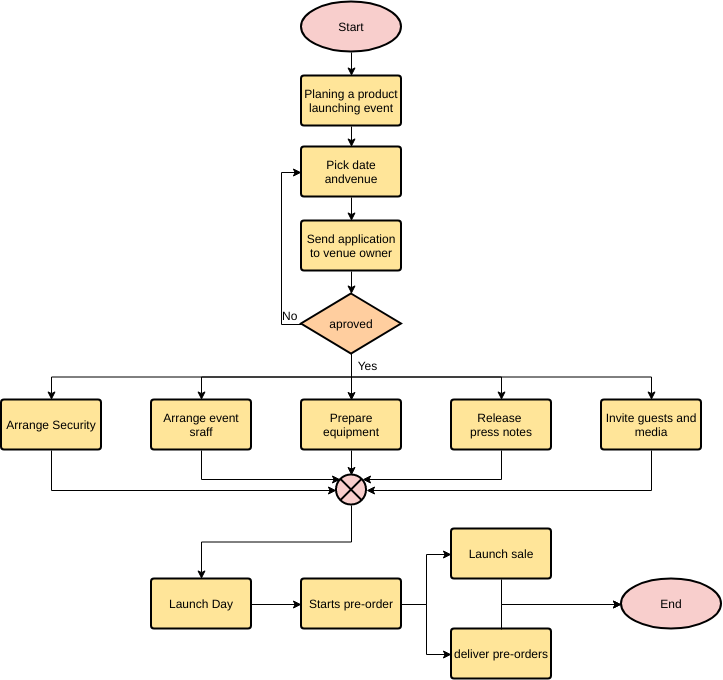
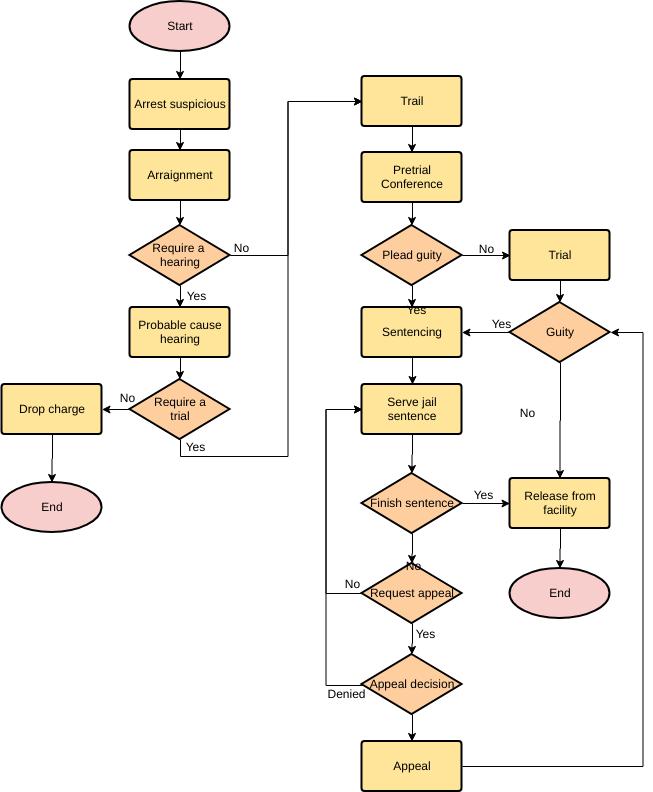
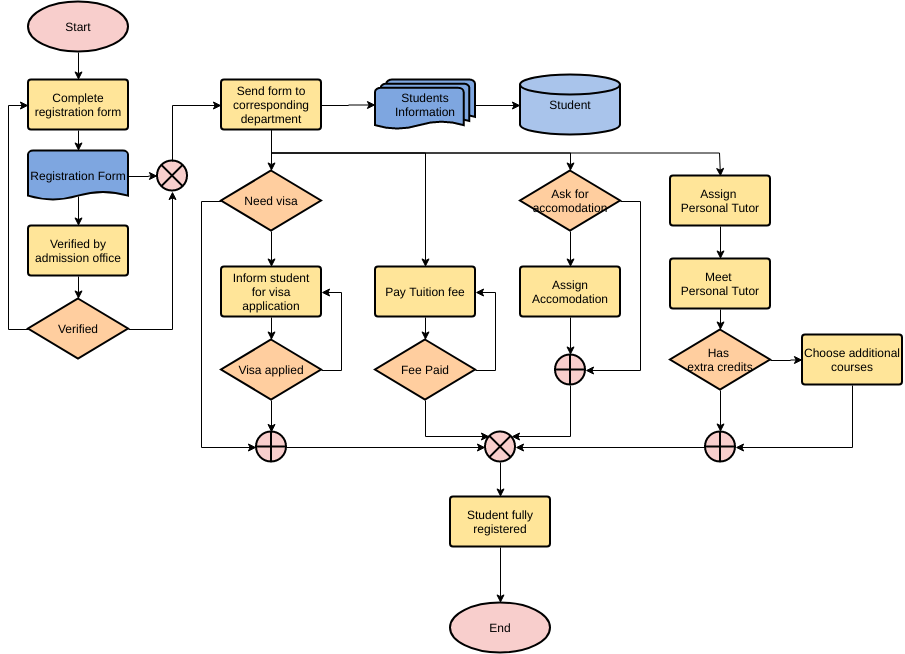
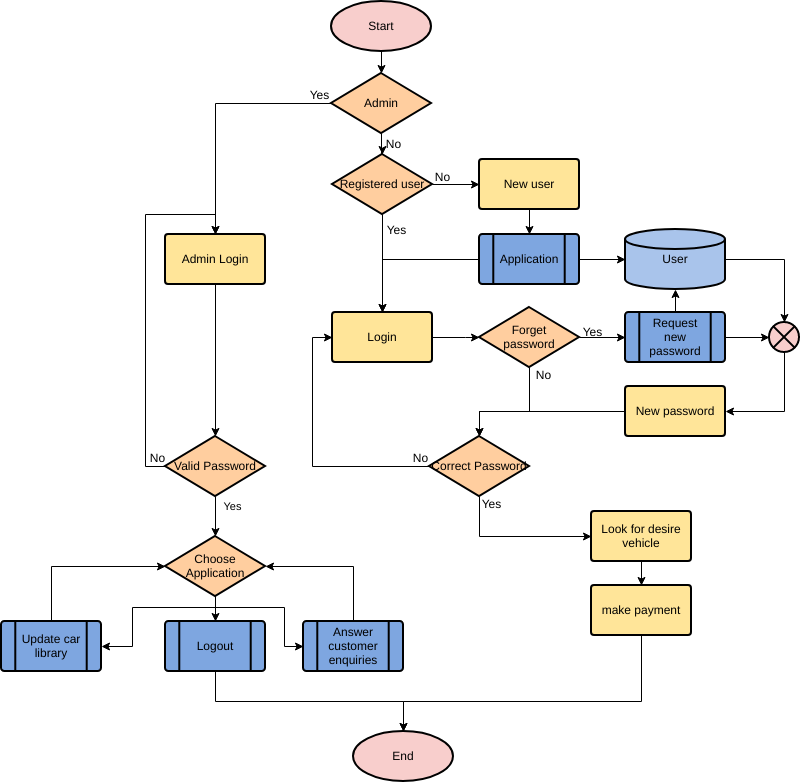
بیشتر مثالهای نمودار جریان را بیاموزید:
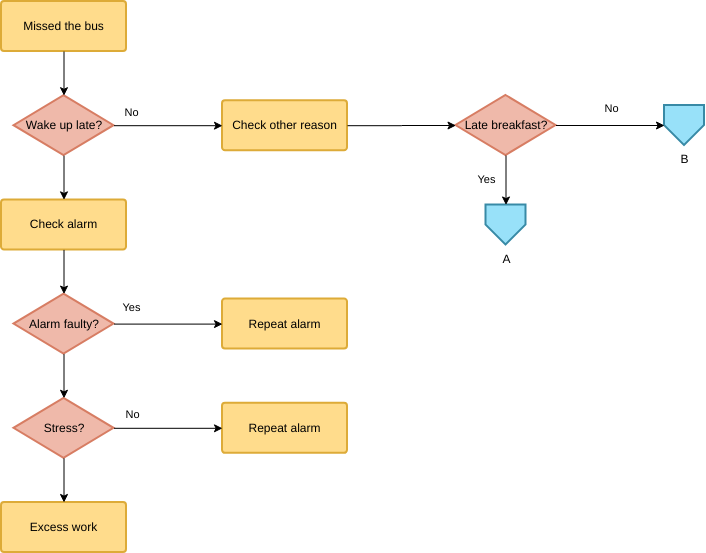
مثال نمودار جریان: اتوبوس از دست رفته
نمونههای نمودار جریان چندوظیفهای:
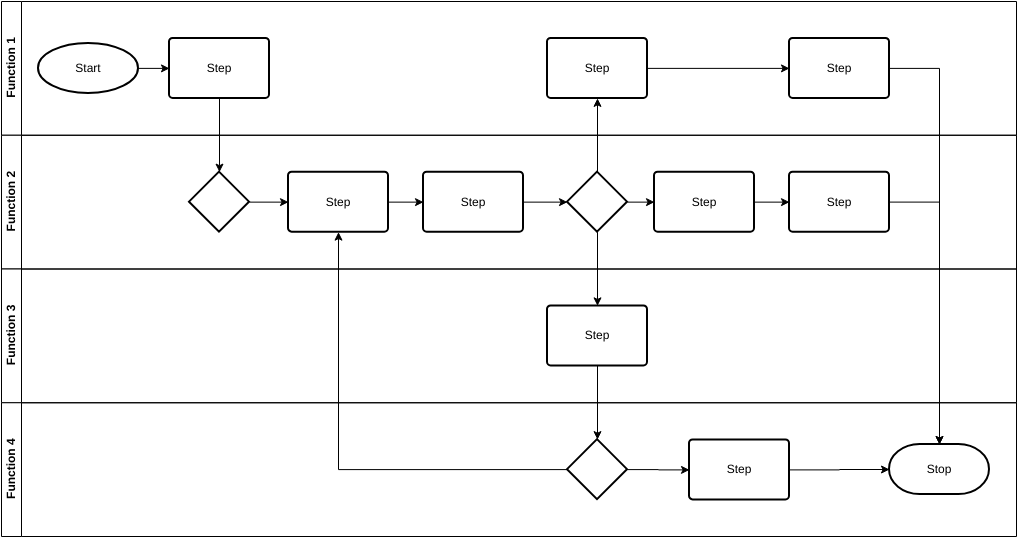
This post is also available in Deutsch, English, Español, Français, Bahasa Indonesia, 日本語, Polski, Portuguese, Ру́сский, Việt Nam, 简体中文 and 繁體中文.


