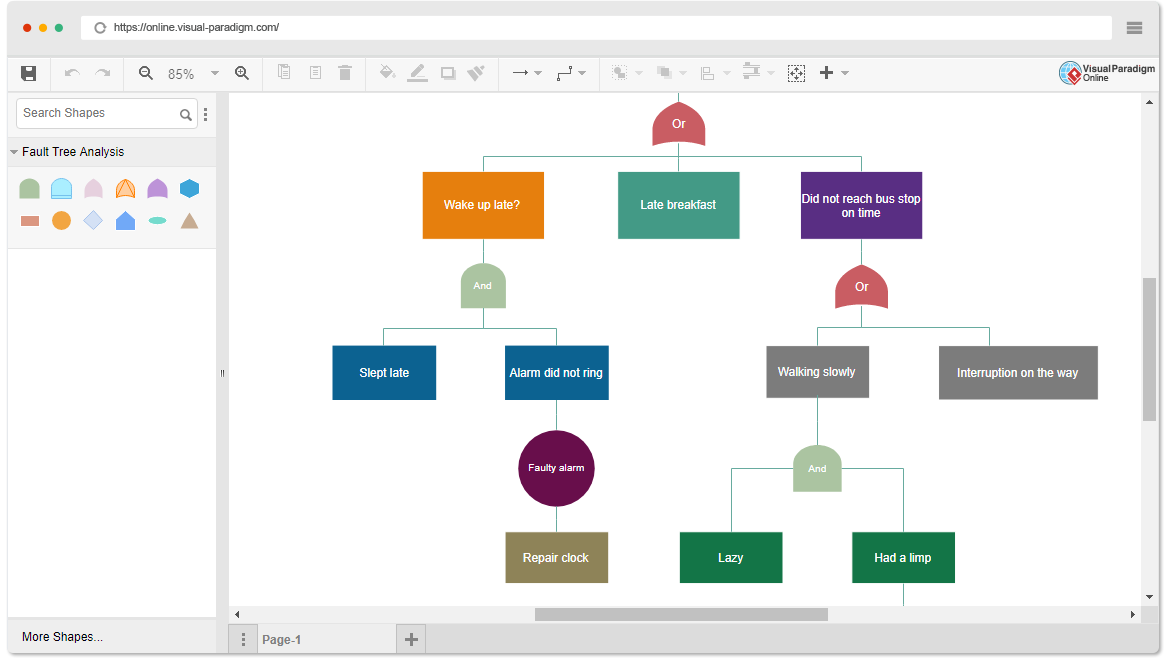
Fault tree analysis (FTA) is a top-down deductive fault analysis in which Boolean logic is used in conjunction with a series of low-level events to analyze the unexpected states of the system. This analysis method is primarily used in safety engineering and reliability engineering to understand how systems fail, determine the best way to reduce risk, and determine (or feel) the event rate of safety incidents or specific system-level (functional) failures.
Continue readingدسته: Lean Approach
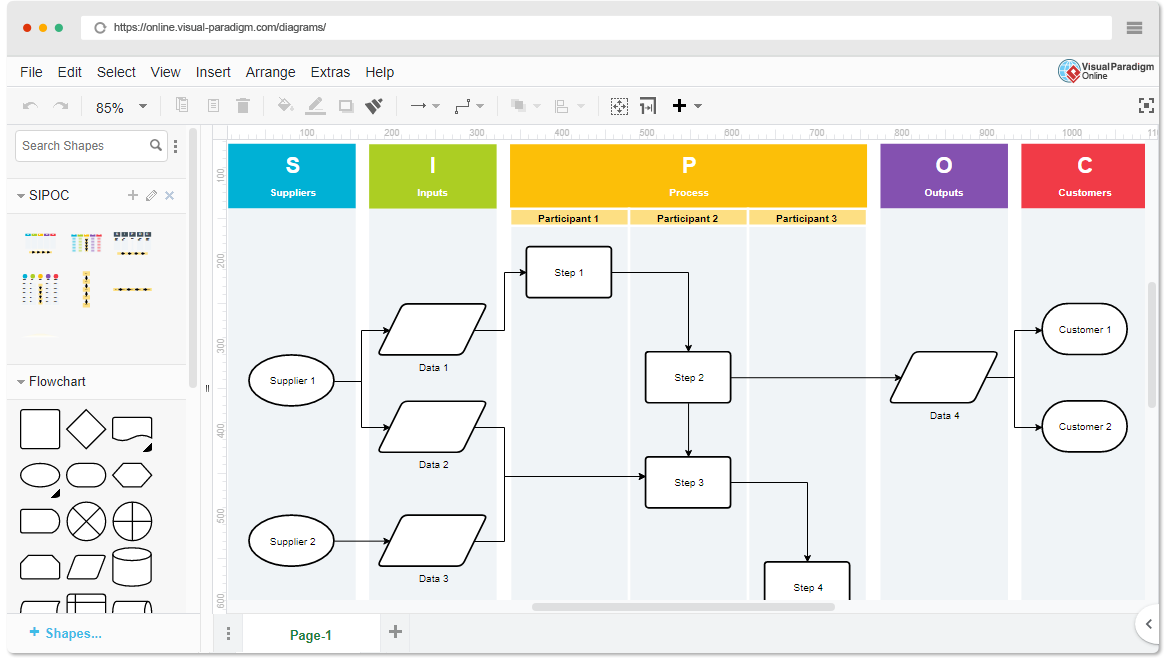
The Best Continuous Improvement Tool: What is SIPOC?
The acronym SIPOC stands for Suppliers, Inputs, Process, Outputs, and Customer. Using information from these five areas creates a process map that gives a high-level overview of a Six Sigma project. To create a SIPOC diagram, you have to specify the five main activities of the process and identify the potential suppliers, inputs, outputs, and customers.
Continue readingCritical Thinking: What is Y-Chart?
The Y-Chart is a graph consisting of three parts which can help organize the understanding of the subject by writing down and/or drawing the look, feel and sound of the subject. (1) What Does It Look Like? (2) What Does It Feel Like? (3) What Does It Sound Like?
Continue readingWhat is Value Stream Mapping?
Value stream mapping is a technique to identify and eliminate process waste. It is a special type of flow chart that uses symbols called “lean language” to describe and improve inventory and information flow. It helps us provide customers with the best value through a complete value creation process and minimize waste
Continue readingWhat is Reverse Brainstorming?
The reverse brainstorming lets you create unusual and wild ideas if the brainstorming process fails to meet the requirements. When typical brainstorming encounters difficulties, it’s time to be creative. A highly creative brainstorming technique is called reverse brainstorming. It can not only make ideas flow, but also bring a lot of fun. More importantly, it can stimulate innovative ideas and useful insights to produce positive results.
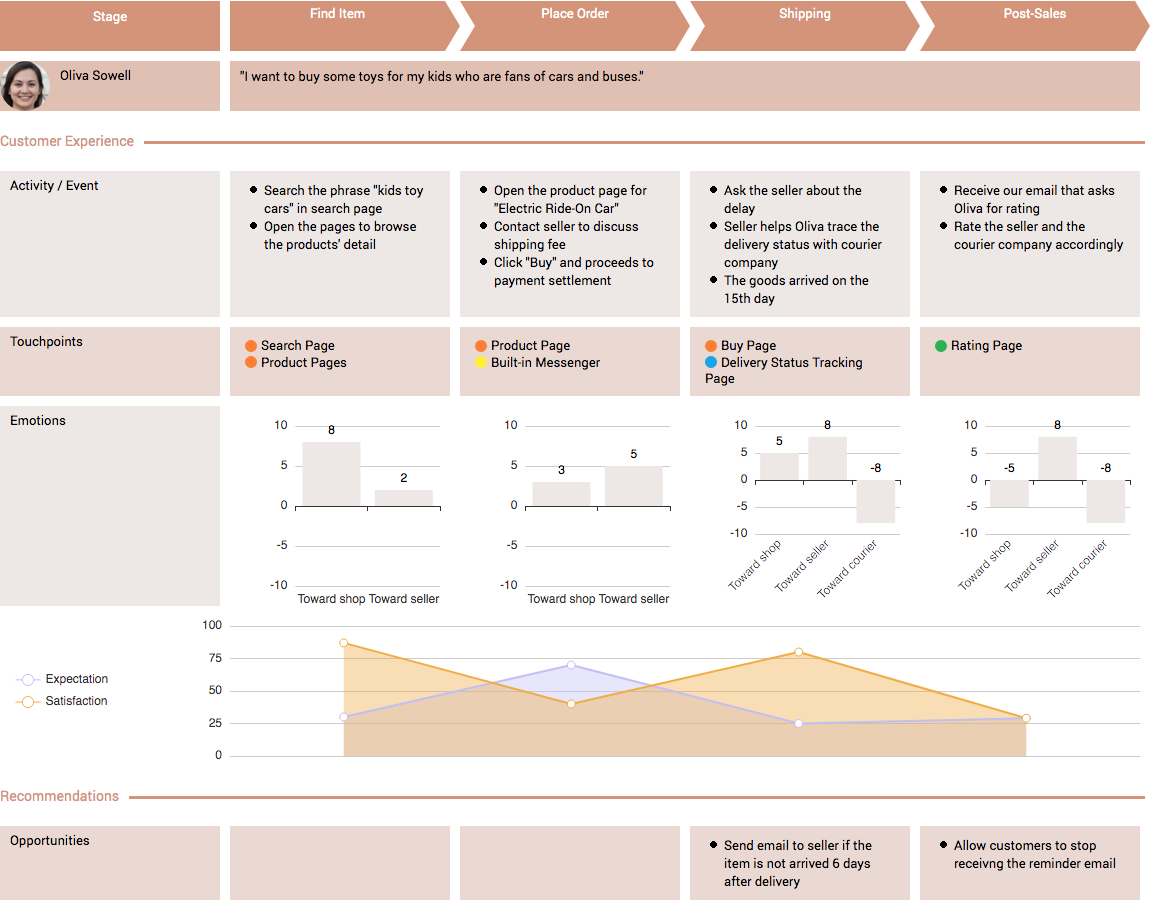
Continue readingImprove Customer Experience with Customer Journey Map
The customer journey map can be used to describe the story of a certain role customer in a specific scenario. Including customers from the first contact with the product, touching the various touch points of the product, and ending the use of the product at the end.
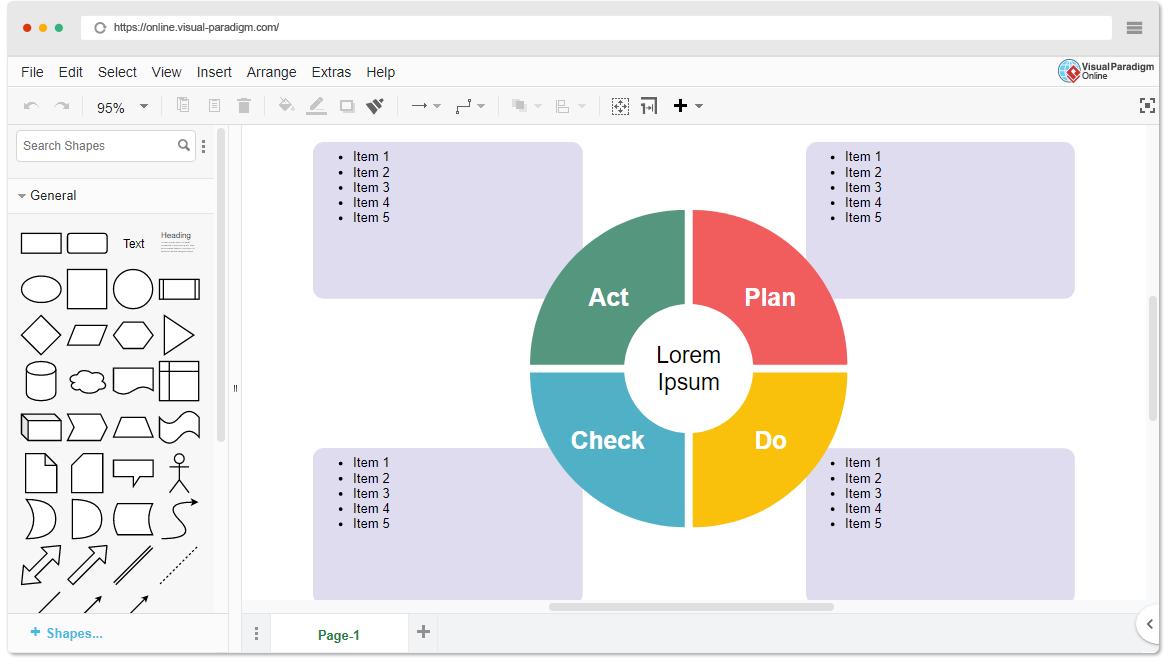
Continue readingA Comprehensive Guide for PDCA
PDCA is considered one of the most popular frameworks for continuous improvement of business processes. PDCA (plan do check action), also known as Deming cycle, is the simplest framework for process improvement. Basically, it’s a series of feedback cycles of continuous improvement — you decide how it works, figure out how to improve it, eventually make changes, and keep repeating the cycle. I believe PDCA is the simplest and most effective way to help you improve your workflow.
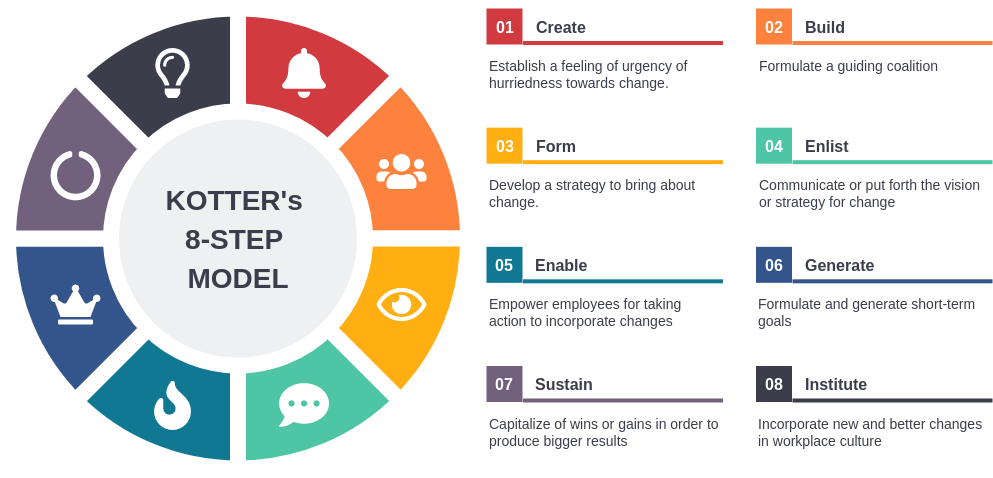
Continue readingA Comprehensive Guide to Kotter’s 8 Step Model of Change
Kotter suggests that for change to be successful, 75% of the practice team needs to “buy into” the change. In other words, you have to really work hard on Step One, and spend significant time and energy building urgency, before moving onto the next steps. Don’t panic and jump in too fast because you don’t want to risk further short-term losses — if you act without proper preparation, you could be in for a very bumpy ride.
Continue readingStrategic Planning to Actionable Items: From SWOT to TOWS Analysis
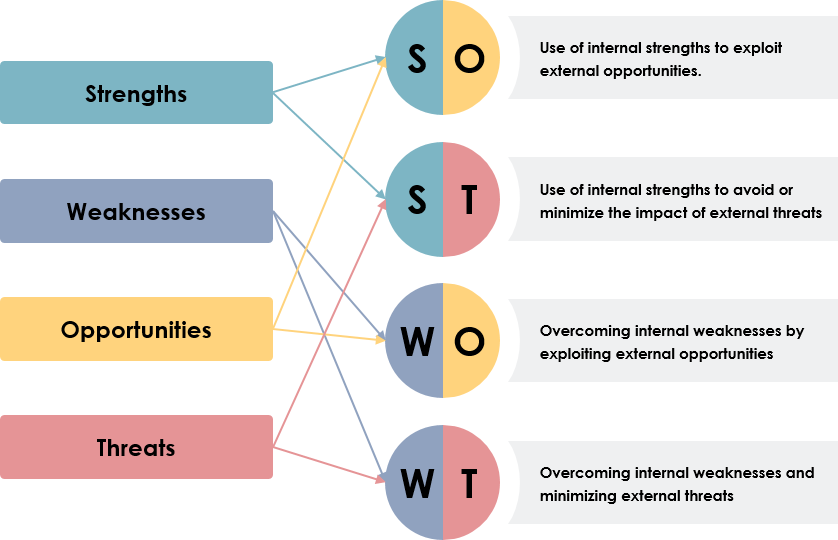
SWOT matrix is a planning tool, whereas TOWS matrix is an action tool. In SWOT analysis you identify all the Strengths, Weaknesses, Opportunities, and Threats in point form. After that you think of each point as a singular perspective. Whereas, TOWS matrix identifies the relationships between these factors and selecting strategies on their bases. Strengths and weaknesses are abstract concepts that can be hard to think about without any sort of context.
Continue readingBusiness Model Canvas — Learn By Examples with Free Online Software
Business Model Canvas is a strategic and business management template for developing new or documenting existing business models. It is a visual chart with elements describing a firm’s or product’s value proposition, infrastructure, customers, and finances.
Continue reading