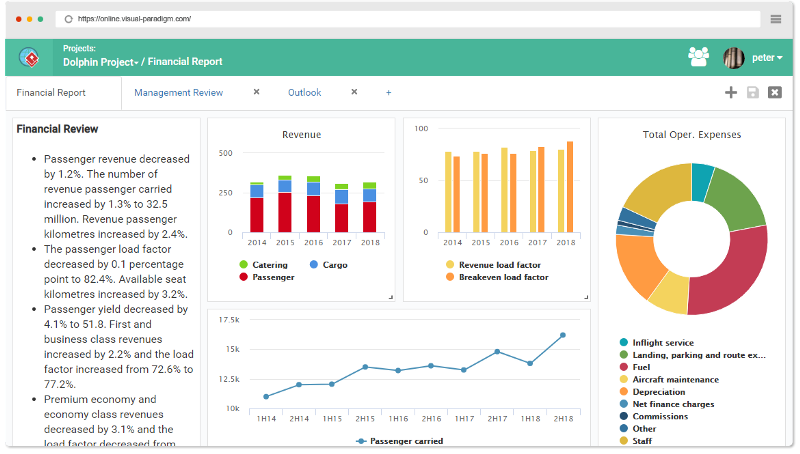
یک داشبوردمجموعهای از منابع است که برای ایجاد یک نمایش بصری یکپارچه گردآوری شده است، مانند:
- نمودار
- اینفوگرافیکها
- تصاویر
- نمودارها
- تصاویر
- و غیره.
امروز یک ابزار آنلاین رایگان به نام را معرفی میکنمویژوال پارادایم آنلاینکه ایجاد نمایش بصری فوق را در یک داشبورد رایگان و یکپارچه آسان میکند.

(مثال فوق را بهطور آنی باز و ویرایش کنید)
داشبورد فوق نمونهای برای گزارش مالی است. داشبورد ابزاری است که به شما کمک میکند دادهها را به گونهای ارائه دهید که دیگران بتوانند دادههای شما را درک کنند. شما میتوانید داشبورد خود را با نمودارها، نقشهها و نمودارها ایجاد کنید.
یک راهحل داشبورد با امتیاز بالا
ویژوال پارادایم آنلاین به شما کمک میکند دادههای خود را به بینشهای ارزشمند تجسم کنید. داشبوردها را بسازید و تحلیلهای دادهای موردی را در چند مرحله انجام دهید. دامنه وسیعی از نمودارها و گرافها برای برآورده کردن نیازهای مختلف کسبوکار در دسترس است. به همراه ویرایشگر صفحهگسترده شهودی، هر کسی میتواند دادهها را در چند دقیقه تجسم کند. بدون کدنویسی، فقط بینش.
ایجاد داشبورد آسان
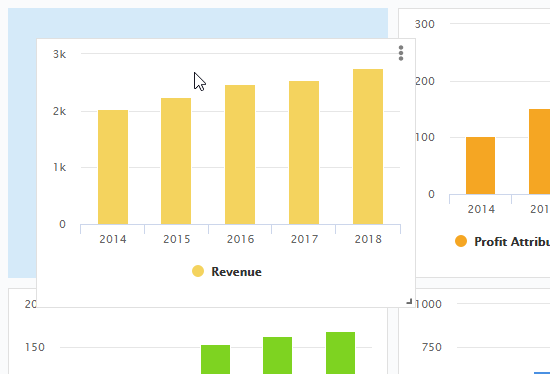
هر کسی میتواند با کشیدن و رها کردن شهودی داشبورد بسازد.
- کشیدن و رها کردن برای تغییر اندازه اجزای داشبورد. محتوا بهطور خودکار مقیاسبندی و متناسب خواهد شد.
- برای جابجایی اجزای داشبورد بکشید. اجزا بهطور خودکار برای چیدمان بهینه دوباره موقعیتیابی خواهند شد.

دامنه وسیعی از گزینههای تجسم داده
داشبورد سفارشی خود را با تجسمهای داده استاندارد مانند نمودارها، نقشهها و نمودارها جمعآوری کنید. یا یک نمودار، متن سفارشی یا تصویر را در نمودار جاسازی کنید. صدها نمودار و نمودار در دسترس است. انتخاب با شماست.

صفحات متعدد
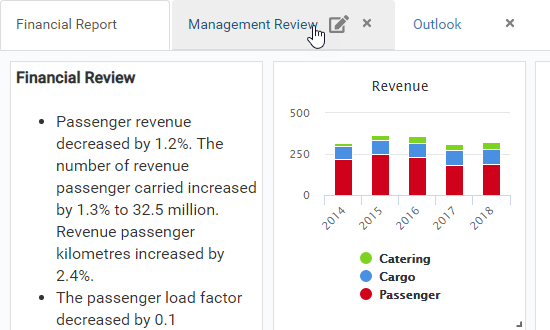
محتوای زیادی دارید؟ میخواهید دادهها را از زوایای مختلف تجسم کنید؟ میتوانید اطلاعات موجود در یک داشبورد را با تقسیم محتوا به صفحات متعدد، آسانتر درک کنید.

تنوع وسیع بصری
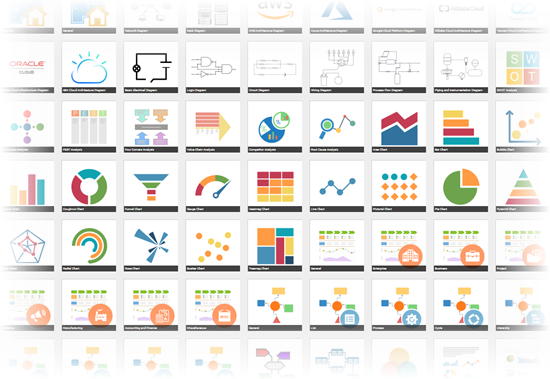
تعداد نامحدودی از نمودارها، نمودارها و سایر تصاویر را از دامنه وسیعی از انواع نمودارها ایجاد کنید. با الگوهای از پیش ساخته شده شروع کنید یا خودتان بسازید.
نمودارها
- قادر به ایجاد انواع مختلف نمودارهای تجاری، فنی و عمومی از جمله نمودارهای جریان، UML، نقشههای ذهنی، AWS و بسیاری دیگر!
تجسم داده
- دادهها را با داشبوردها و نمودارها تجسم کنید و تحلیلهای دادهای را در چند مرحله انجام دهید.
طراح نقشه فرآیند
- فرآیند، نقشه راه و ماتریس را با طراح نقشه فرآیند طراحی کنید. بیش از 40 الگو (مانند نقشه سفر مشتری) ارائه شده است.
اجزای بصری را با ویژوال پارادایم آنلاین بسازید – بیش از 1100 مثال و الگوی نمودار
This post is also available in Deutsch, English, Español, Français, Bahasa Indonesia, 日本語, Polski, Portuguese, Ру́сский, Việt Nam, 简体中文 and 繁體中文.


