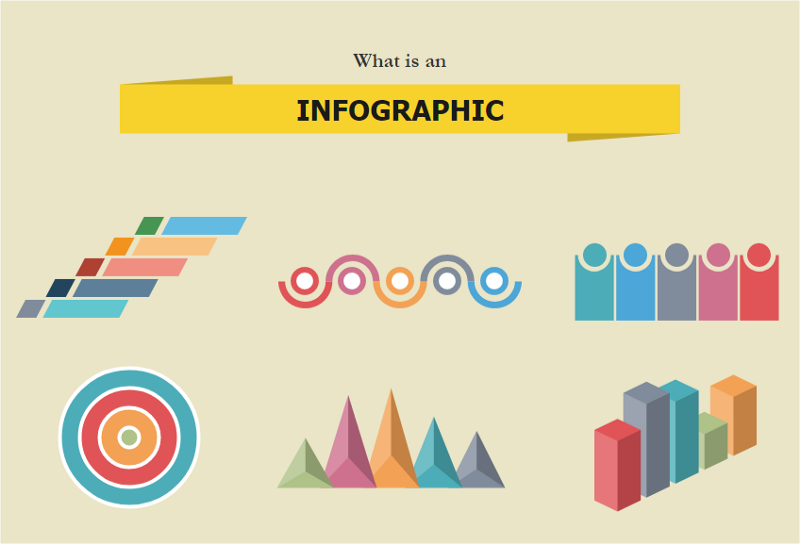
اینفوگرافیکهابه نمای بصری دادهها، اطلاعات یا دانش اشاره دارد. اینفوگرافیکها به عنوان ابزاری قدرتمند استفاده میشوند که به مردم اجازه میدهد اطلاعات را به راحتی از طریق استفاده از دادههای بصری، نمودارها و آمار هضم کنند.

از طریق استفاده صحیح از رنگها، تناسبات و فضای منفی، اطلاعات میتواند به گرافیکهای به یاد ماندنی، جلب توجه و حتی متقاعدکننده تبدیل شود. به سادگی، اینفوگرافیک به معنای استفاده از روشهای بصری مانند نمودارها یا چارتها برای هدایت همه به دانستن آنچه شما میخواهید بیان کنید، است.
چرا اینفوگرافیکها؟
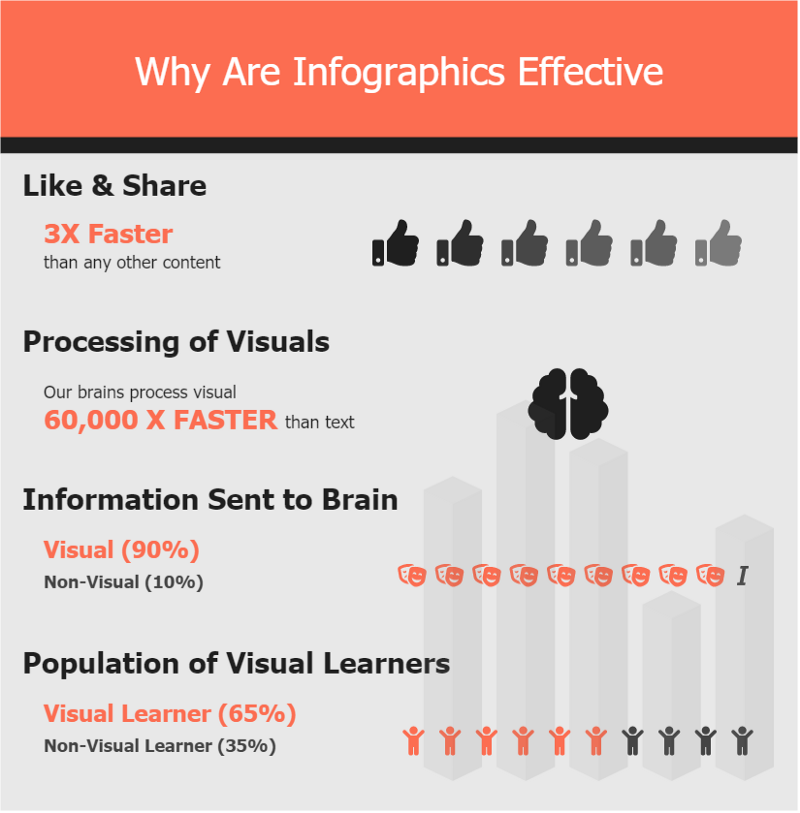
اینفوگرافیکها برای جمعآوری حجم زیادی از دادهها در یک فرمت آسان برای پیگیری که هم زیبا و هم متقاعدکننده است، عالی هستند. حجم جستجو برای اینفوگرافیکها به طور قابل توجهی افزایش یافته است. نه تنها اینفوگرافیکها از نظر بصری جذاب و تماشایی هستند، بلکه همچنین ابزاری بسیار مؤثر برای سئو و بازاریابی هستند.

چالشها برای ایجاد اینفوگرافیکها
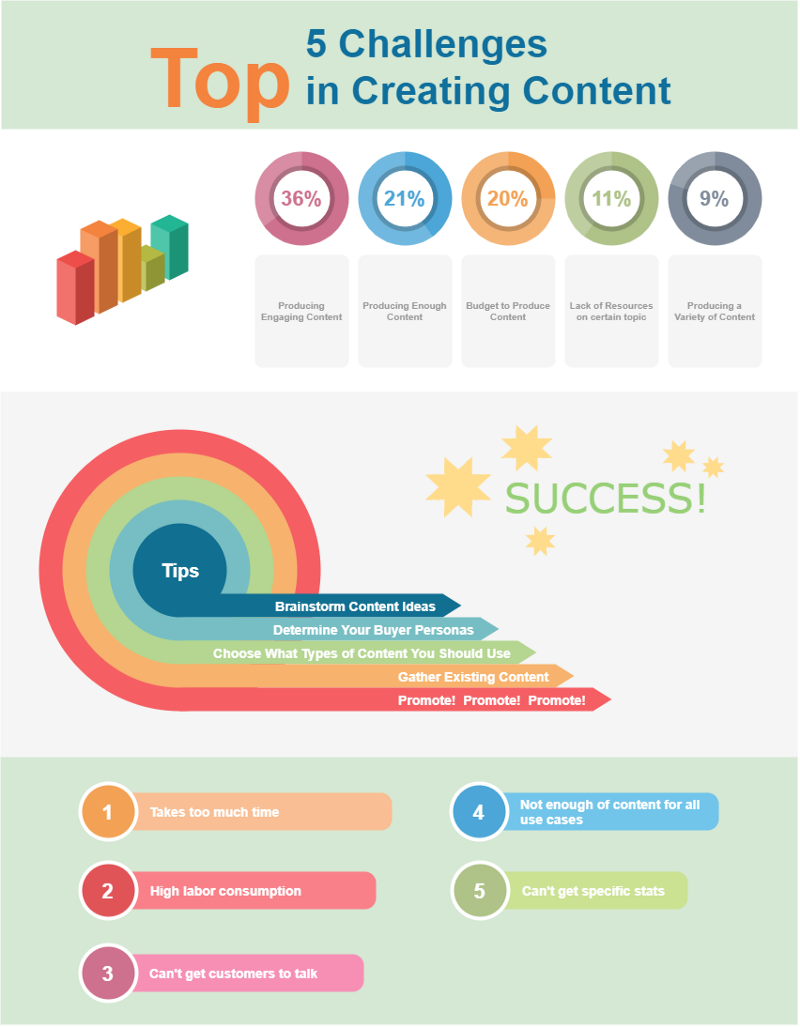
دلایل زیادی وجود دارد که چرا ما در ایجاد محتوای جدید شکست خوردیم. با نگاهی به این اینفوگرافیک میتوانیم دلایل ممکن را ببینیم که ممکن است به عنوان چالشی در هنگام ایجاد محتوا در نظر گرفته شوند. همچنین نکاتی وجود دارد که میتوانیم برای غلبه بر این چالشها و ایجاد محتوای غنی برای نیازهای خود دنبال کنیم.

چرا ابزار خوب اینفوگرافیک میتواند کمک کند؟
شما ممکن است با چالشهایی در ایجاد اینفوگرافیکها مواجه شوید. یک ابزار خوب میتواند به شما کمک کند تا کل فرآیند را سادهتر کنید. یک گشت سریع بزنید تا ببینید چرا کل فرآیند میتواند زمانبر و خستهکننده باشد و راهحل آن چیست.
ایجاد اینفوگرافیکها در ۳ مرحله ساده
Visual Paradigm InfoArt به همه کمک میکند تا حجم زیادی از اطلاعات را به بصریهای آسان برای خواندن تبدیل کنند. شما شگفتزده خواهید شد که چقدر میتوانید با آن کار کنید، حتی اگر شما یک مبتدی بدون مهارت طراحی باشید.
بیایید ۳ مرحله اصلی برای ایجاد یک اینفوگرافیک را مرور کنیم:
مرحله ۱: انتخاب الگو

- از میان صدها الگوی طراحی شده به صورت حرفهای که ۹۰٪ کار را برای شما انجام دادهاند، انتخاب کنید.
مرحله ۲: آن را شخصیسازی کنید

- آن را با مخزن ما از کلیپآرتها، آیکونها، عکسهای استوک، نمودارها و نقشهها سفارشی کنید.
مرحله ۳: به اشتراک بگذارید

- طراحی خود را در فرمت گرافیکی اصلی دانلود کنید، آن را به اشتراک بگذارید و در یک صفحه وب جاسازی کنید.
چرا Visual Paradigm InfoArt میتواند کمک کند؟
با استفاده از Visual Paradigm InfoArtشما میتوانید به راحتی اینفوگرافیکهای تأثیرگذار، بروشورها، پوسترها، رزومهها و کاتالوگها را ایجاد کنید. مانند یک حرفهای طراحی کنید، با راهحل طراحی بصری همهکاره InfoART. اکنون میتوانید طراحیهای خود را با تنوع زیادی از عکسها، تصاویر و کلیپآرتها زنده کنید. گرافیکهای مبتنی بر وکتور آنها را در هر اندازهای زیبا نشان میدهند.
در اینجا برخی از مزایای Visual Paradigm InfoArt آورده شده است و توضیح میدهد که چگونه میتوانیم اینفوگرافیکهای حرفهای را سریعتر و بهتر با InfoArt ایجاد کنیم؟
- ویژگیها: مؤلفه طرح و ویرایشگر کشیدن و رها کردن، ایجاد و ویرایش مجدد هر طراحی را سریع میکند.
- منابع درونابزاری: در پیدا کردن عکسها یا کلیپآرتها زمان صرفهجویی کنید زیرا همه چیزهایی که نیاز دارید در InfoART گنجانده شده است. به سادگی یک جستجو انجام دهید تا آن را پیدا کنید.

- الگوها: شما نیازی به صرف زمان برای طراحی ندارید زیرا مجموعهای غنی از الگوهای طراحی شده به صورت حرفهای در دسترس است.

چگونه در چند دقیقه اینفوگرافیک چشمگیری ایجاد کنیم؟
ایجاد پوستر اینفوگرافیک با Visual Paradigm InfoArt بسیار آسان است! شما نیز میتوانید یک طراح حرفهای باشید! یک گشت سریع بزنید تا یاد بگیرید چگونه با حداقل تلاش آثار هنری خیرهکنندهای ایجاد کنید:
نتیجهگیری
اگرچه اینفوگرافیکها به نظر میرسد که گرافیکی پیچیده و به صورت حرفهای ساخته شدهاند، شما میتوانید به راحتی آنها را خودتان بسازید و با استفاده از Visual Paradigm InfoArt. شما منابع بیشتری برای ساخت اینفوگرافیکهای خود خواهید یافت، مانند الگوها، نمونهها، نمودارها و منابع مرتبط که در سایت برای ایجاد آسان اینفوگرافیکهای حرفهای با هزینههای اشتراک فوقالعاده پایین در دسترس هستند!
منابع:
This post is also available in Deutsch, English, Español, Français, Bahasa Indonesia, 日本語, Polski, Portuguese, Ру́сский, Việt Nam, 简体中文 and 繁體中文.


