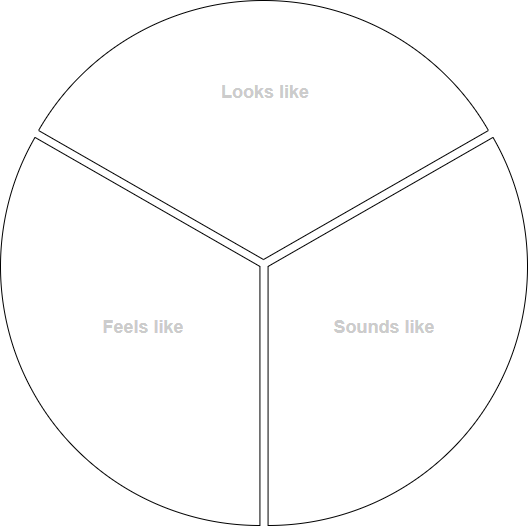
Y Chart یک سازماندهنده گرافیکی سهقسمتی است که طوفان فکری یک موضوع را در سه بعد سازماندهی میکند:
- این چگونه به نظر میرسد؟
- این چه احساسی دارد؟
- این چه صدایی دارد؟
به طور سنتی، معلمان سالهاست که از Y Chart به عنوان یک ابزار مؤثر در کلاس درس استفاده میکنند. این به عنوان یک ابزار تحلیلی عمل میکند زیرا دانشآموزان و معلمان تلاش میکنند تا بیشتر و بیشتر درباره یک موضوع با استفاده از رویکرد حسی که این موضوع چگونه به نظر میرسد، چه صدایی دارد و چه احساسی دارد، کشف کنند.

این الگوی Y Chart را ویرایش کنید
T-Chart معمولاً به عنوان یک مرحله پیشمحصول یا یک تمرین طوفان فکری کامل میشود که از آن میتوان شروع به ایجاد محصولاتی مانند گزارش مکتوب، نقشههای حبابی، پاورپوینتها و مصاحبهها کرد. این فرآیند شرکتکنندگان را تشویق میکند تا تفکر انتقادی داشته باشند و رفتارهای مناسب برای دستیابی به این هدف را شناسایی کنند.
مراحل ایجاد یک Y-Chart چیست؟
- موضوع/مهارت اجتماعی که میخواهید با دانشآموزان خود بررسی کنید را تعیین کنید
- دانشآموزان را به گروههای کوچک سازماندهی کنید و وظایفی مانند ثبتکننده، گزارشدهنده، نگهدار زمان و سازماندهنده به هر عضو گروه اختصاص دهید
- اعضای تیم یک Y Chart با عنوان «به نظر میرسد»، «صدا میدهد» و «احساس میشود» در هر یک از سومهای چارت ایجاد میکنند
- از تیم بخواهید تا در یک زمان مشخص به اندازه کافی ایدهها را طوفان فکری کنند
- هر گروه گزارش میدهد
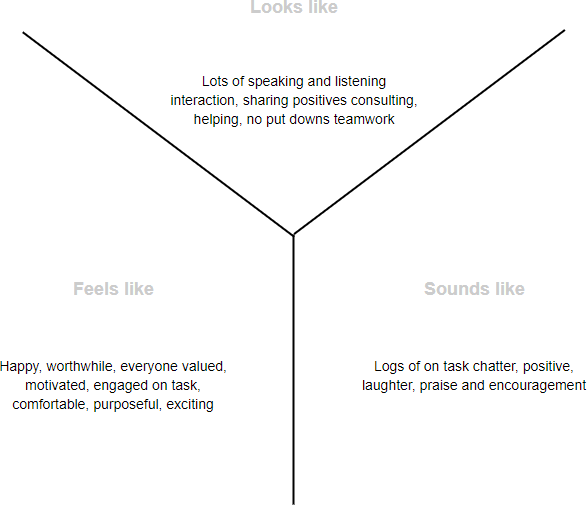
مثال — یک جلسه تشکیل تیم چگونه به نظر میرسد، چه احساسی دارد و چه صدایی دارد.

شما میتوانید به صورت رایگان از طریق Visual Paradise Online Y Chart ایجاد کنید، که میتواند Y Chart و الگوهای مختلف چارت فنی و تجاری ایجاد کند. همچنین از کار از راه دور، کنفرانسهای آنلاین و وبینارها پشتیبانی میکند و امکانات همکاری غنی در زمان واقعی را فراهم میکند. این برای مقاصد آموزشی یا دانشگاهی رایگان است.
This post is also available in Deutsch, English, Español, Français, Bahasa Indonesia, 日本語, Polski, Portuguese, Ру́сский, Việt Nam, 简体中文 and 繁體中文.


