Software engineering focuses on the development of software products. it is a systematic, disciplined, and quantifiable approach to software development, operation, and maintenance; That is, engineering to software applications.
Continue reading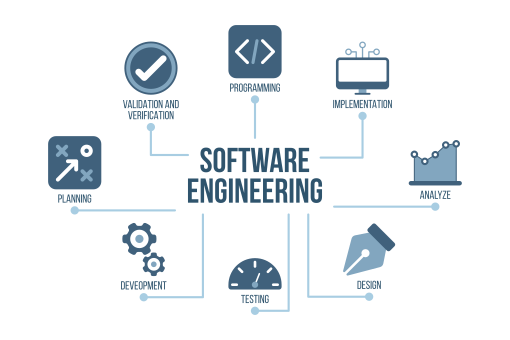
یادگیری یک چیز جدید هر روز


Software engineering focuses on the development of software products. it is a systematic, disciplined, and quantifiable approach to software development, operation, and maintenance; That is, engineering to software applications.
Continue reading
Strategic analysis is the core step of the strategic planning cycle. Every strategist should have a set of analytical model tools to deal with. However, there are many techniques and tools available for strategic analysis. If you search Google on the Internet, you will find many options available.
Continue reading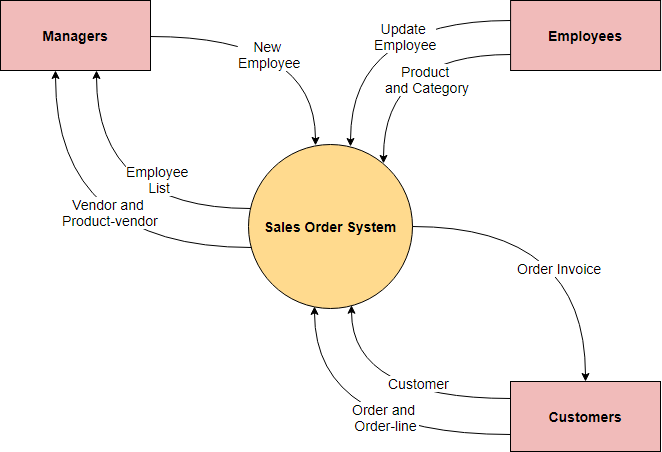
The context diagram shows the system considered as a single high-level process, and then shows the relationship of the system to other external entities (systems, organizational groups, external data stores, and so on). Another name for a context diagram is a context-level data flow graph or 0-level DFD.
Continue reading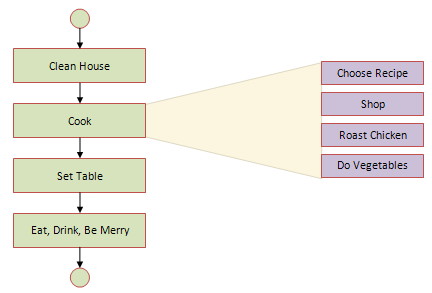
One of the effective way to solve a complex problem is to break it down into simpler sub-problems. You start by breaking down the whole task into simpler parts. Step-by-step refinement is essentially a decomposition of the system to gain insight into the subsystems that make up the system, known as the top-down decomposition method.
Continue reading
A Scatter Plot (also known as a scatter Chart, and Correlation Plot) is a tool for analyzing the relationship between two variables, used to determine the degree of correlation between two variables. One variable is plotted on the horizontal axis and the other on the vertical axis. The pattern of their intersection points graphically displays the relational pattern. It is one of the Seven Basic Tools of Quality.
Continue reading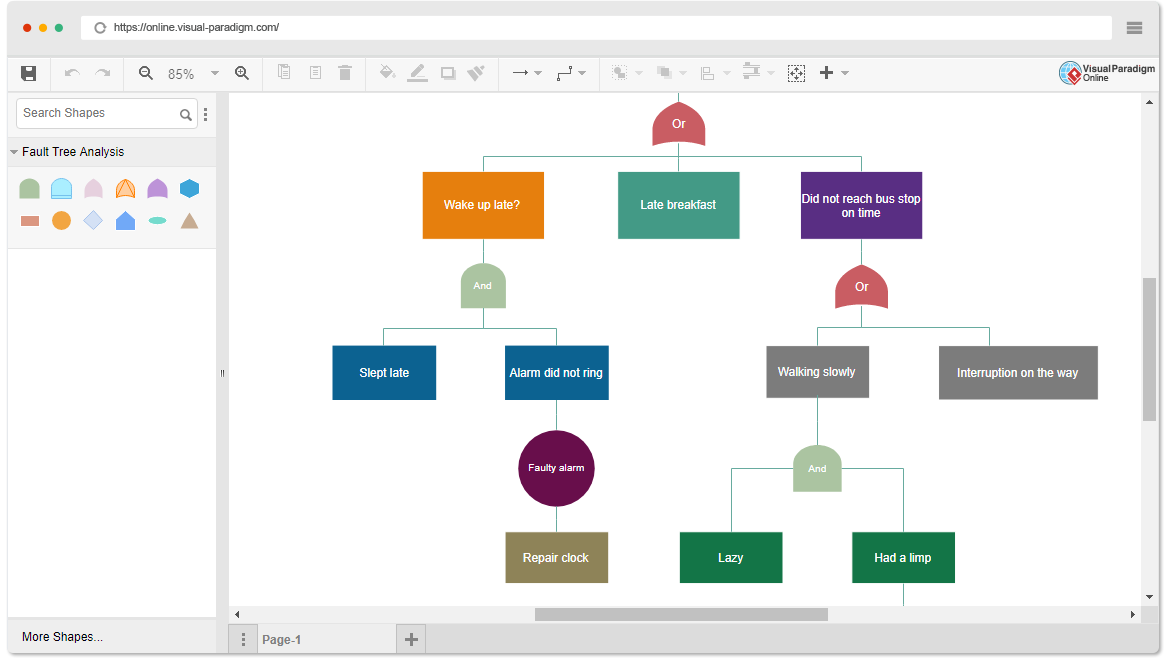
Fault tree analysis (FTA) is a top-down deductive fault analysis in which Boolean logic is used in conjunction with a series of low-level events to analyze the unexpected states of the system. This analysis method is primarily used in safety engineering and reliability engineering to understand how systems fail, determine the best way to reduce risk, and determine (or feel) the event rate of safety incidents or specific system-level (functional) failures.
Continue reading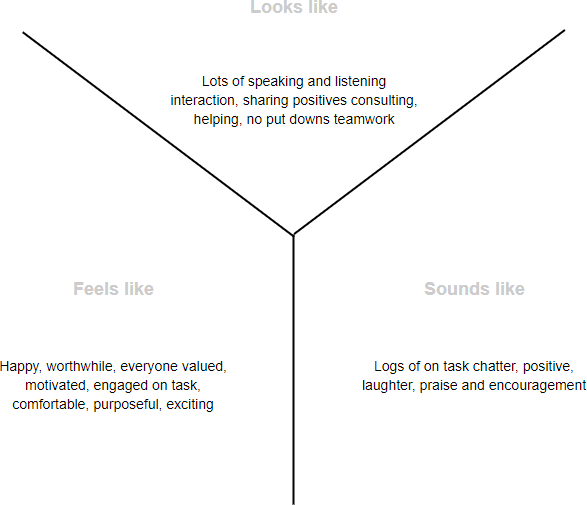
Both T-charts and Y-charts help to graphically organize and record ideas, feelings and information, while identifying and focusing on what teachers / students already know, understand, value and can do. It enables students / teachers / teachers to compare and contrast ideas, feelings and information in various context.
Continue reading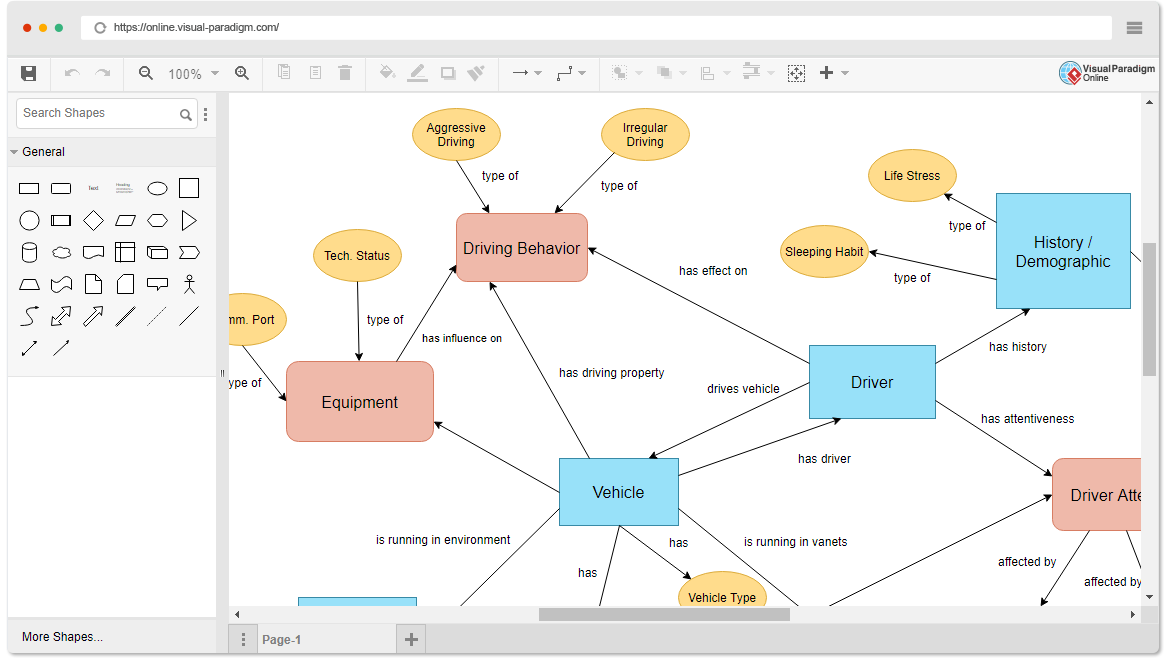
An Interrelationship Diagram is a visual display that maps out the cause and effect links among complex, multivariable problems or desired outcomes. With the linked connections, you can better analyze the cause-and-effect relationships that exist among all factors of a complex situation
Continue reading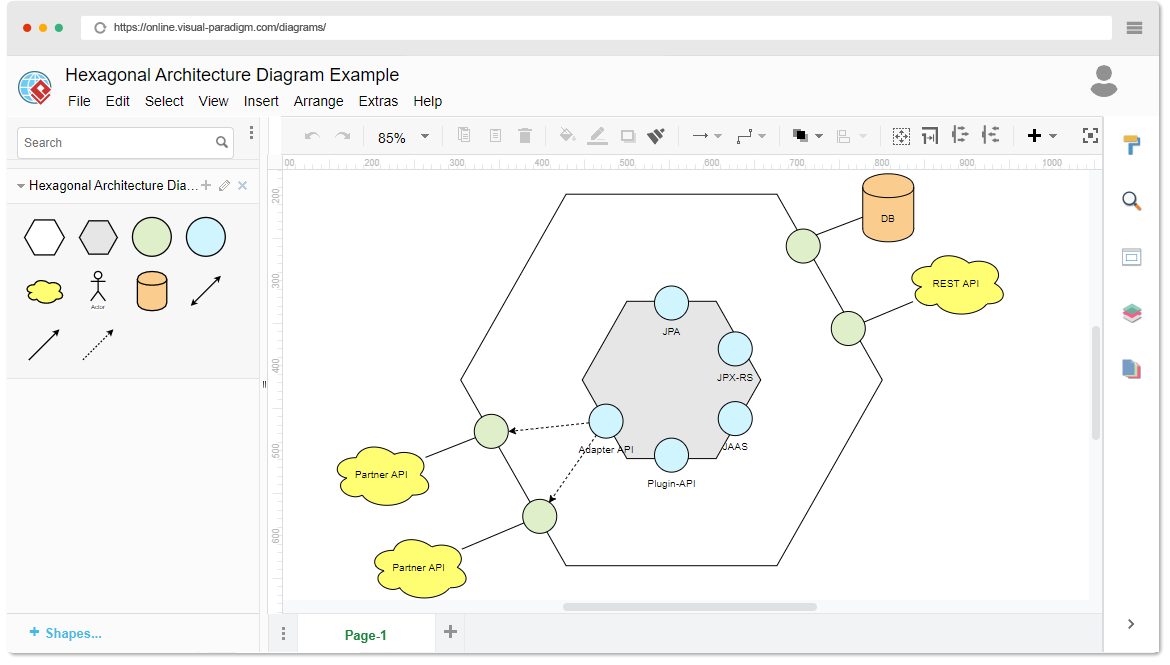
Hexagonal architecture diagram is an architectural pattern used in software design aiming at creating loosely coupled application components. This approach is an alternative to the traditional layered architecture. It is one of the many forms of DDD (Domain Driven Design Architecture).
Continue reading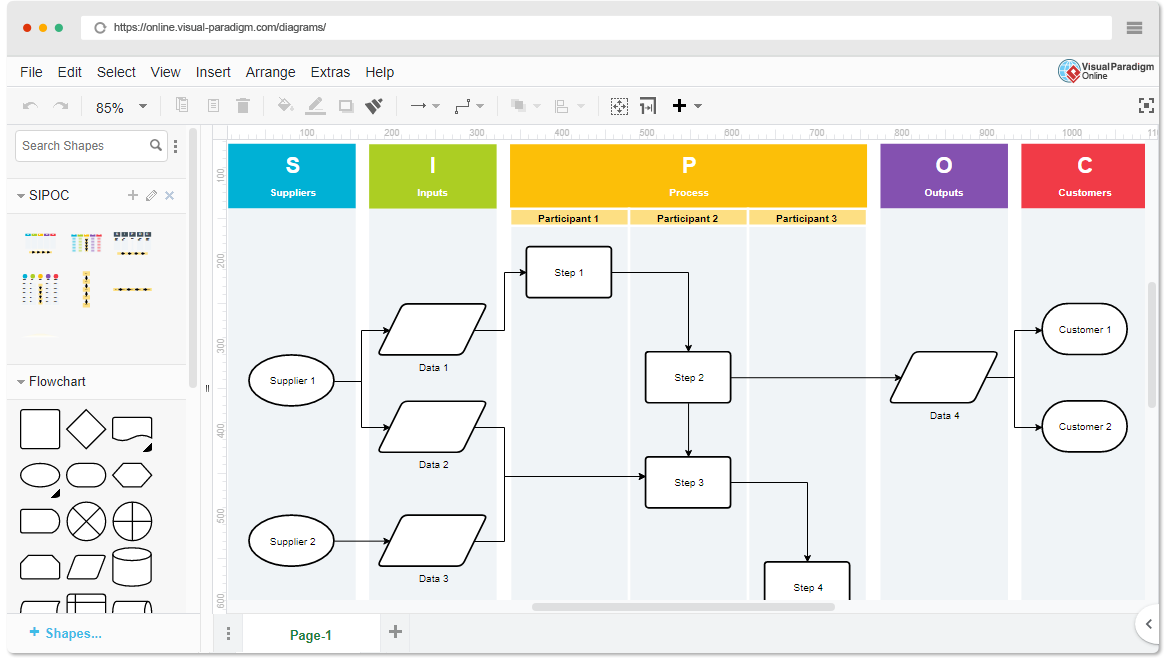
The acronym SIPOC stands for Suppliers, Inputs, Process, Outputs, and Customer. Using information from these five areas creates a process map that gives a high-level overview of a Six Sigma project. To create a SIPOC diagram, you have to specify the five main activities of the process and identify the potential suppliers, inputs, outputs, and customers.
Continue reading