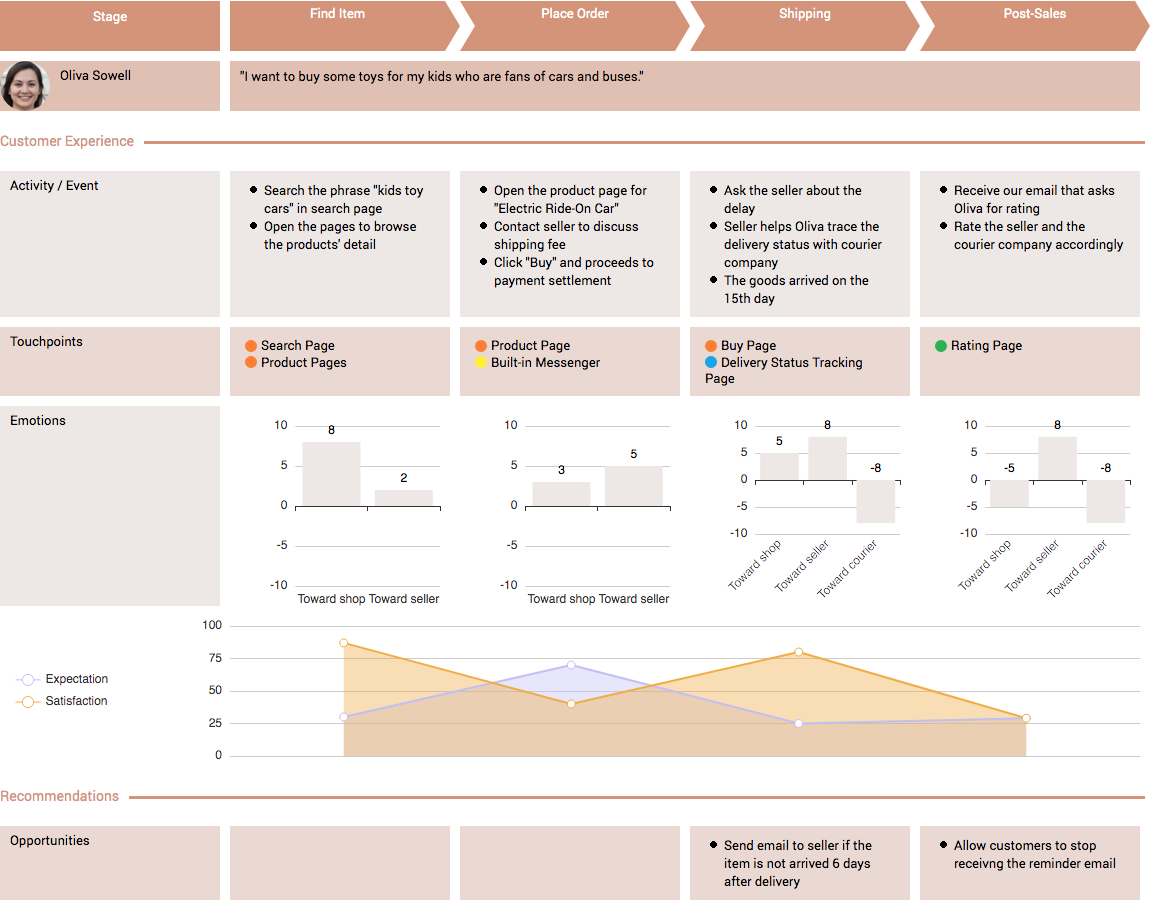
The customer journey map can be used to describe the story of a certain role customer in a specific scenario. Including customers from the first contact with the product, touching the various touch points of the product, and ending the use of the product at the end.
Continue readingبرچسب: cn-done
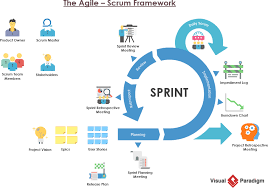
What is SCRUM?
Scrum originated in software development projects, but it is suitable for any complex or innovative projects. Scrum has been used to develop software, hardware, embedded software, interactive function networks, autonomous driving, schools, governments, markets, management organizations and operations, and almost everything we (as individuals and groups) use in daily life.
Continue readingWhat are the changes in Scrum Guide from 2017 to 2020?
The 2020 Scrum Guide contains numerous updates and changes that there are seven major changes from the 2017 edition to the 2020 edition
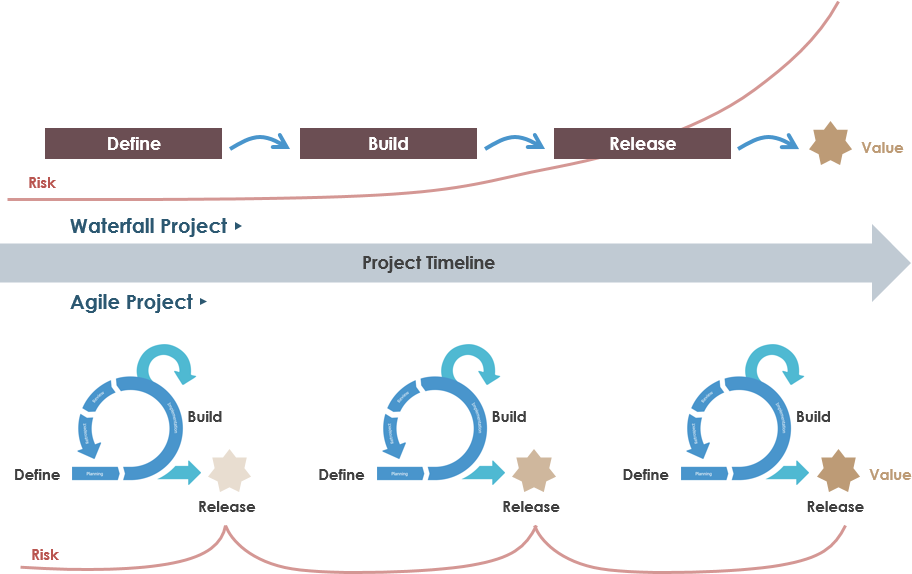
Continue readingPhilosophy of Agile Development
Agile development is a human-centric, iterative, and gradual development method. In agile development, the construction of a software project is divided into multiple sub-projects, and the results of each sub-project have been tested and have the characteristics of integration and operation. In other words, a large project is divided into multiple small projects that are interrelated but can also be run independently, and completed separately. During this process, the software is always in a usable state.
Continue readingHow to create a very compelling infographic for your presentation
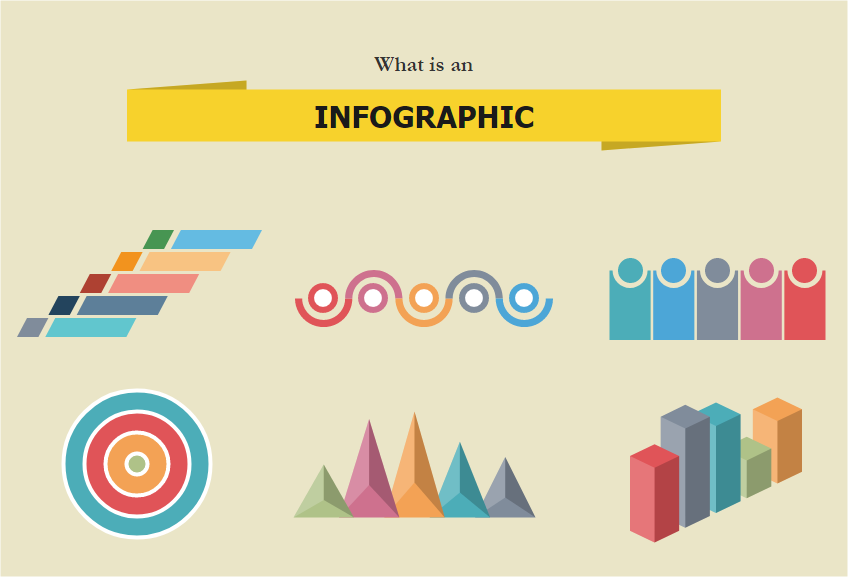
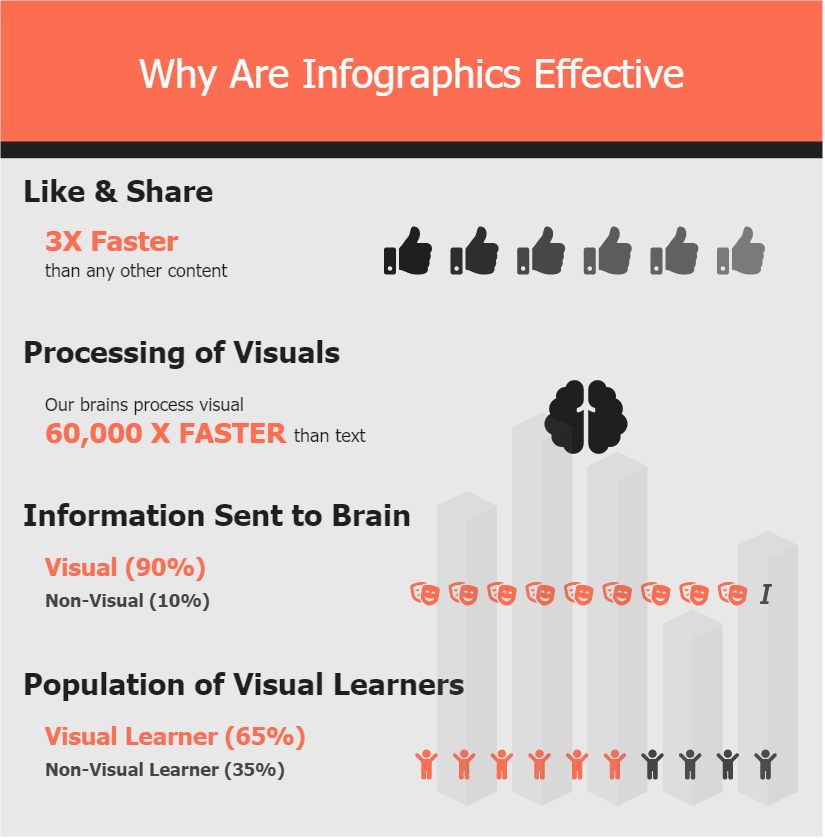
Everyday maps, MRT stations, bus stops, data graphs in newspapers, and charts in Excel are all infographics. The purpose is to visualize data to help readers quickly understand and enjoy reading data. If any company, a salesman, or an advertising agency were to express their sales performance or performance, the following traditional chart would be boring, or lack the contrast, and would not represent the characteristics of the industry.
Continue readingInfographic for Digit Marketing
Digital marketing, also known as Internet marketing, is the use of the Internet and other digital communications to promote products and communicate with potential customers. As a marketing pipeline, it includes not only Facebook, Google ads, YouTube, other social media and web-based banner ads, but also text and multimedia communications. Infographics are a hybrid of images and text that allows you to quickly and creatively describe complex information to your target audience. This is one of the most effective techniques that will significantly increase your website traffic, strengthen your domain name authority, and improve your SEO.
Continue reading6 tips on restaurant menu design! Double your Revenue
The importance of good menu design to a restaurant is self-evident. It can not only significantly increase the profit of the restaurant, but also create imaginative space for customers by using rich graphic information, and help the restaurant attract countless repeat customers. Now you can create professional infographics, flyers and marketing visuals with Visual Paradigm Online in minutes, even if you’re not a graphic designer.
Continue readingFault tree analysis (FTA) — Secret weapon for root cause analysis
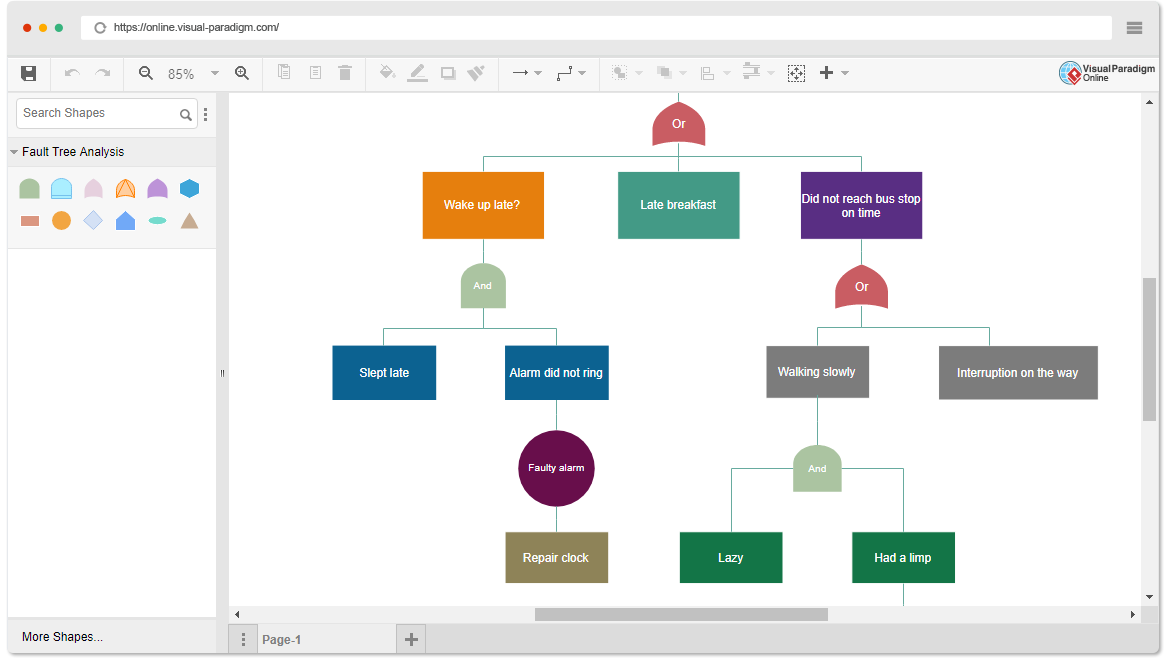
Fault tree analysis is one of the most commonly used methods in system reliability analysis. It is a process of system design or improvement by analyzing various factors that may lead to system failure, including hardware, software, environment, human factors, etc. By drawing the fault tree, we can determine the possible combinations of modes and the probability of the cause of the system failure. The failure probability of the system is calculated and the corresponding measures are taken.
Continue readingThe Best Free Tools to Create Professional Infographics
If a picture is worth a thousand words, how much is an infographic worth? Infographics have both text and pictures, so they represent the best of both worlds. If you don’t have design skills, how can you collect research and data into an attractive infographic? Fortunately, there are a good free infographic design tool that can help you create fascinating professional infographics. Whether it is to create social media infographics for your website or for professional presentations, you can use a variety of high-quality tools to make beautiful infographics.
Continue readingDesign professional isometric illustration
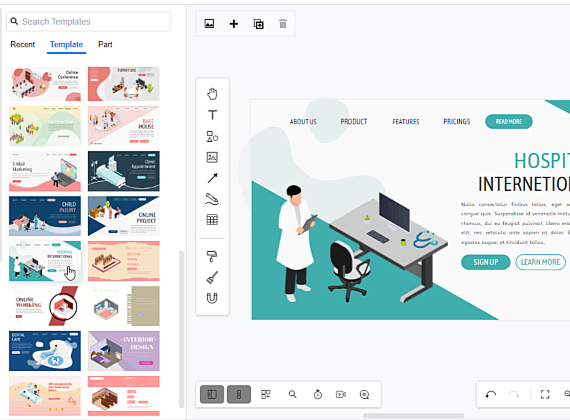
Like social media, isometric design allows you to have more perspectives on the subject. Isometric technology also allows you to display more details with less complexity. With the ability to display 3D space, it can open corners and gaps that were previously unusable. Give the design more space to accommodate your creativity. They can see the sides and top of the design and let the audience know more. Create eye-catching printable isometric diagrams. Personalize it for free to suit your brand and event, and the product or service looks great in 3D.
Continue reading