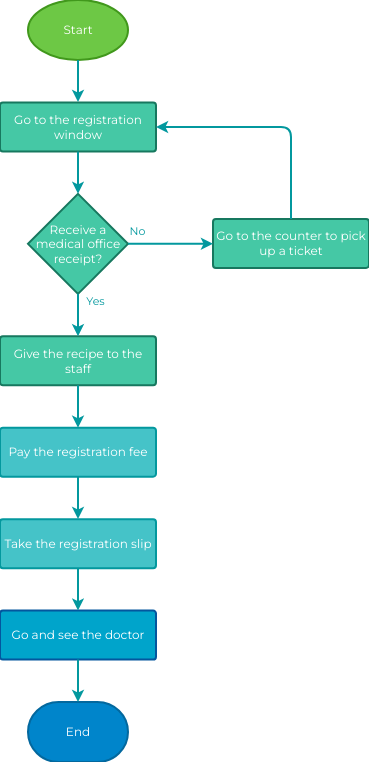
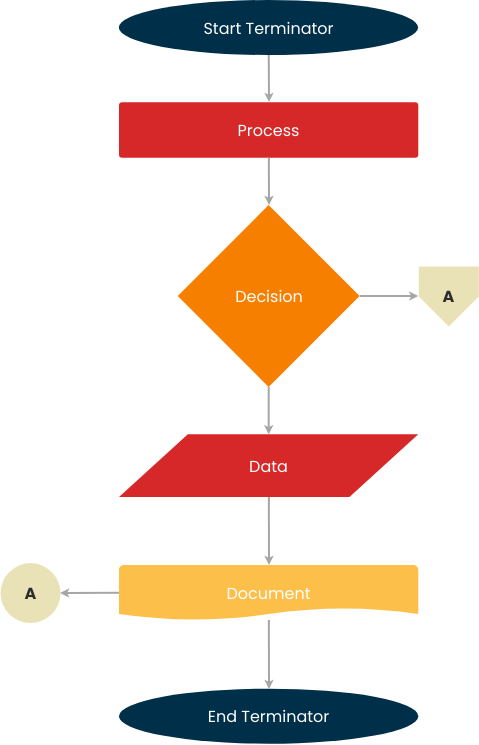
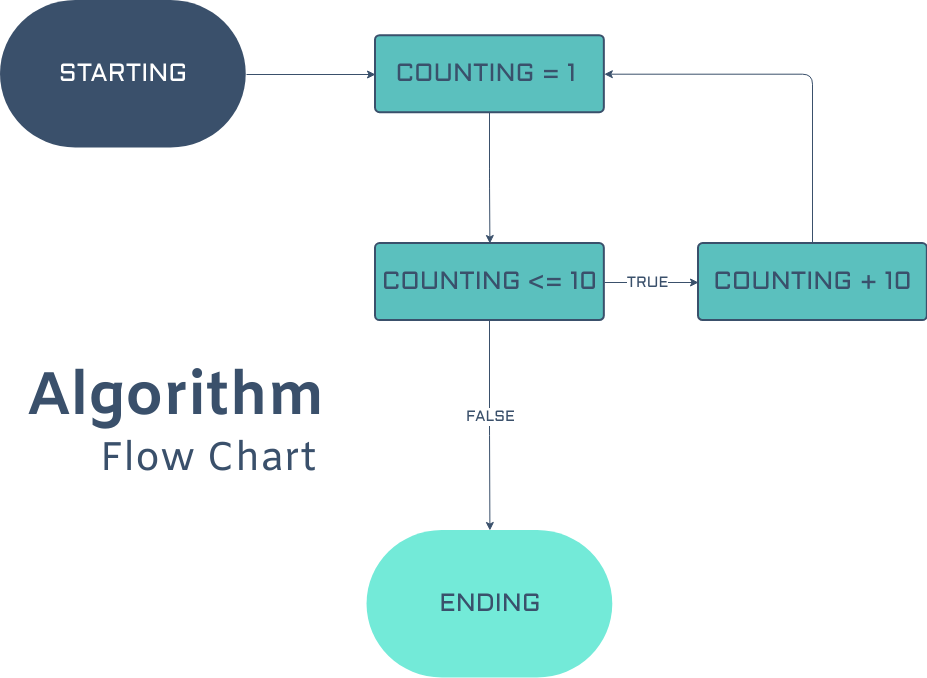
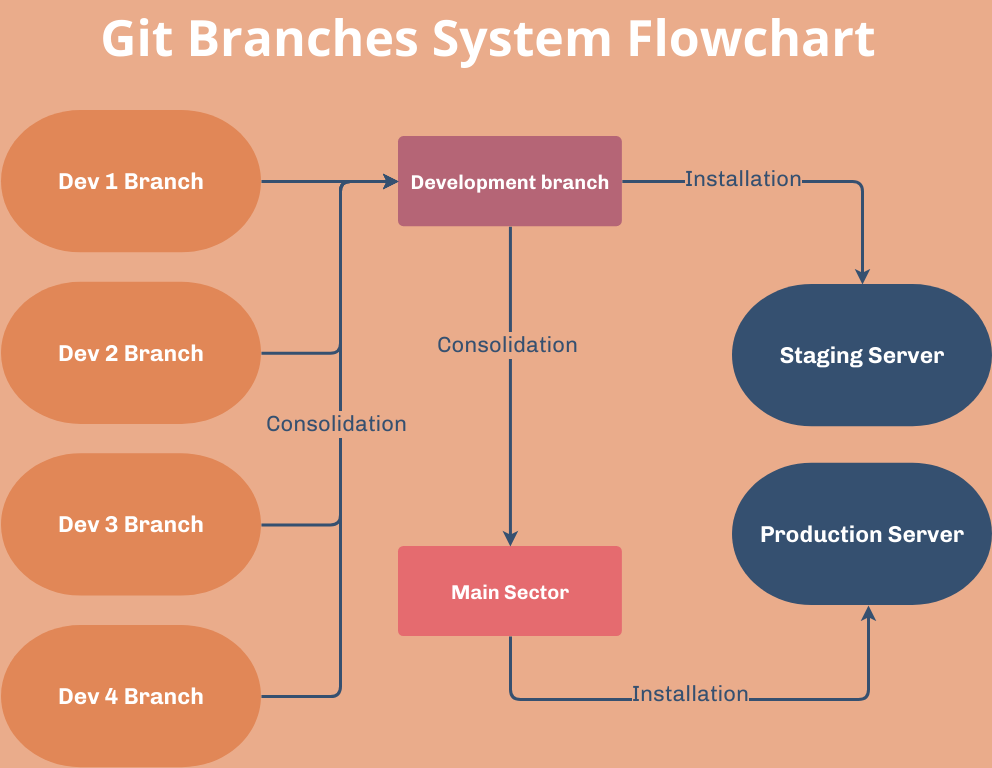
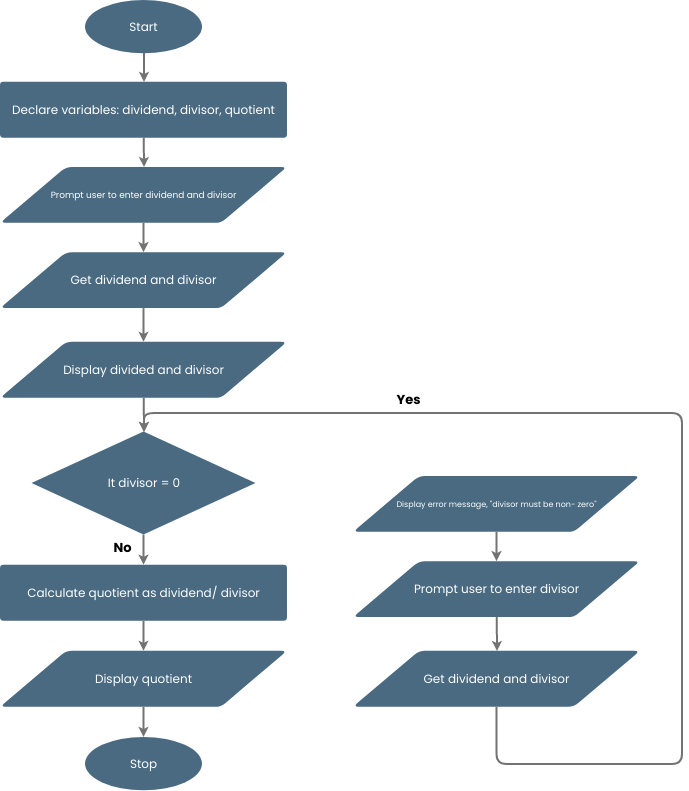
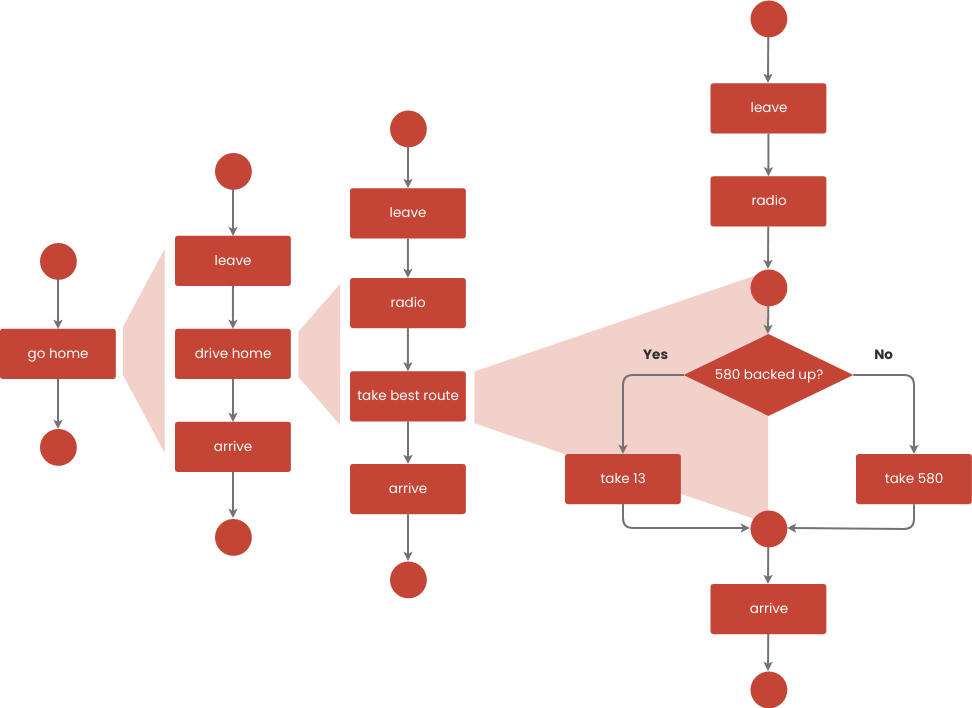
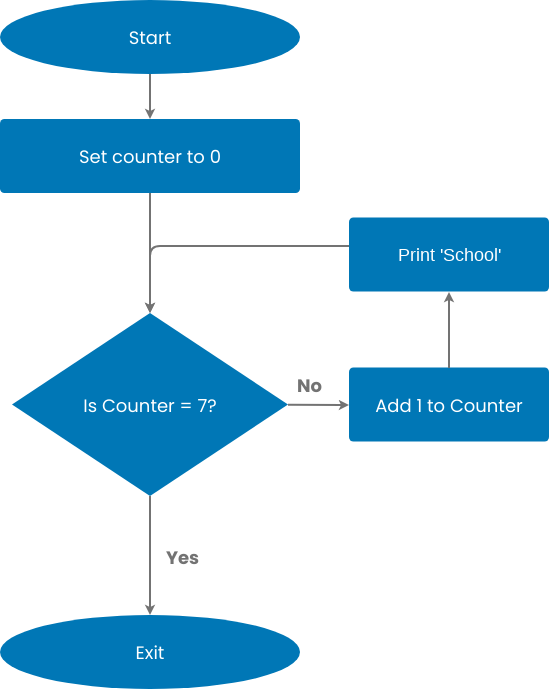
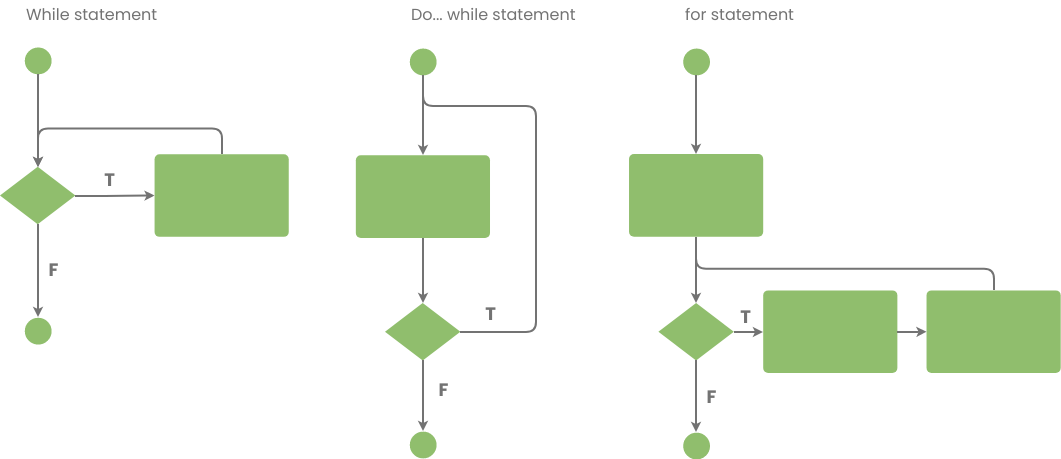
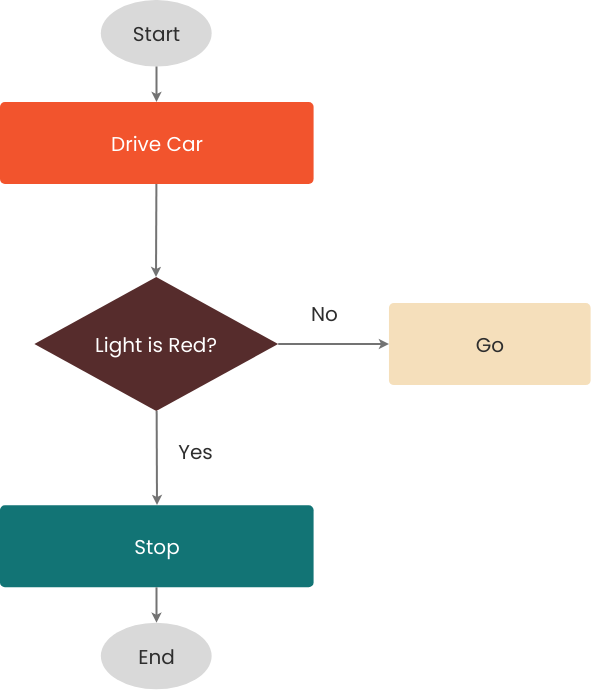
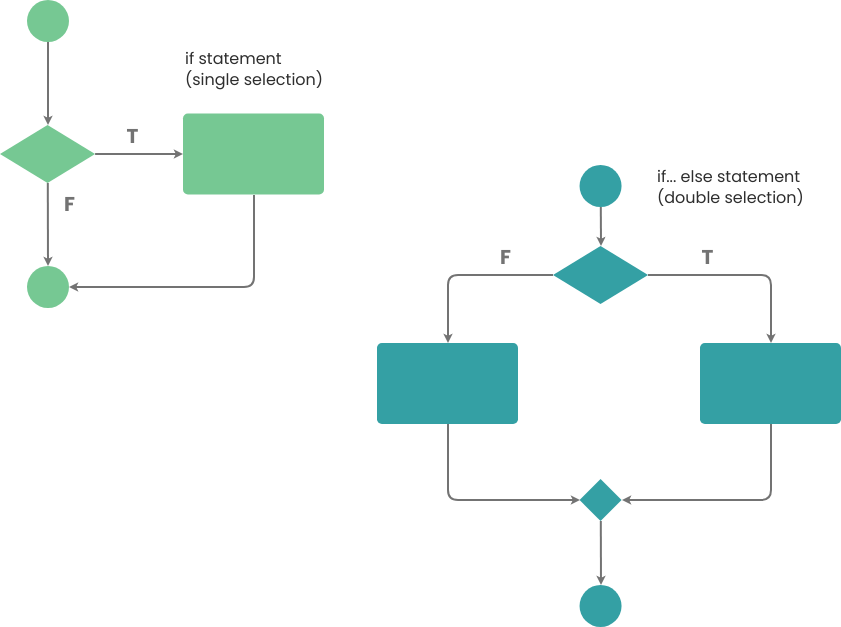
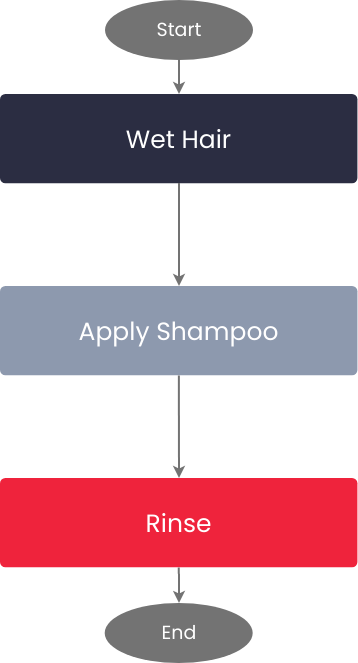
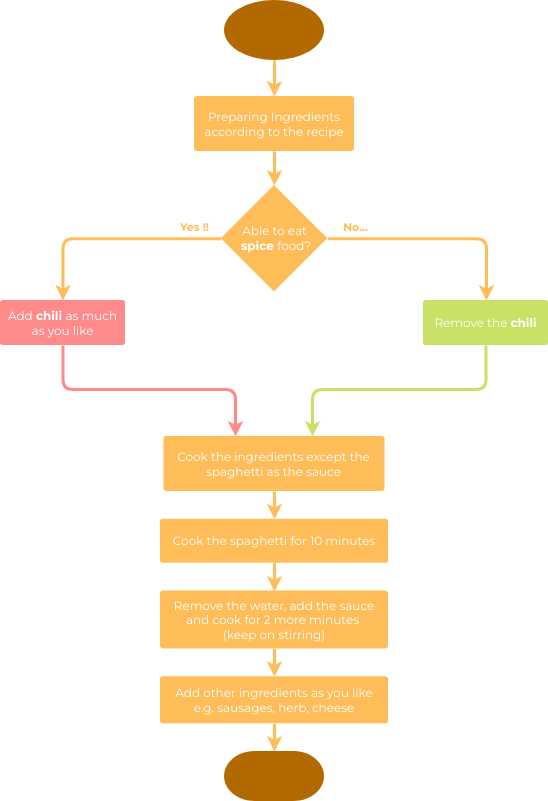
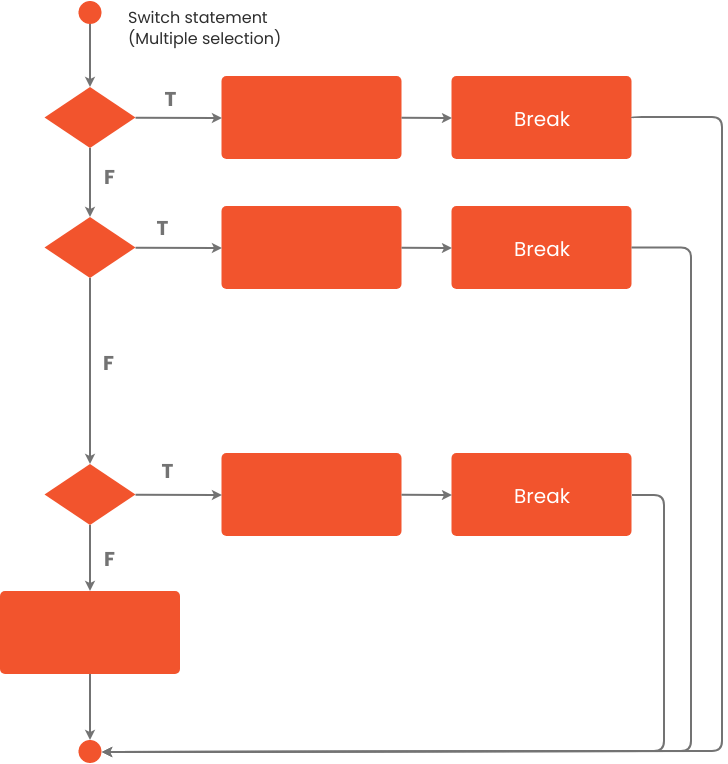
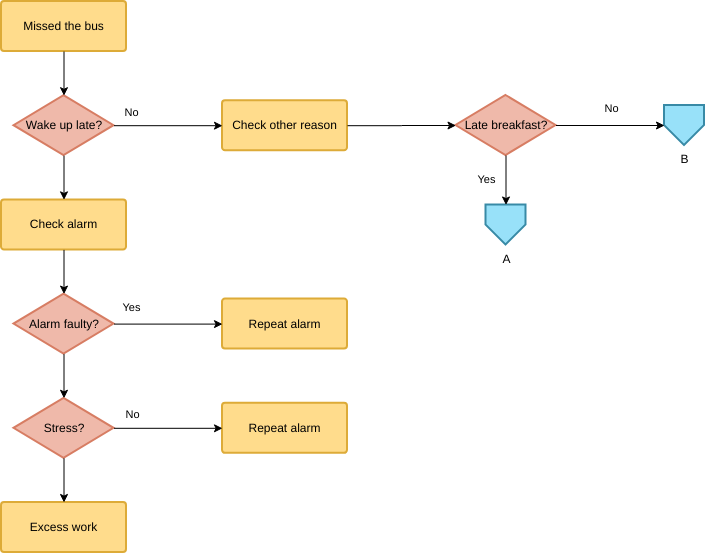
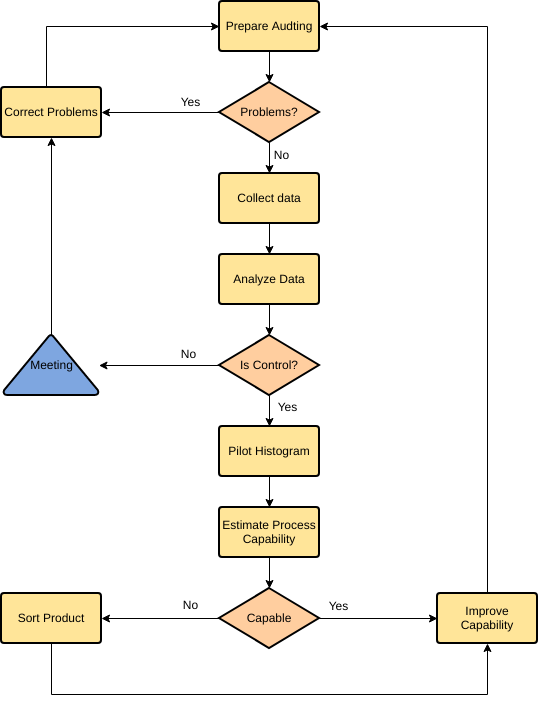
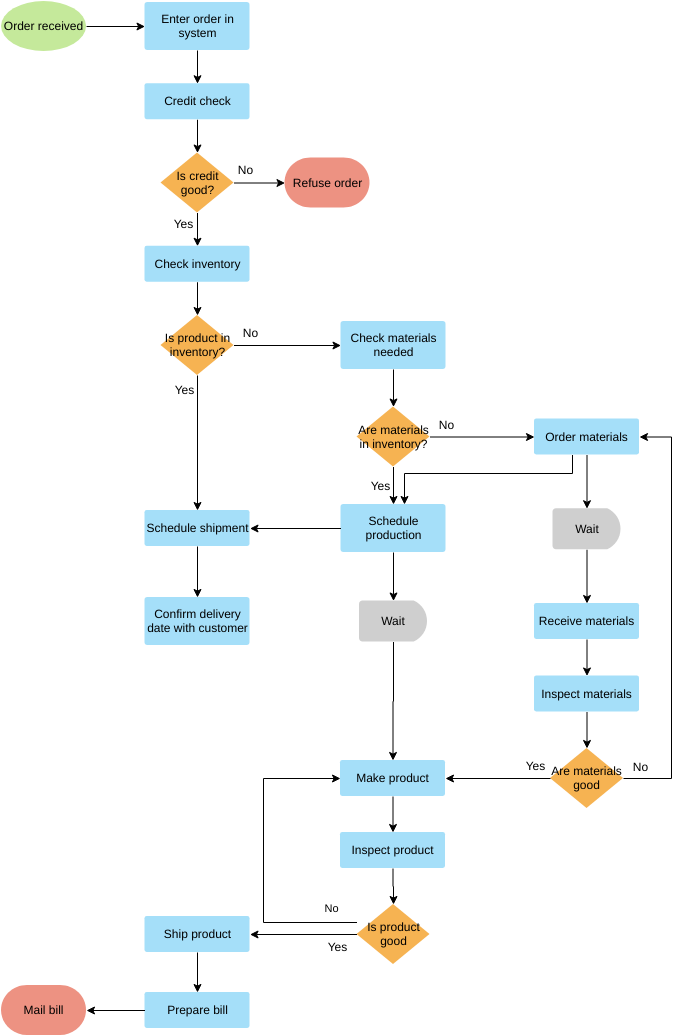
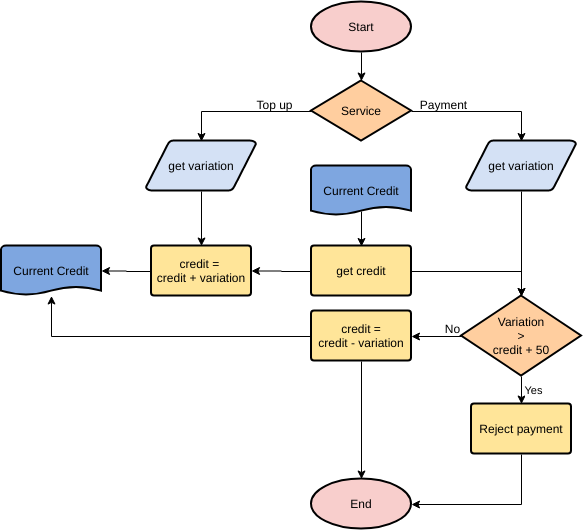
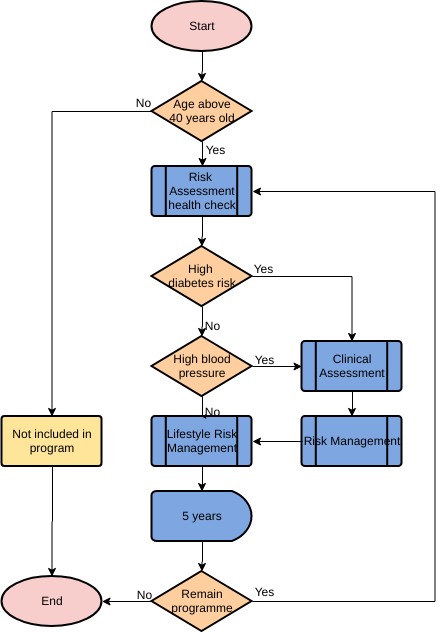
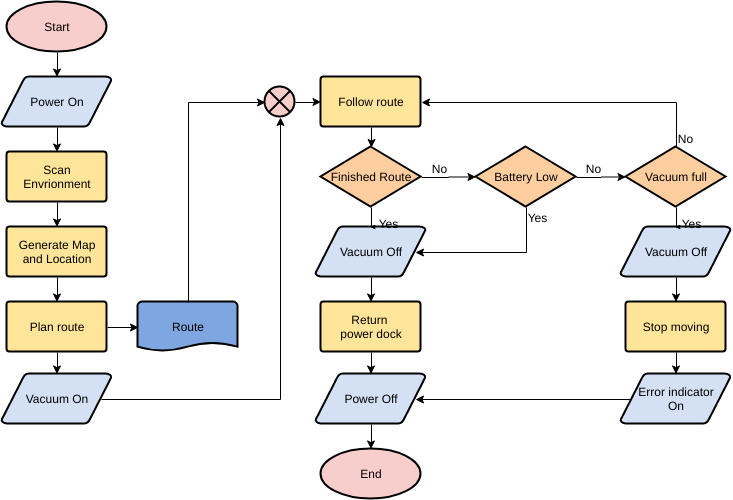
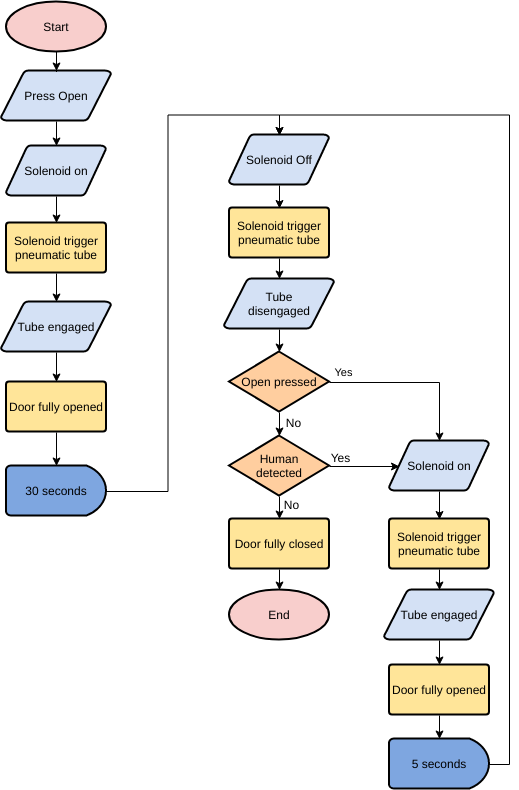
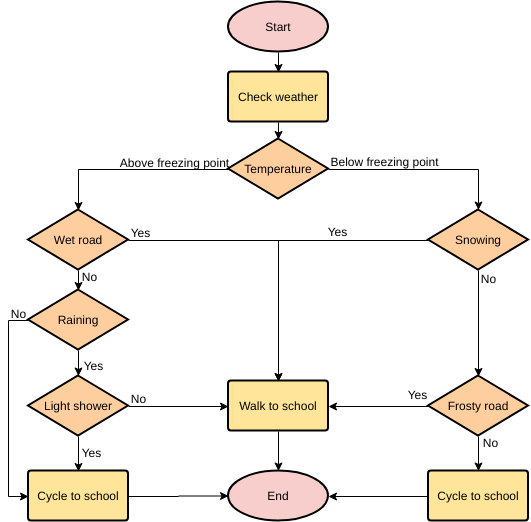
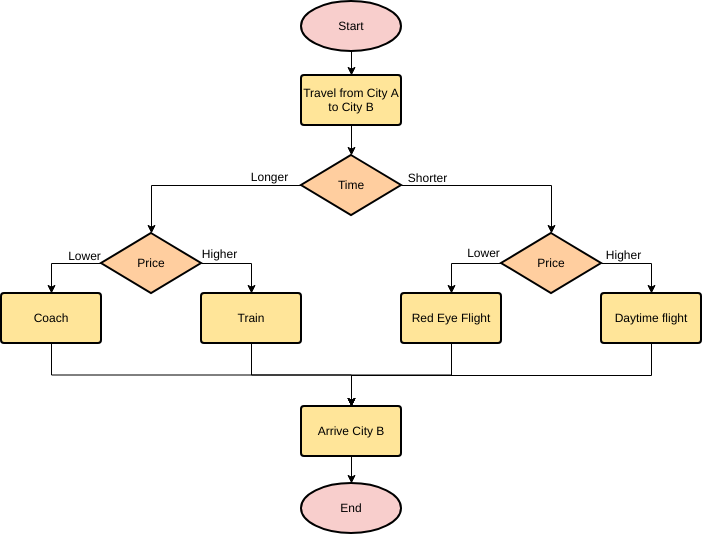
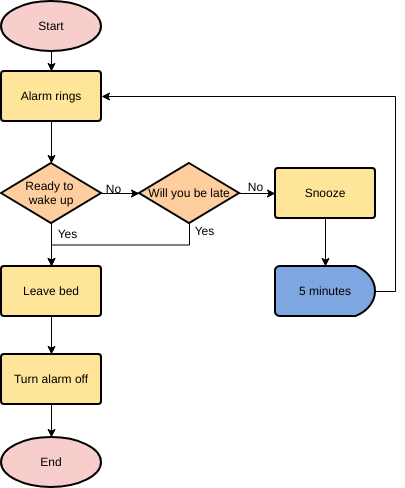
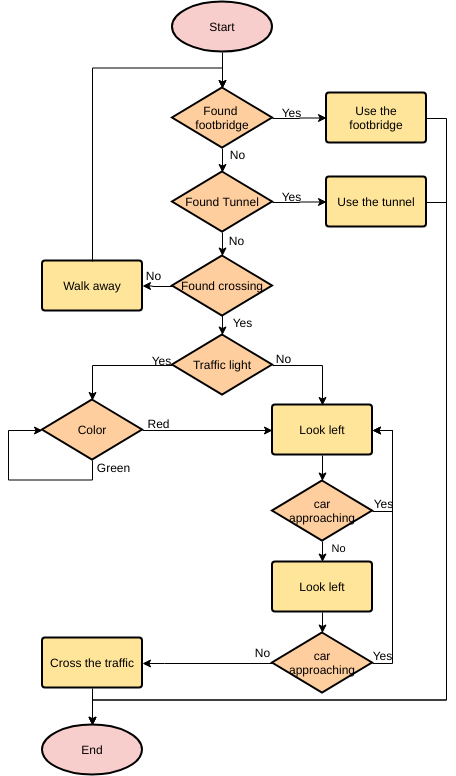
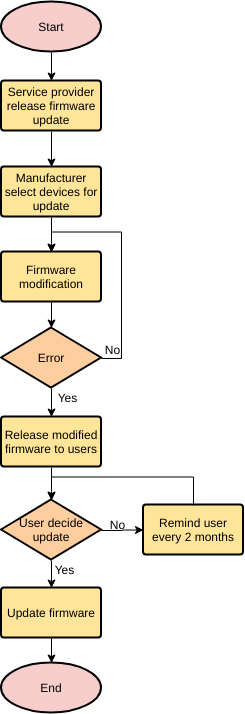
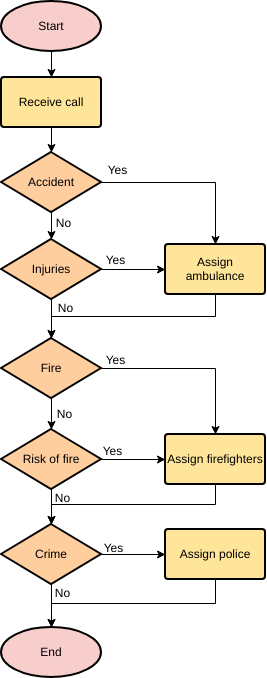
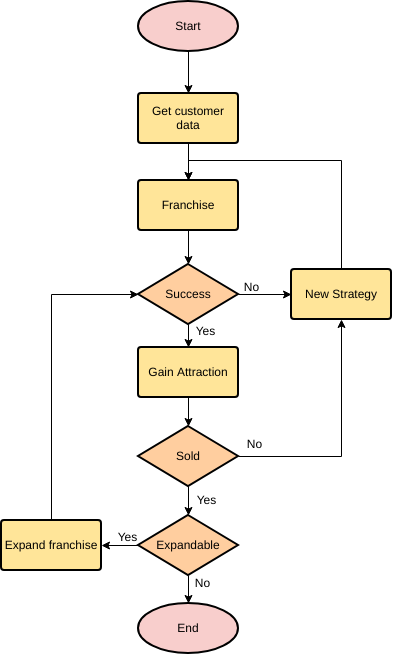
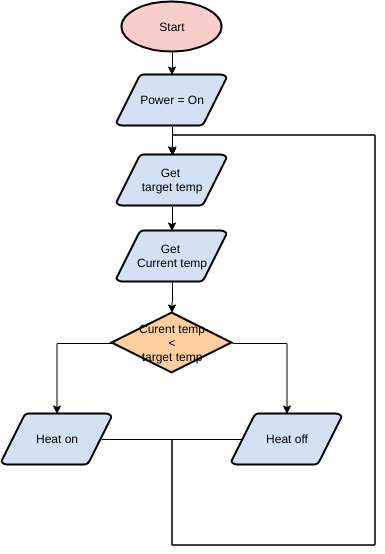
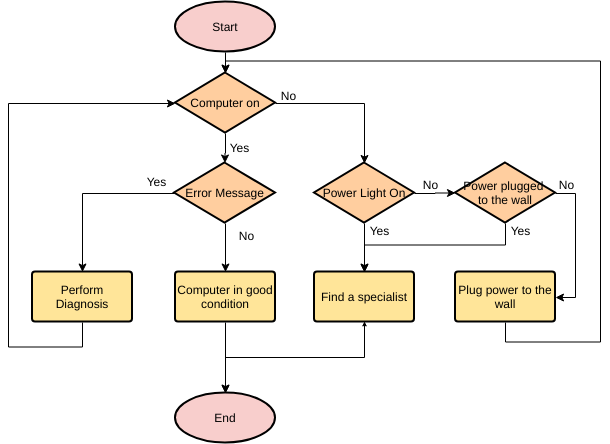
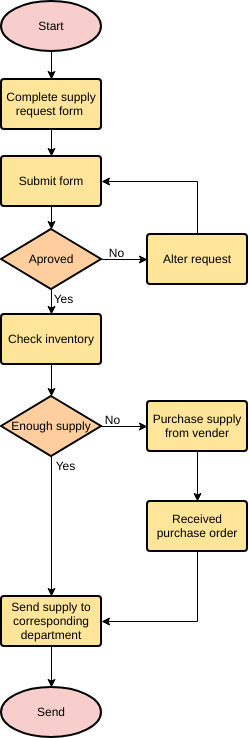
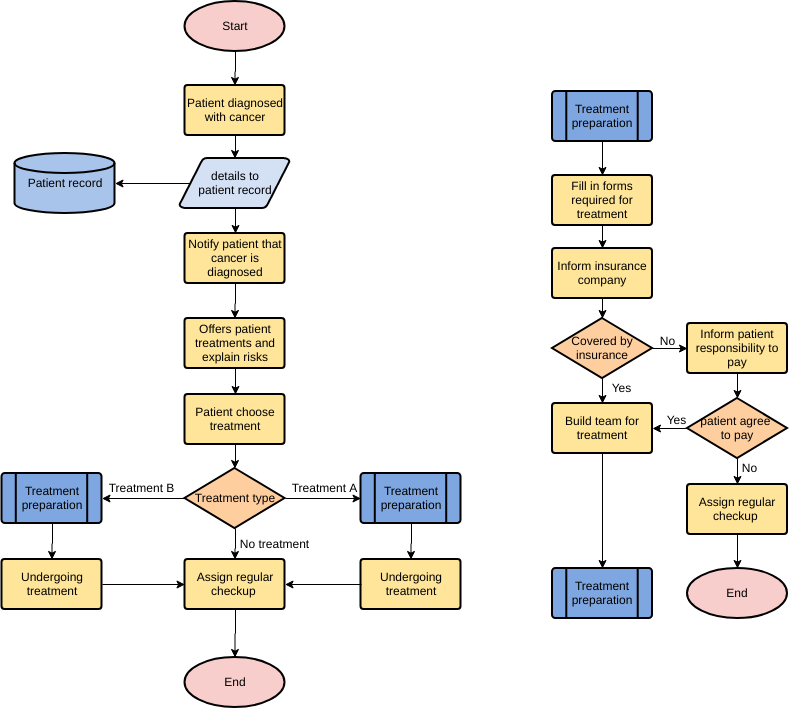
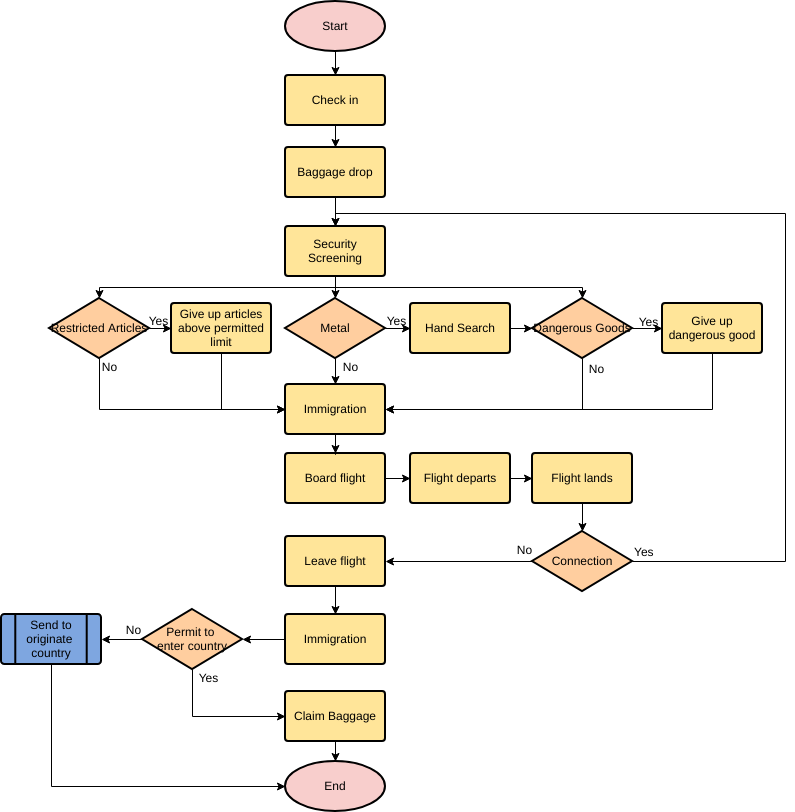
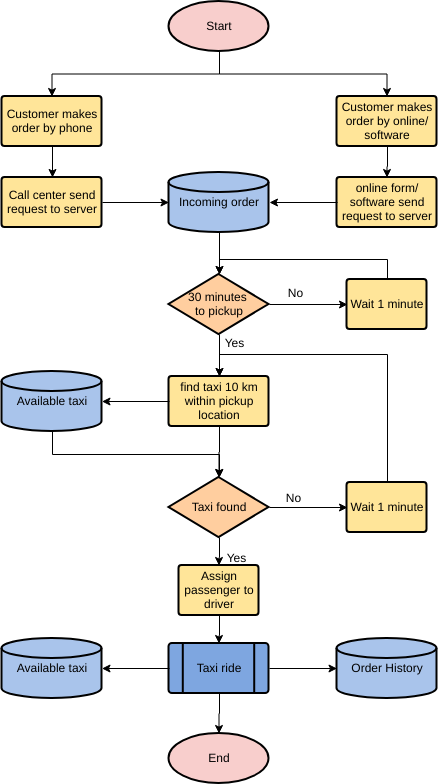
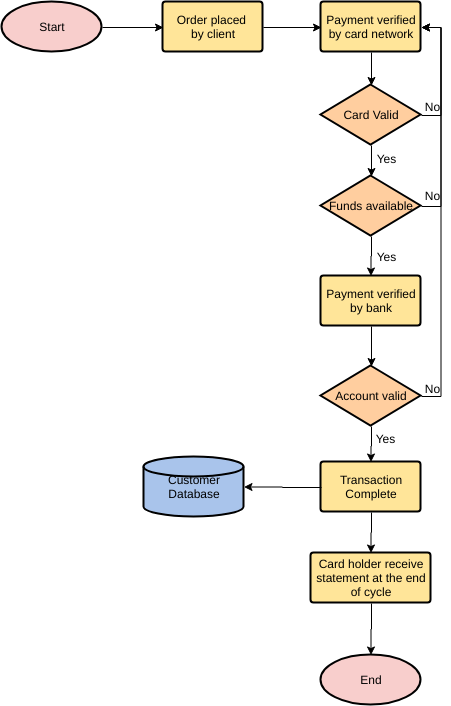
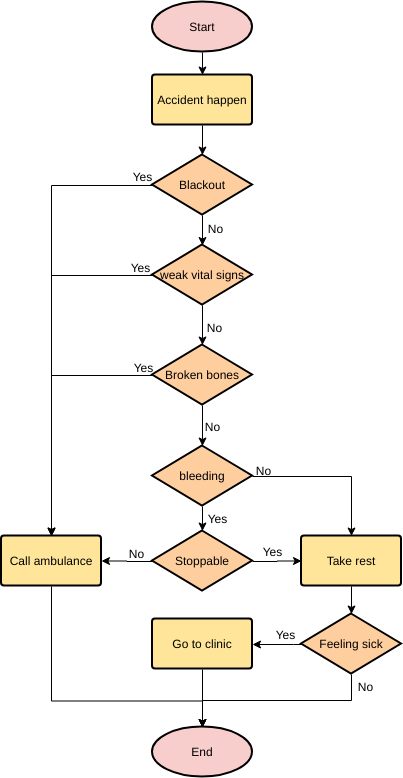
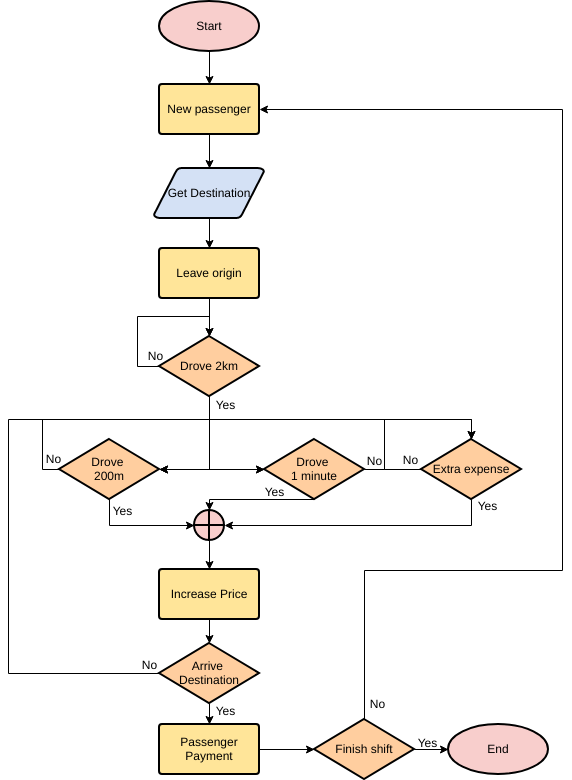
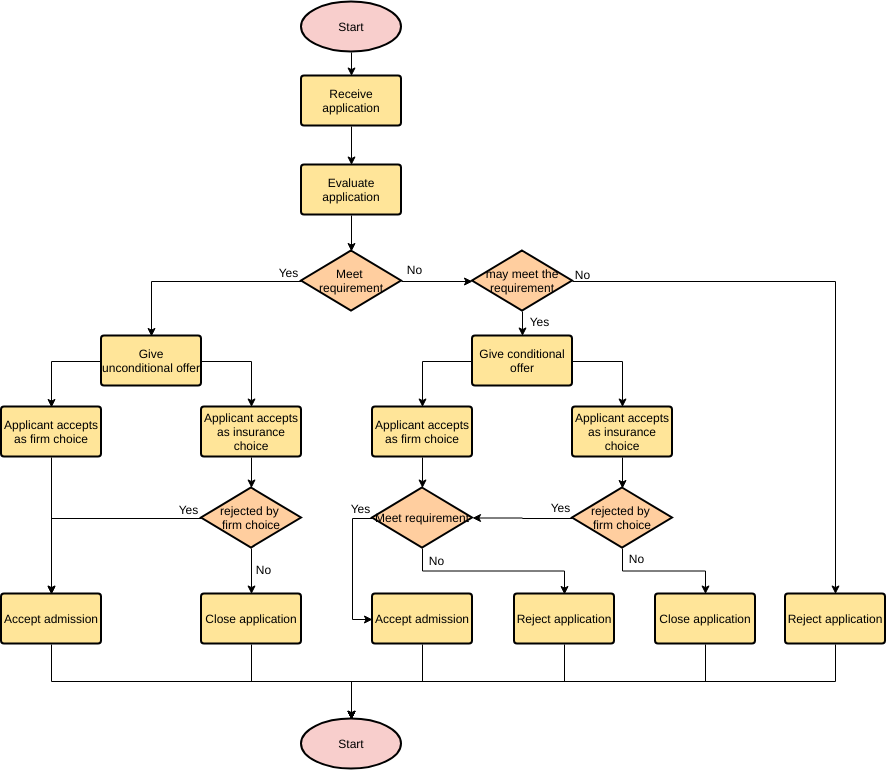
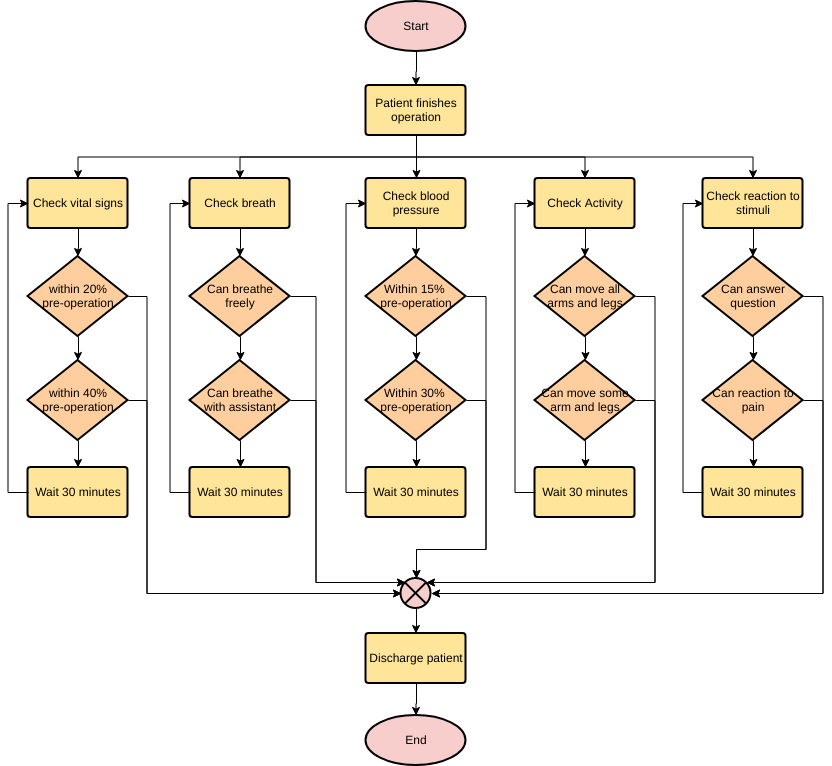
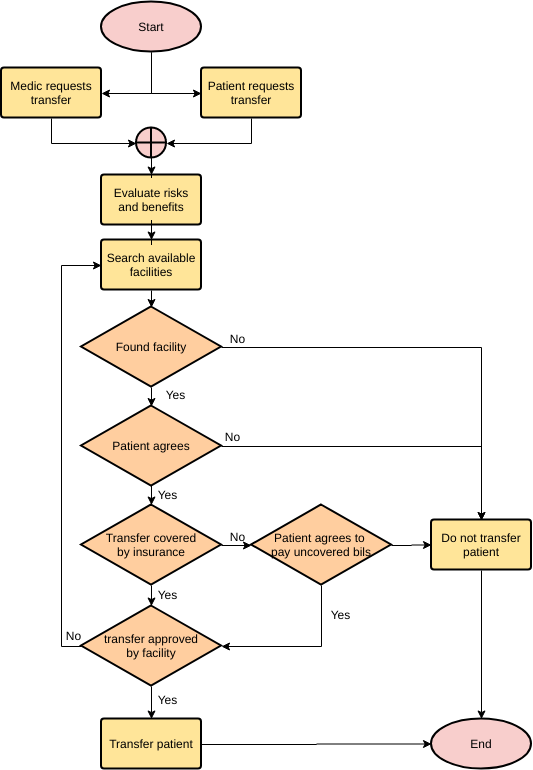
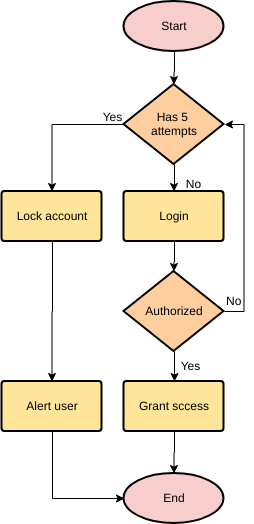
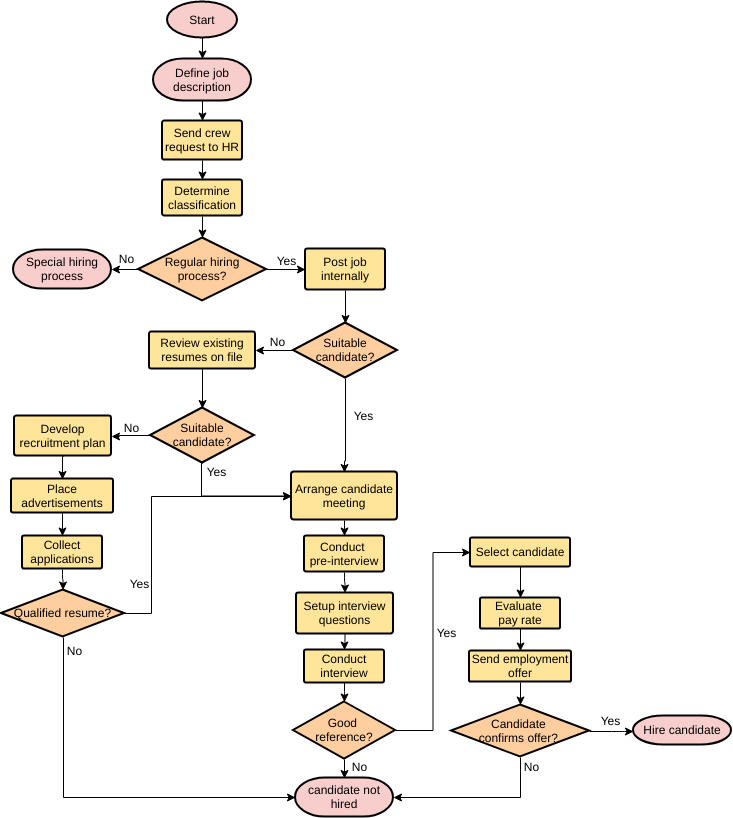
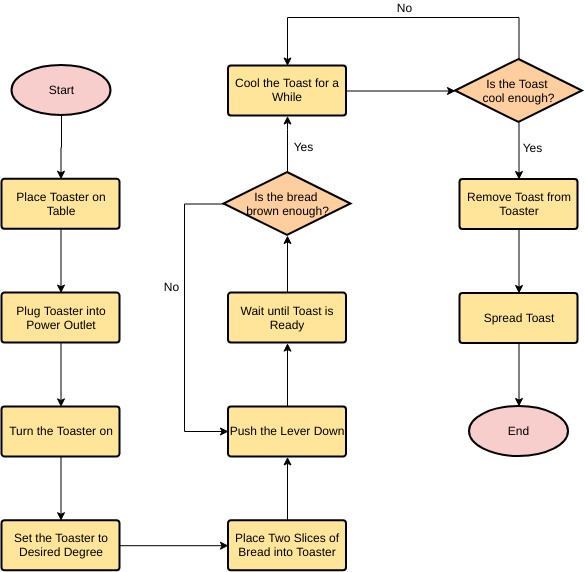
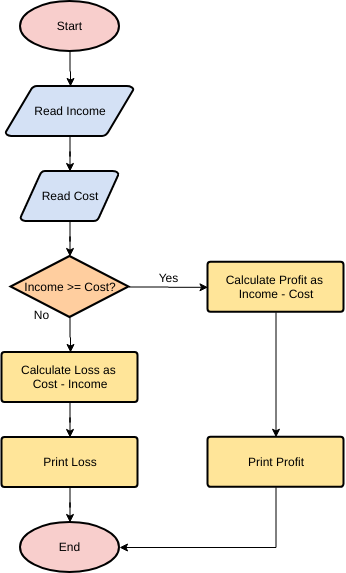
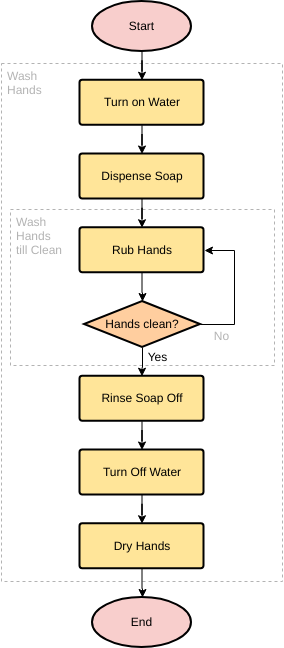
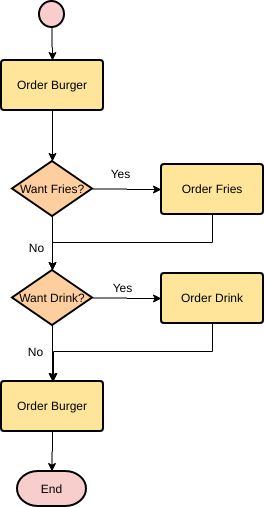
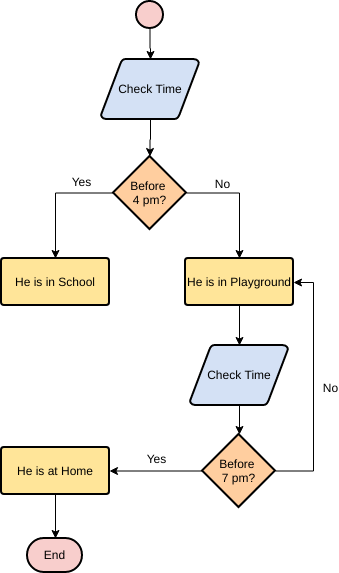
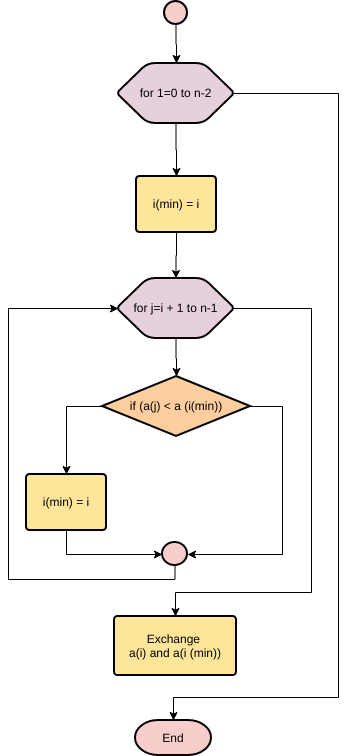
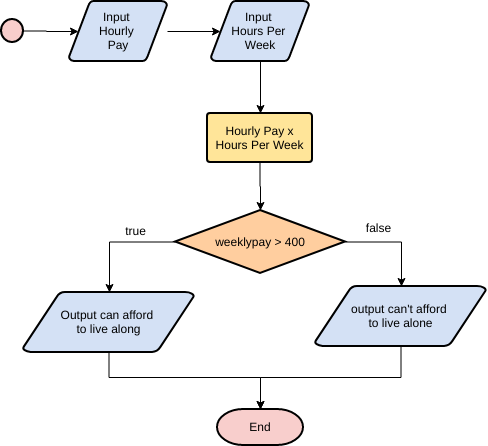
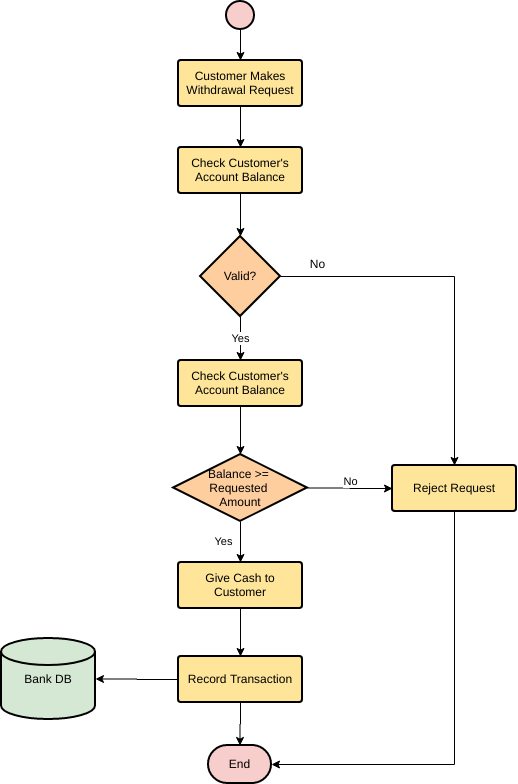
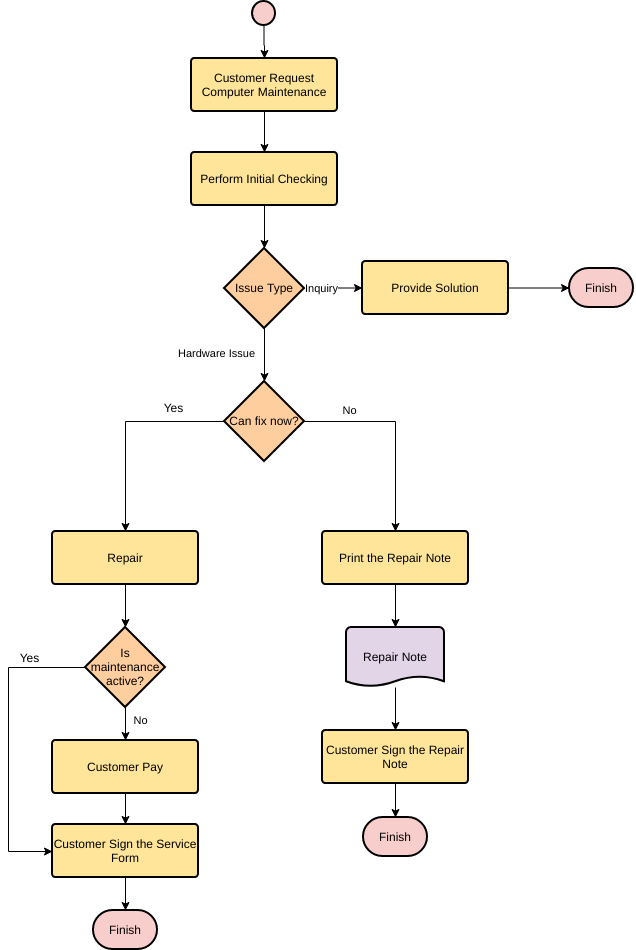
یک نمودار جریانابزاری است که به شما اجازه میدهد هر فرآیند را به فعالیتهای فردی تقسیم کنید و روابط منطقی بین آنها را نشان میدهد. بیشتر مردم معمولاً از چنین نمودارهایی برای توضیح نتایج منطقی، فرآیندهای پروژه و جریانهای قدرت در یک سازمان استفاده میکنند. برای توضیح جریان کار به عموم، استفاده از نمودار جریان انتخاب خوبی است.
مزایای تکنیک نمودار جریان
- ترویج درک مشترک از مراحل فرآیند درون تیم
- کمک به روشن شدن فرآیندهای پیچیده.
- توضیح رابطه بین مراحل مختلف فرآیند.
- ارائه تجسمی از پیچیدگی، کار مجدد و مناطق مشکل؛ این بینش میتواند مناطق را برای سادهسازی و حذف کارهای غیرضروری پیشنهاد دهد.
- امکان سادهسازی، حذف مراحل غیرضروری و استانداردسازی وجود دارد
- اجازه میدهد فرآیندی که در واقع اتفاق میافتد با یک فرآیند برنامهریزی شده یا مطلوب مقایسه شود
عناصر نمودارهای جریان
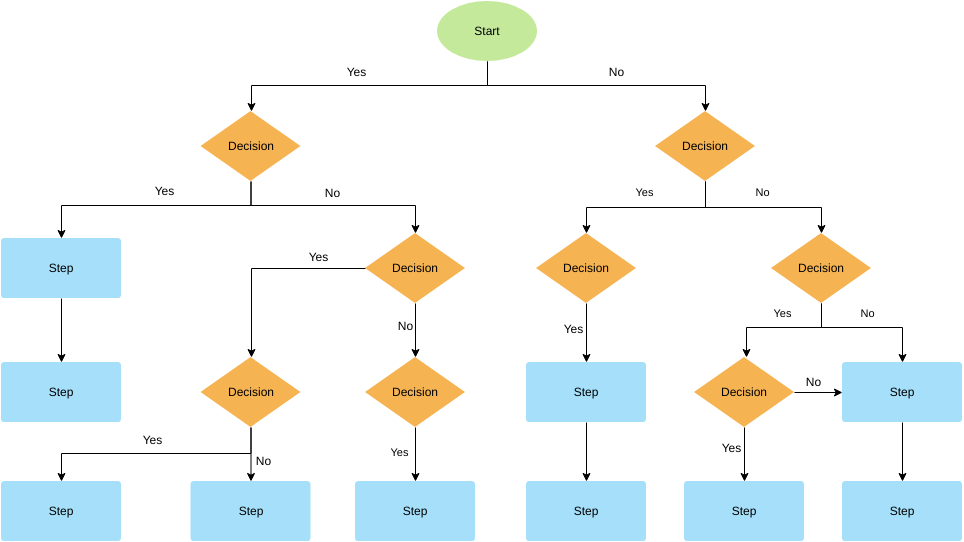
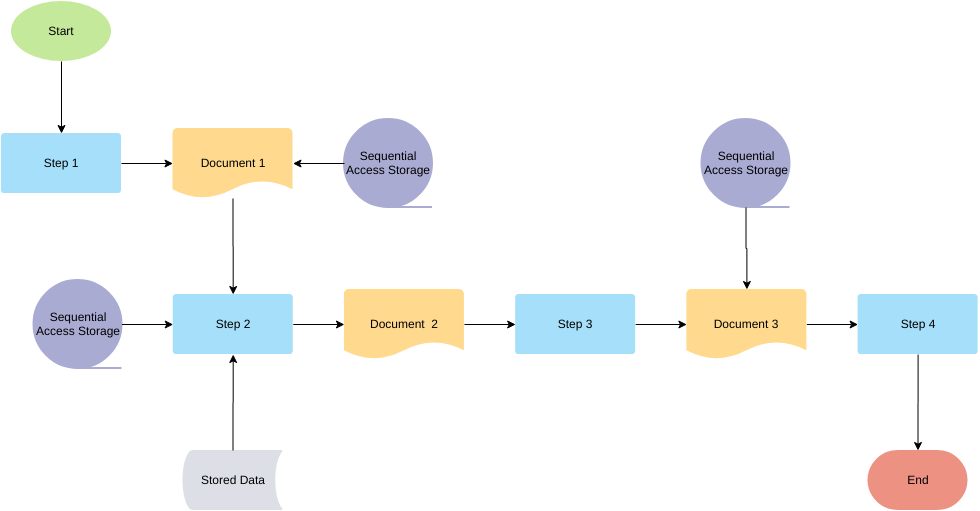
نمودار جریان یک نمودار است که از اشکال برای نشان دادن انواع مراحل و فرآیندها در یک نمودار جریان استفاده میکند. این اشکال نمایانگر انواع مختلف مراحل یا اقدامات هستند.
نمادهای پایه شامل اشکالی مانند بیضی، مستطیل، پیکان و الماس هستند. برخی از نمادهای پیشرفته نمودار جریان شامل دایرهها، مثلثها، ششضلعیها و پیکانهای خطچین هستند.
| نماد | نام نماد | هدف |
|---|---|---|
|
|
شروع/پایان | نشان دادن شروع / پایان فرآیند |
|
|
فرآیند | نمایش اقدام یا فرآیند |
|
|
ورودی/خروجی | اطلاعات ورودی و خروجی |
|
|
تصمیم | نمایانگر بیانیههای تصمیم در یک برنامه است، جایی که پاسخ معمولاً بله یا خیر است. |
|
|
جریان / پیکان | نشاندهنده روابط بین عناصر مختلف است. |
|
|
اتصالدهنده در صفحه (مرجع) | دو قسمت از یک نمودار جریان را در همان صفحه متصل میکند. |
|
|
اتصالدهنده خارج از صفحه (مرجع) | دو قسمت از یک نمودار جریان را در صفحات مختلف متصل میکند. |
مراحل ایجاد نمودارهای جریان
هنگام ایجاد یک نمودار جریان، افرادی که دانش فرآیند را دارند به مشارکت در بحث دعوت کنید. بسیاری از تیمها کشیدن نمودار جریان روی تخته سفید یا استفاده از نرمافزار نمودار جریان و پروژکت کردن نمودار روی دیوار را آسان میدانند. این امکان را به شما میدهد که مراحل را جابجا کنید و مراحل جدیدی اضافه کنید در حین تعریف فرآیند.
در اینجا مراحل ساده برای ایجاد یک نمودار جریان آورده شده است:
ایجاد نمودار جریان:
- مراحل در فرآیندها را طوفان فکری کنید،
- این فرآیندها را به ترتیب وقوع فهرست کنید.
- بررسی کنید که در فرآیند چه اتفاقی خواهد افتاد؟
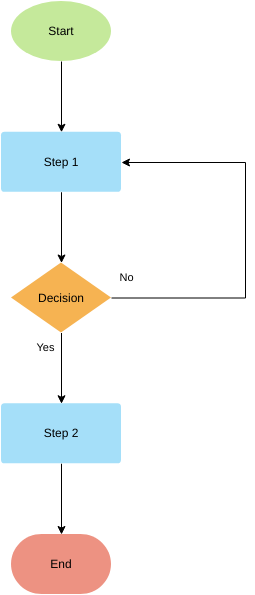
- در نظر بگیرید که آیا نیاز به تصمیمگیری قبل از مرحله بعد وجود دارد؟ (به عنوان مثال، اگر بله، پس…؛ اگر نه، پس…)
- آنها را با استفاده از پیکانها به هم متصل کنید تا جریان فرآیند را نشان دهید
- در نهایت، نمودار جریان خود را مرور کنید. از تیم خود بپرسید که آیا توالی اقدامات و تصمیمات مربوط به فرآیند را به درستی نمایان کردهاید.
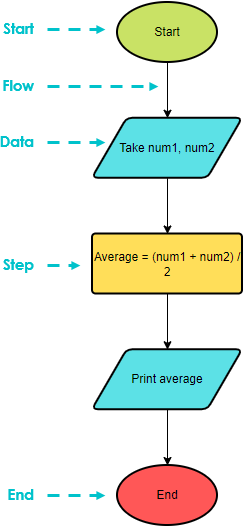
مثال ساده نمودار جریان – میانگین دو عدد
در اینجا یک نمودار جریان برای محاسبه میانگین دو عدد آورده شده است.
این مثال نمودار جریان را ویرایش کنید
قوانین ایجاد نمودارهای جریان
- نمودارهای جریان میتوانند فقط یک نماد شروع و یک نماد پایان داشته باشند
- پیکانها نباید از تلاقی یکدیگر اجتناب کنند
- جهت کلی جریان فرآیند از بالا به پایین یا از چپ به راست است
- اتصالات در صفحه با شمارهها نشان داده میشوند
- اتصالات خارج از صفحه با حروف نشان داده میشوند
اتصالدهنده در صفحه و اتصالدهنده خارج از صفحه
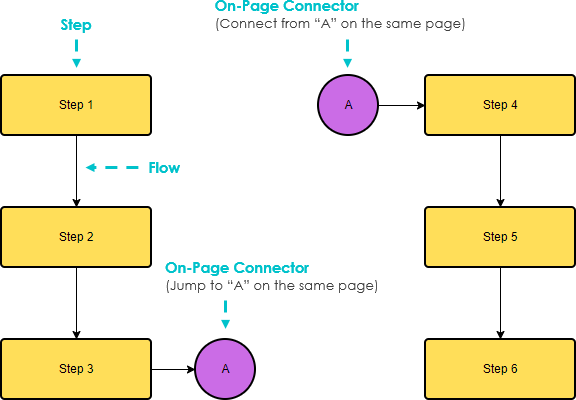
زمانی که یک نمودار جریان بزرگ دارید و ممکن است در جا دادن آن در یک صفحه واحد دچار مشکل شوید، یا میخواهید مشکل را به دو نمودار جریان منطقی مرتبط تقسیم کنید که خودشان یک نمودار جریان جداگانه هستند، میتوانید از اتصالات در صفحه/اتصالات خارج از صفحه استفاده کنید.
- اتصالات در صفحه از حروف داخل دایرهها برای نشان دادن مکان اتصالات مجاور استفاده میکنند. یک “1” به یک “1” متصل میشود، یک “2” به یک “2” متصل میشود و غیره.
- اتصالات خارج از صفحه از شماره صفحهای که قسمت بعدی یا قبلی نمودار جریان در آن قرار دارد استفاده میکنند. اتصالات در صفحه و خارج از صفحه یک ورودی یا یک خروجی دارند.
مثال اتصالدهنده در صفحه
این الگوی نمودار جریان را ویرایش کنید
مثال اتصالدهنده خارج از صفحه
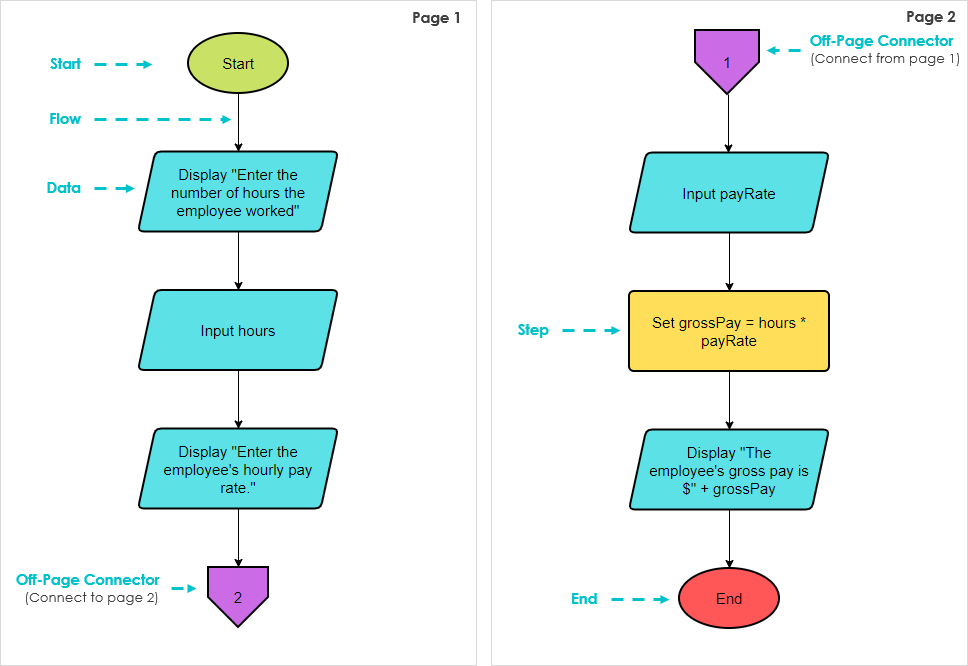
این مثال نمودار جریان را ویرایش کنید
مثال اتصالدهنده در صفحه – درست کردن یک نان تست
فرض کنید میخواهید یک نان تست با ۱۲ مرحله زیر درست کنید و آن را در یک نمودار جریان نشان دهید:
- بررسی کنید که آیا توستر به برق وصل است. (آیا وصل است؟)
- بسته نان را باز کنید.
- یک برش نان را انتخاب کنید.
- برش نان را در توستر قرار دهید.
- آیا از تعداد برشها راضی هستید؟
- زمانسنج توستر را تنظیم کنید.
- آیا از زمان تست کردن راضی هستید؟
- دکمه را فشار دهید.
- منتظر بمانید تا نان پخته شود.
- تمام برشهای نان تست را به بشقاب منتقل کنید.
- آیا آن را ساده میخواهید یا با کره؟
- بخورید.
نمودار جریان درست کردن نان تست با اتصالدهنده در صفحه:
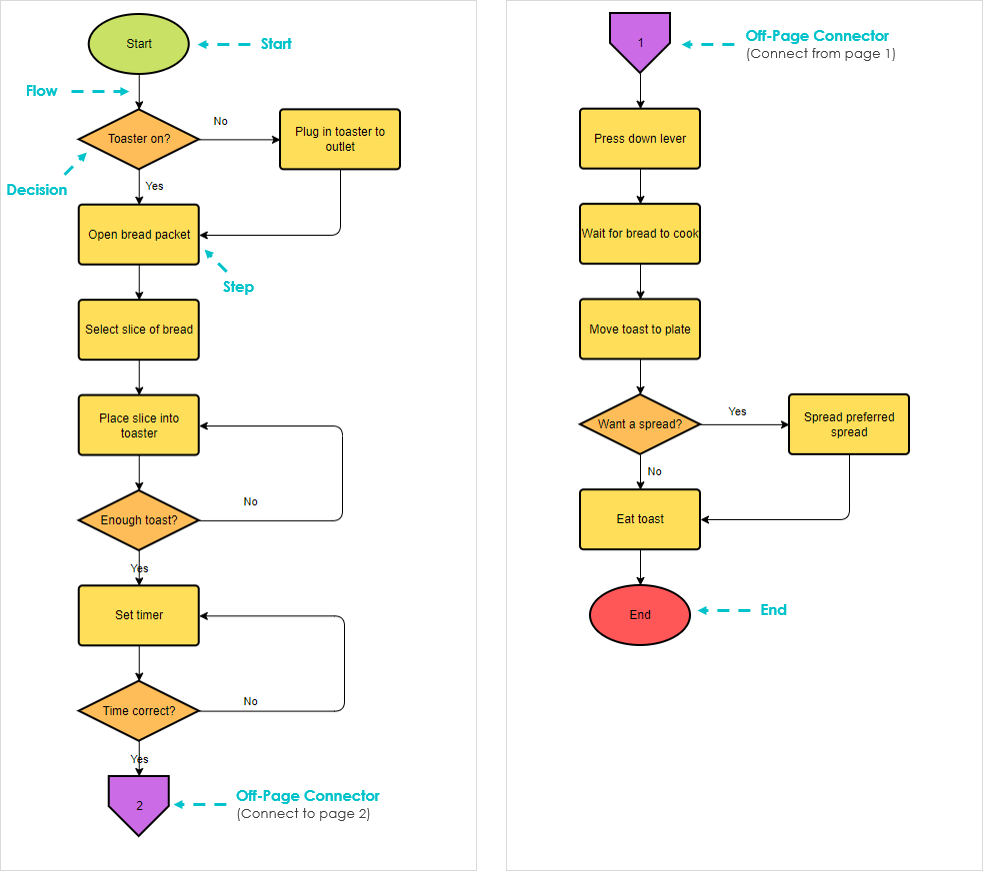
این مثال نمودار جریان را ویرایش کنید
بیشتر درباره نمودارهای جریان با مثالها بیاموزید
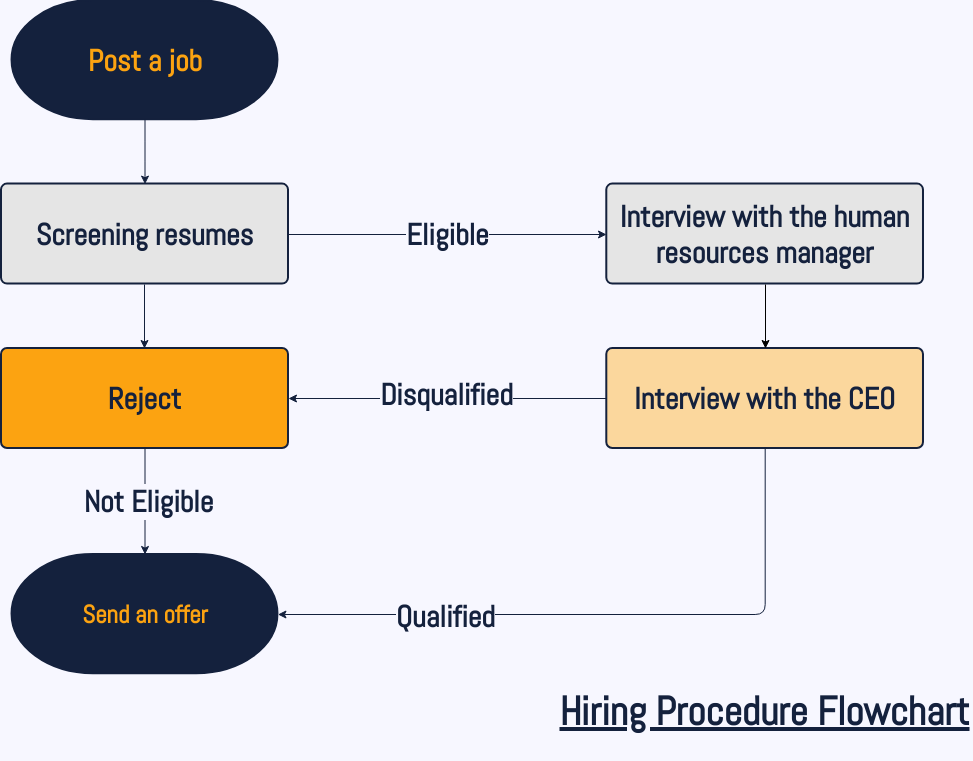
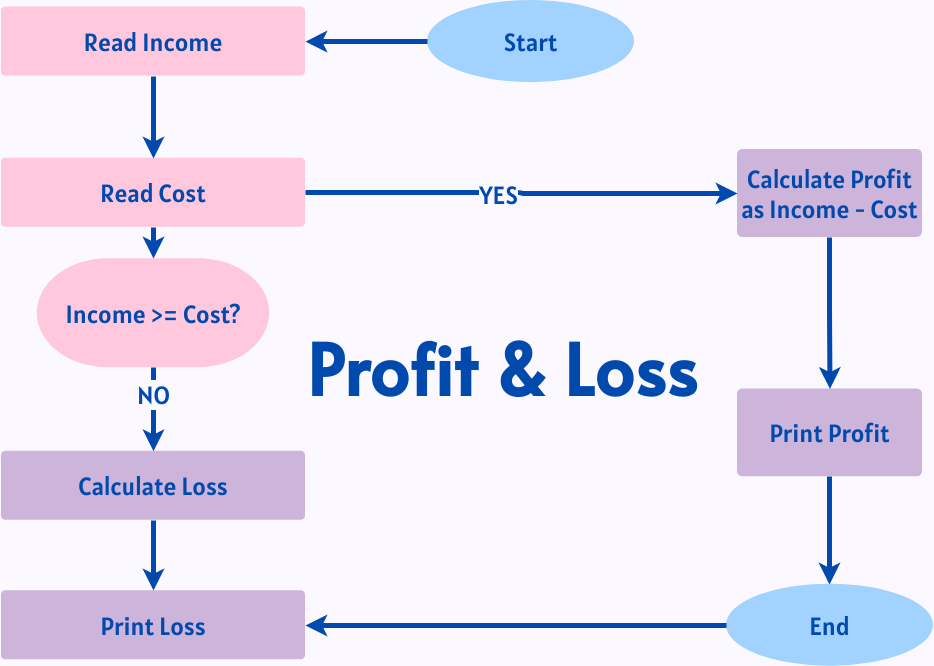
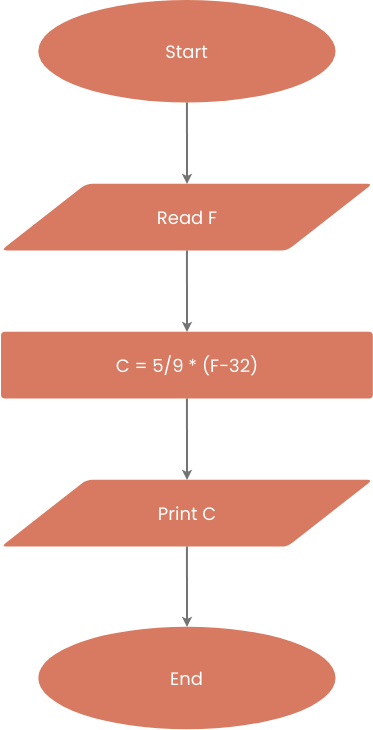
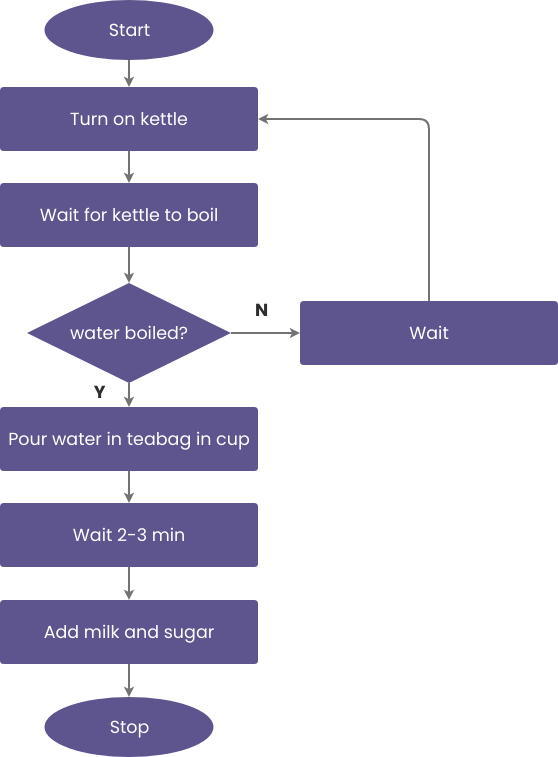
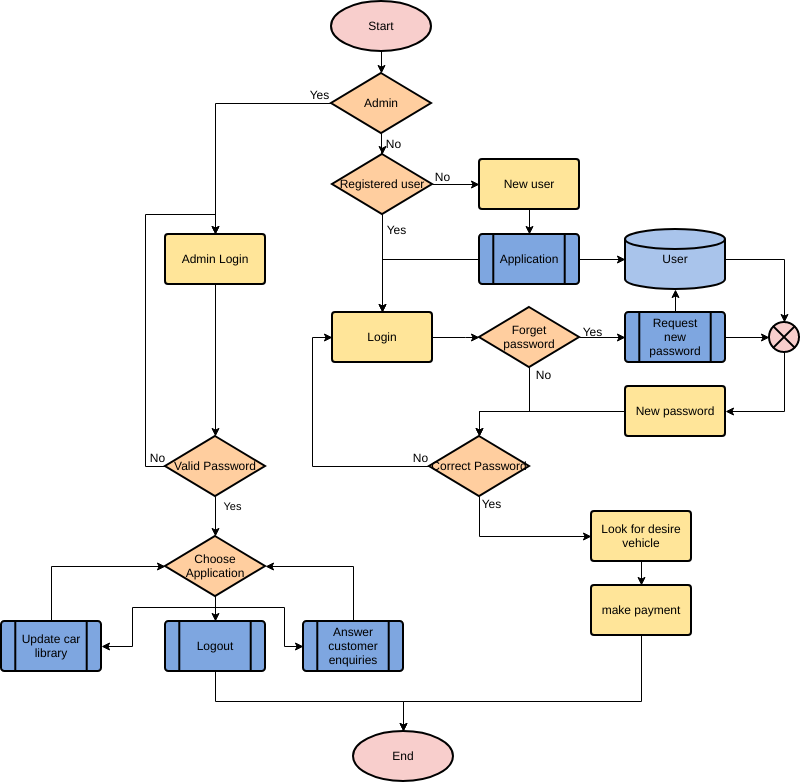
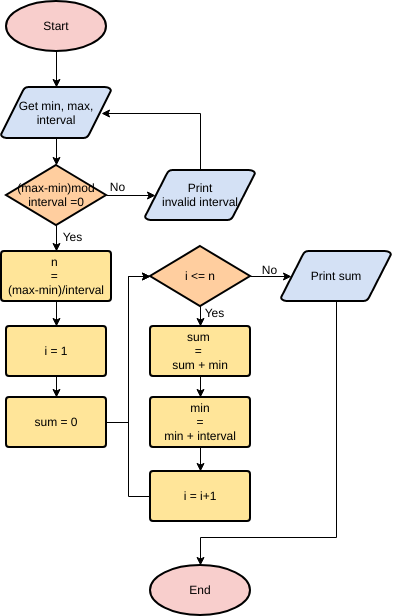
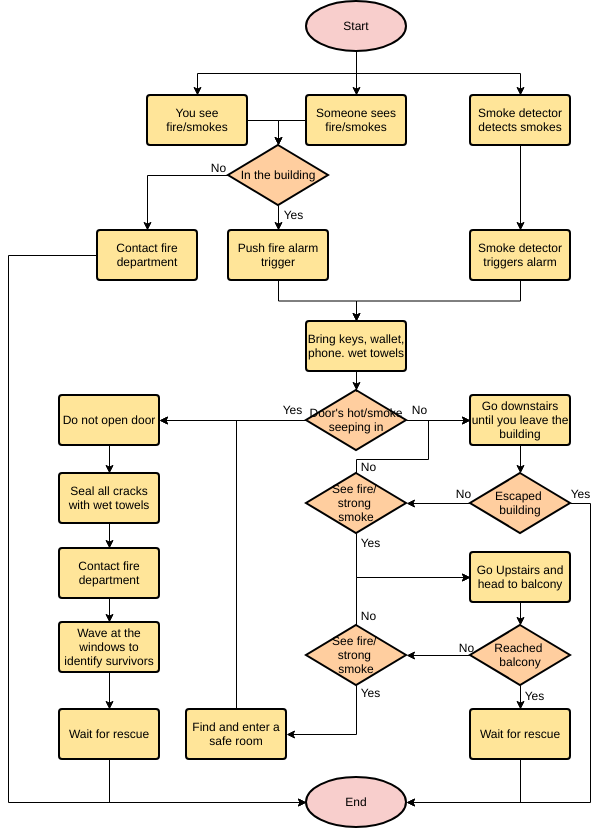
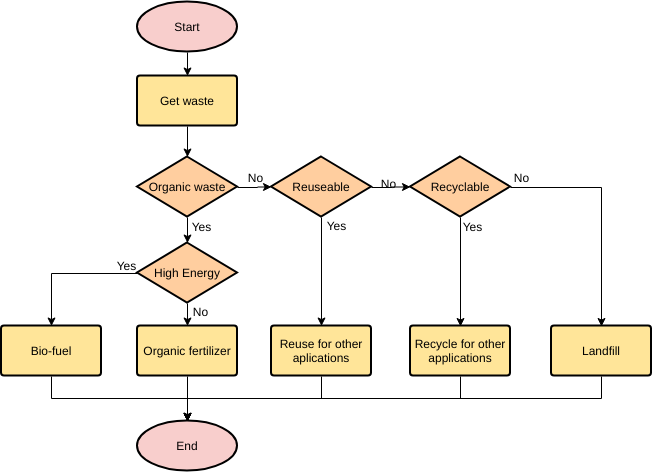
نمودار جریان یکی از پرکاربردترین نمودارها است که یک الگوریتم، جریان کار یا فرآیند را نمایان میکند و مراحل را در جعبههای مختلف نشان میدهد و آنها را به ترتیب با پیکانها متصل میکند. شما میتوانید یک نمودار جریان از ابتدا ایجاد کنید، یا به سادگی با الگوهای نمودار جریان موجود در نرمافزار نمودار جریان – ویژوال پارادایم آنلاین.
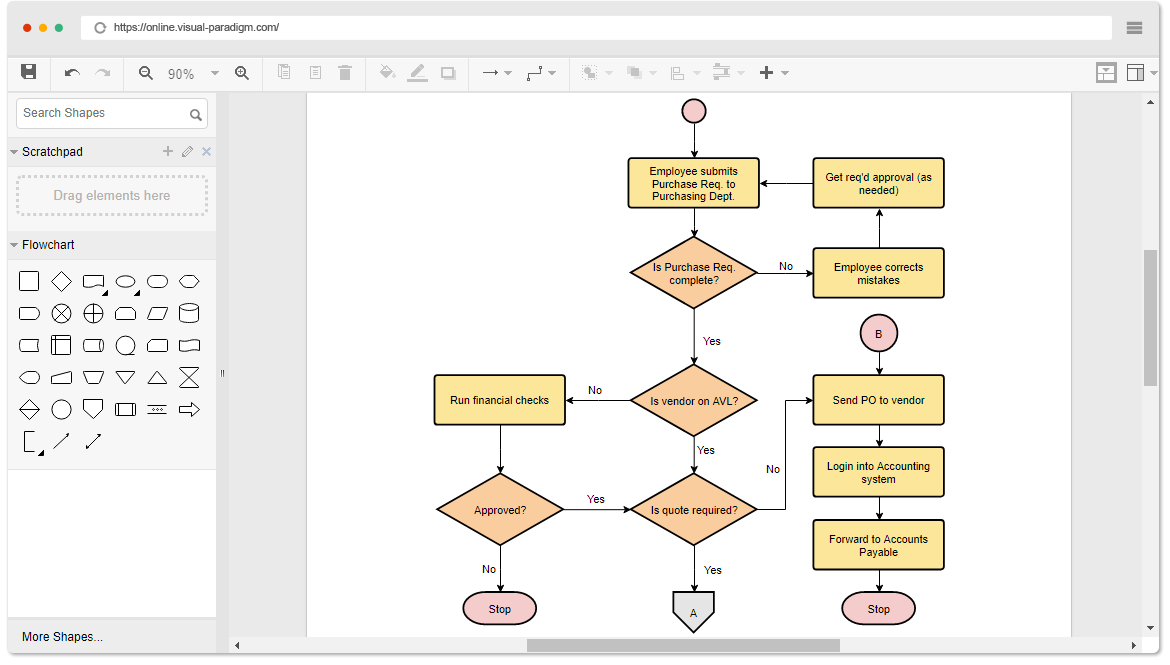
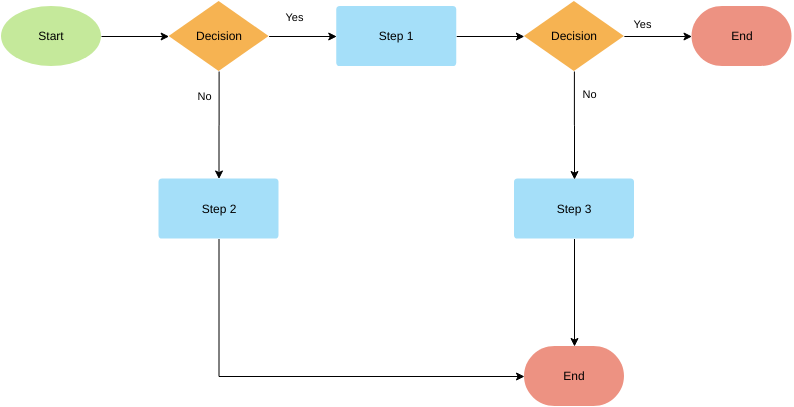
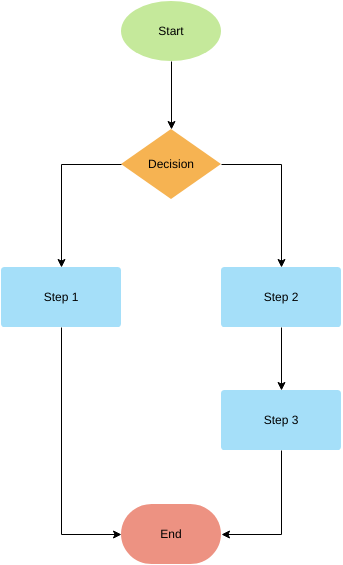
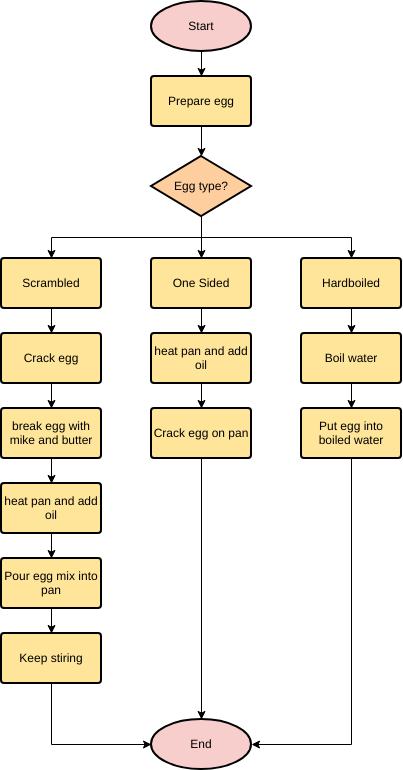
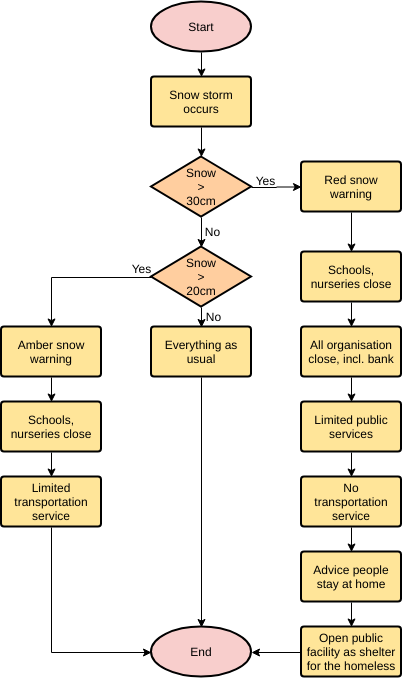
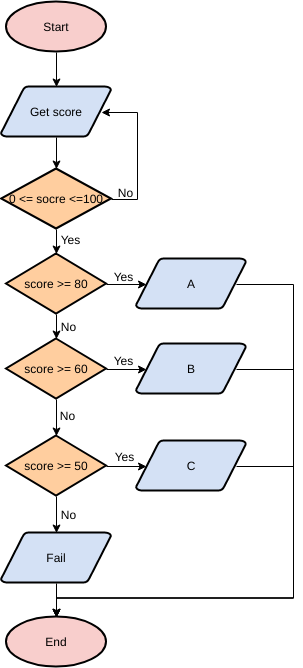
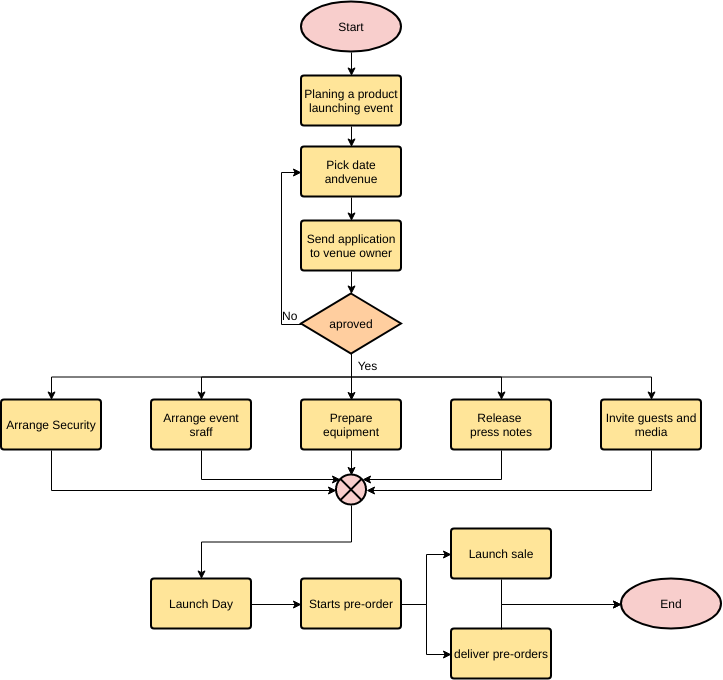
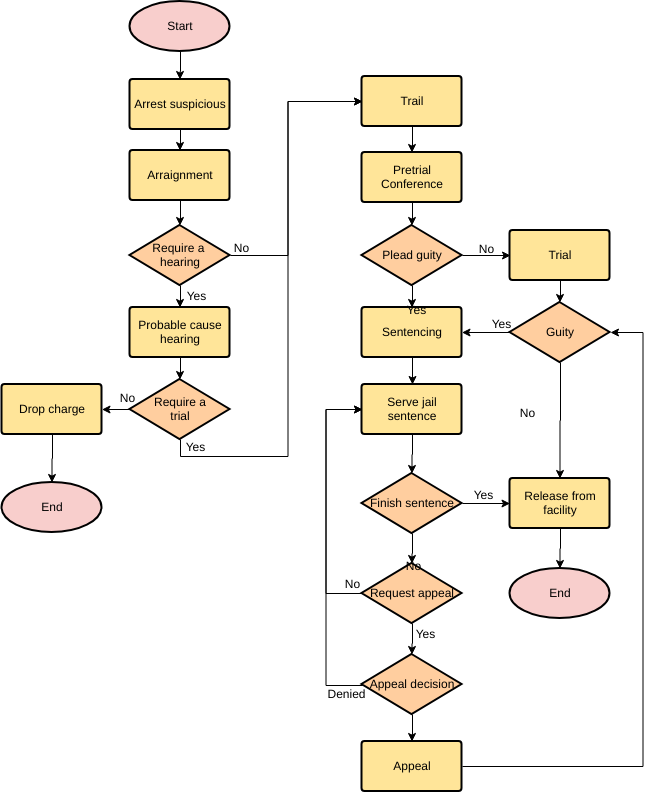
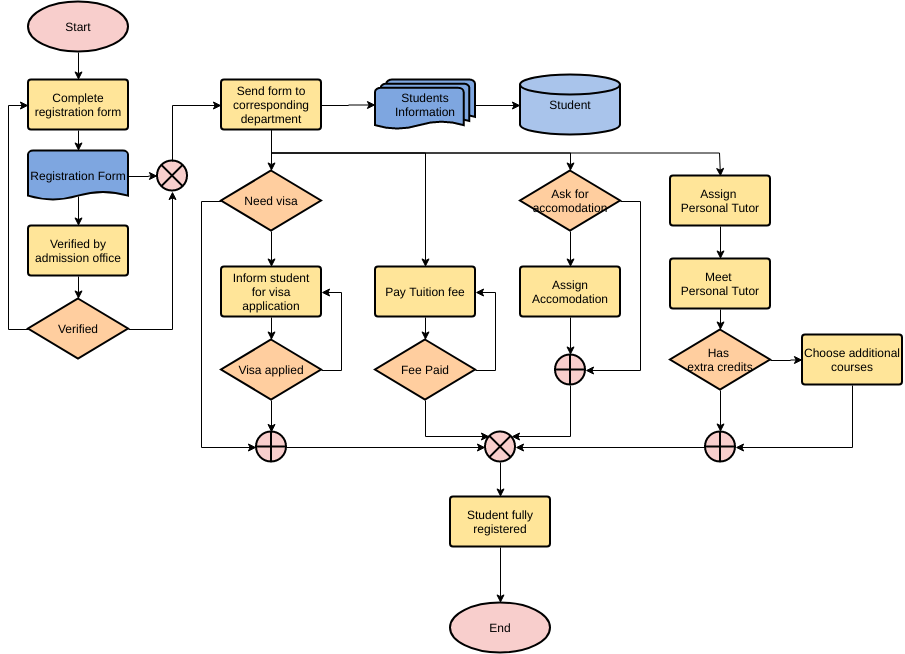
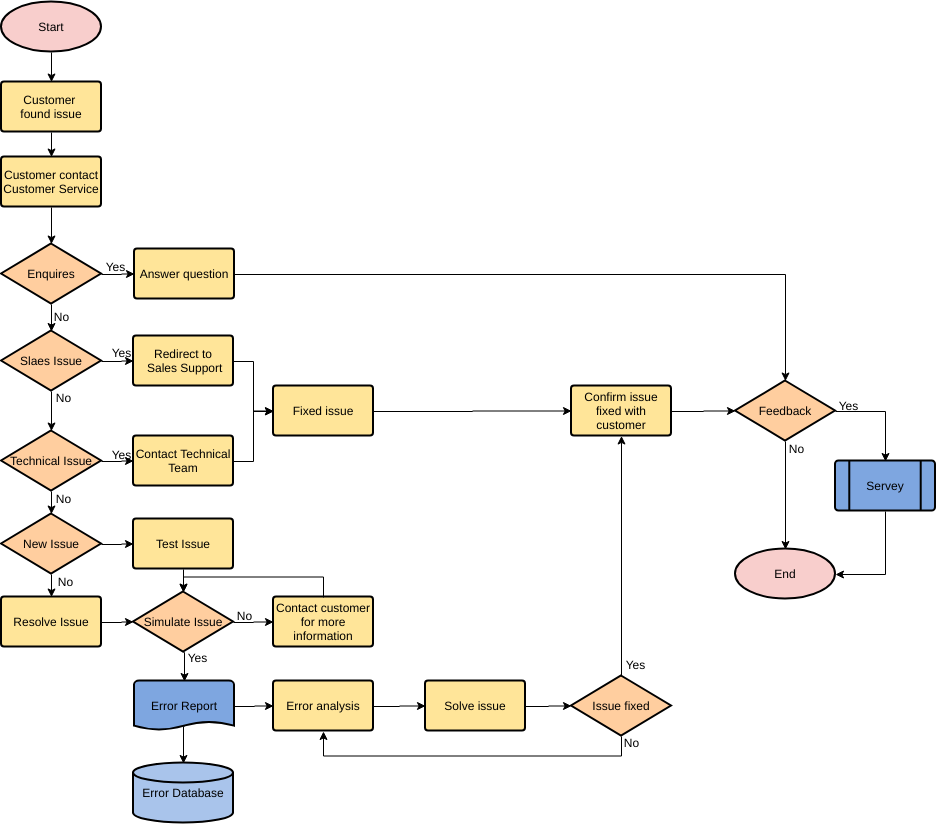
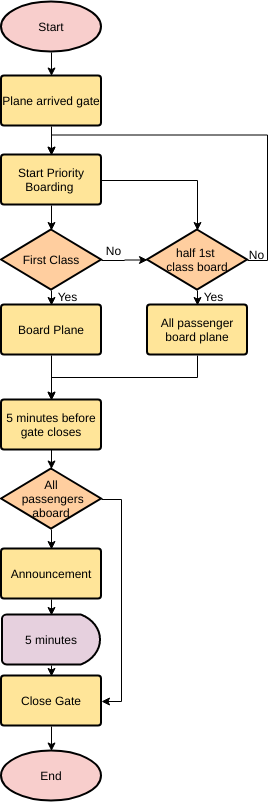
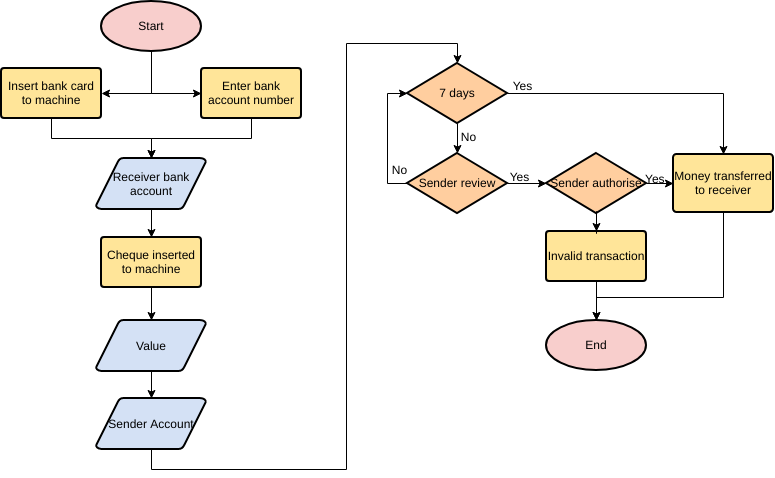
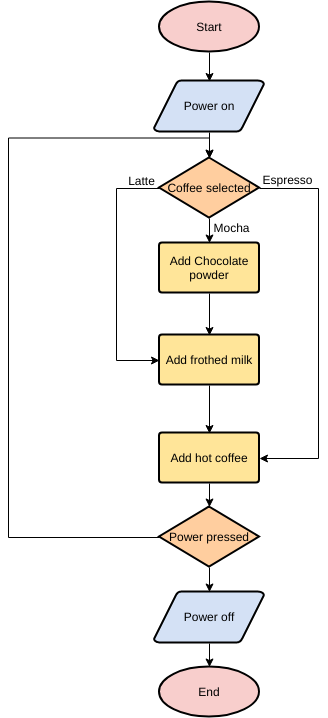
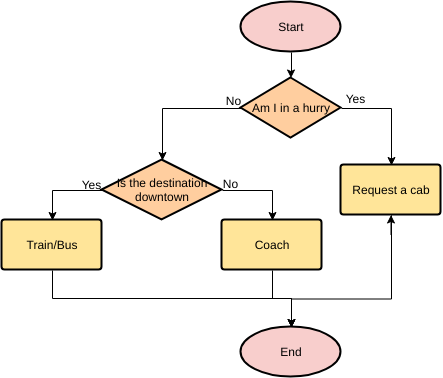
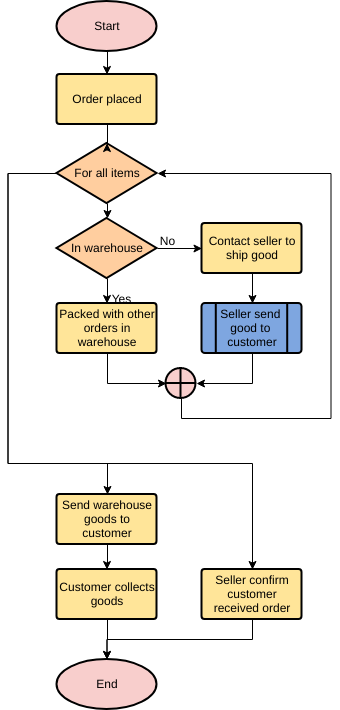
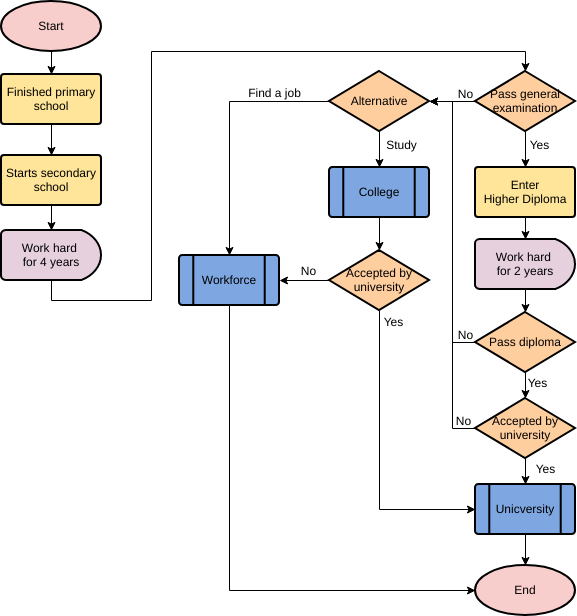
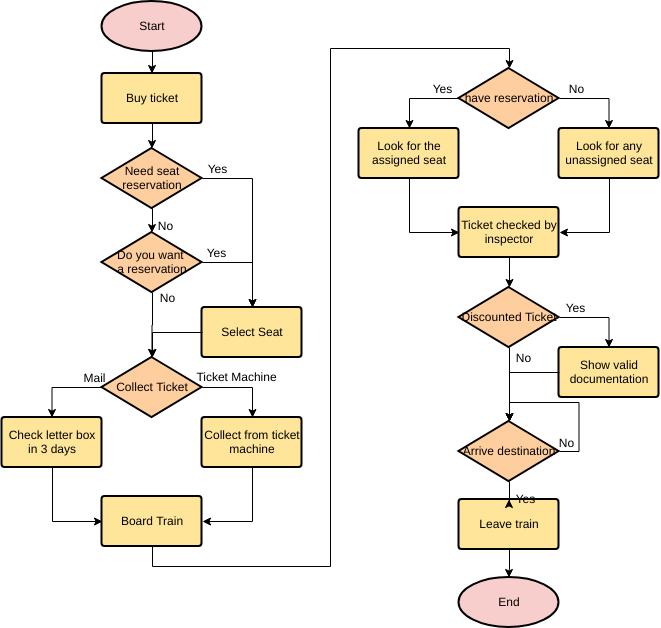
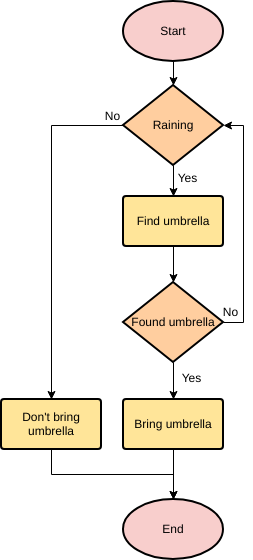
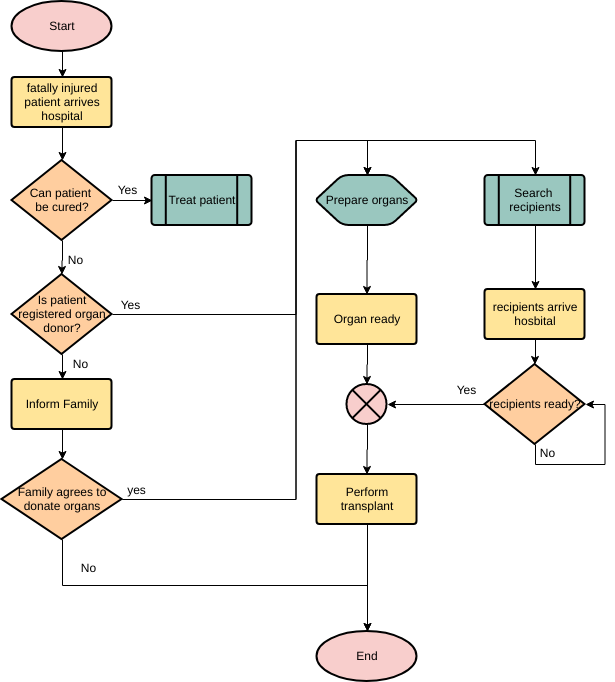
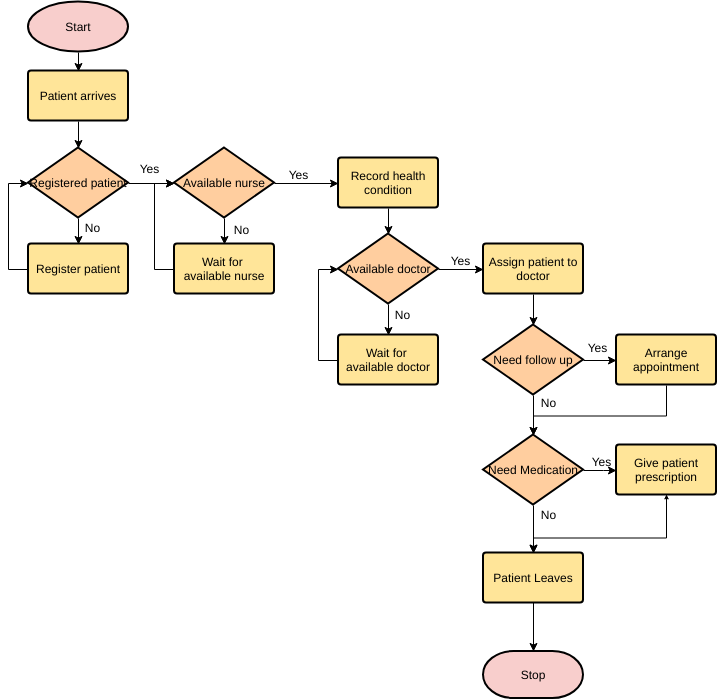
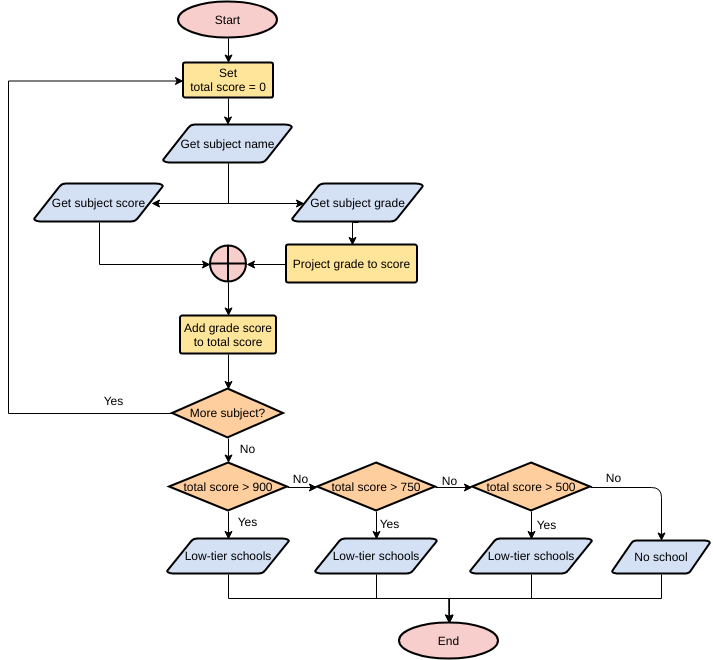
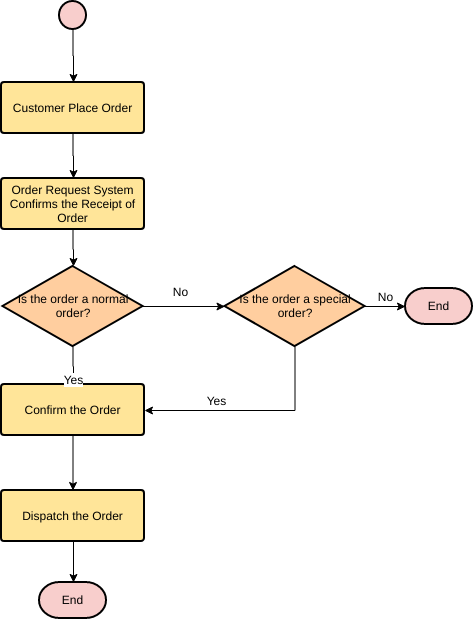
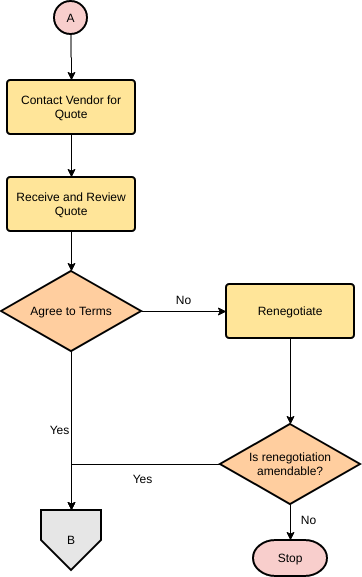
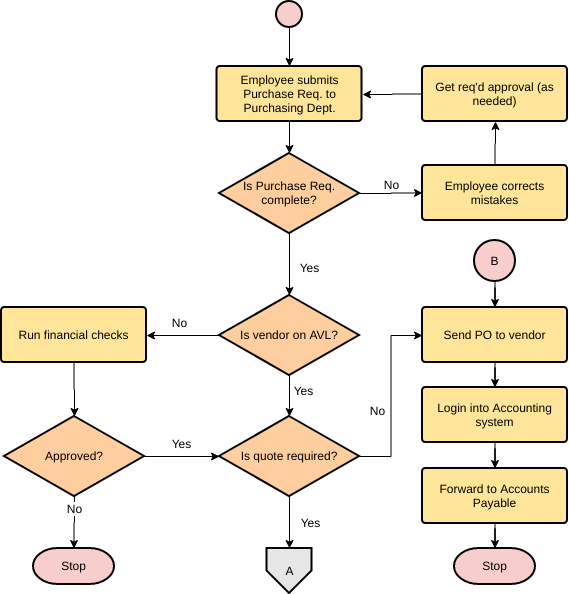
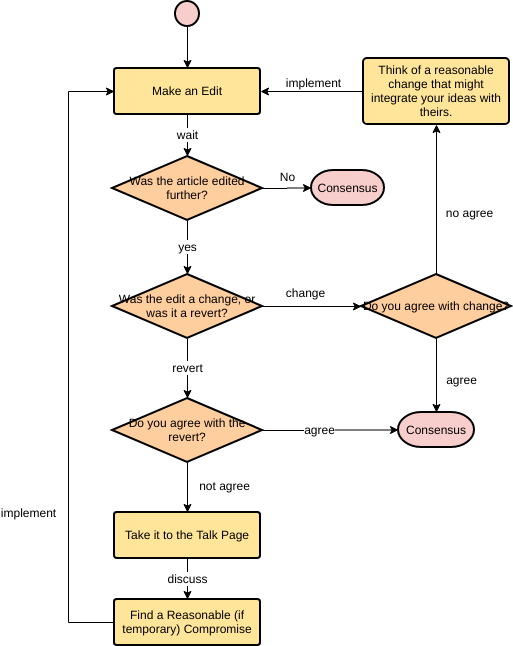
به الهام نیاز دارید؟ ما چند مثال از نمودارهای جریان را در زیر جمعآوری کردهایم تا به شما در شروع کمک کنیم. روی یک نمودار جریان کلیک کنید تا آن را مشاهده کنید، یا روی دکمه ویرایش کلیک کنید تا ویرایش را شروع کنید.
This post is also available in Deutsch, English, Español, Français, Bahasa Indonesia, 日本語, Polski, Portuguese, Ру́сский, Việt Nam, 简体中文 and 繁體中文.


