Overview
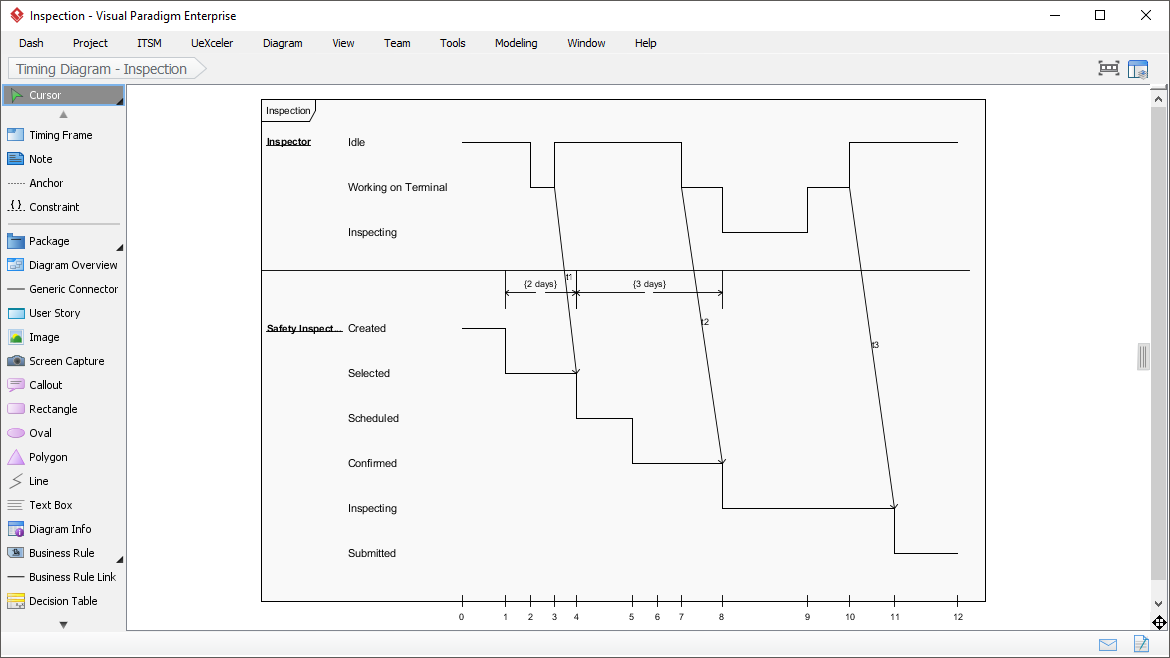
The Timing Diagram illustrates the sequence and timing of various activities involved in an inspection process. It helps in visualizing the workflow and understanding the dependencies between different tasks.

2. Key Components
- Inspector Activities:
- Idle: The period when the inspector is not actively engaged in any inspection-related tasks.
- Working on Terminal: The time spent by the inspector on a terminal, likely for administrative tasks or data entry.
- Inspecting: The actual time spent conducting the inspection.
- Safety Inspect Activities:
- Created: The point at which a safety inspection task is created.
- Selected: The task is selected for further action.
- Scheduled: The task is scheduled for inspection.
- Confirmed: The task is confirmed, indicating readiness for inspection.
- Inspecting: The actual inspection process for the safety task.
- Submitted: The task is submitted, marking the completion of the inspection.
3. Timeline
The horizontal axis represents the timeline, marked in days, ranging from 0 to 12 days.
4. Process Flow
- Inspector:
- The inspector starts in an Idle state.
- Moves to Working on Terminal after 2 days.
- Begins Inspecting after 4 days and continues until around day 10.
- Returns to Working on Terminal briefly before going back to Idle.
- Safety Inspect:
- The safety inspection task is Created at the start (day 0).
- It is Selected after 2 days.
- The task is Scheduled after 4 days.
- It is Confirmed after 5 days.
- The Inspecting process starts after 7 days and continues until around day 10.
- The task is Submitted after 11 days.
5. Dependencies and Constraints
- There is a 2-day gap between the creation and selection of the safety inspection task.
- A 3-day period is indicated between the selection and scheduling of the task.
- The inspecting process for the safety task aligns with the inspector’s inspecting period, indicating a direct dependency.
6. Interpreting the Diagram
- Horizontal Lines: Represent the duration of each activity.
- Vertical Lines: Indicate the transition points between different activities.
- Labels: Provide clear identification of each activity and its corresponding timeline.
7. Practical Applications
- Project Management: Helps in planning and scheduling inspection activities.
- Resource Allocation: Ensures that inspectors and other resources are utilized efficiently.
- Process Improvement: Identifies bottlenecks and areas for optimization in the inspection process.
8. Conclusion
The Timing Diagram is a valuable tool for visualizing and managing the inspection process. It provides a clear overview of the sequence of activities, their durations, and dependencies, enabling better planning and execution of inspections.
By understanding this diagram, stakeholders can ensure that inspections are conducted efficiently and effectively, meeting all necessary timelines and requirements.
References
- What is Timing Diagram?
- This guide provides a comprehensive overview of UML Timing Diagrams, explaining their purpose and key elements. It includes practical examples and tips for creating Timing Diagrams using Visual Paradigm11.
- How to Draw a Timing Diagram in UML?
- A tutorial on how to draw UML Timing Diagrams, including step-by-step instructions and examples. It covers the basics of Timing Diagrams and provides detailed guidance on how to create them using Visual Paradigm12.
- Understanding UML Timing Diagrams: A Comprehensive Guide – Cybermedian
- This article explains the key concepts of UML Timing Diagrams, focusing on their use in real-time systems. It includes examples and discussions on the importance of timing constraints in various domains13.
- How to Draw Timing Diagram?
- A step-by-step guide on creating UML Timing Diagrams using Visual Paradigm. It covers the basics of Timing Diagrams and provides detailed instructions on how to draw them14.
- Timing Diagram – UML 2 Diagrams – UML Modeling Tool
- This resource offers an overview of Timing Diagrams in UML 2, explaining their purpose and how they fit into the broader UML framework. It includes examples and tips for creating effective Timing Diagrams15.
- Time constraints Timing Diagram – UML – Discuss the Visual Paradigm
- A forum discussion on time constraints in UML Timing Diagrams, including examples and practical applications. It provides insights into how to model timing constraints in real-time systems16.
- Timing Diagram, UML Diagrams Example: State / Condition Timeline – Visual Paradigm Community Circle
- This resource provides an example of a UML Timing Diagram, illustrating the behavior of objects over time. It includes detailed explanations and visual representations of state and condition timelines17.
- Timing Diagram, UML Diagrams Example: State / Condition lifeline vs General Value lifeline – Visual Paradigm Community Circle
- This article compares different notations for representing states in UML Timing Diagrams. It includes examples and discussions on the advantages and disadvantages of each notation18.
- 12. Timing Diagram – Visual Paradigm Community Circle
- This guide explains the use of Timing Diagrams in UML to explore the behaviors of objects over time. It provides examples and discussions on how to use Timing Diagrams to model real-time systems19.
- Timing Diagram – Visual Paradigm Community Circle
- This resource provides a set of UML Timing Diagram examples, illustrating their use in modeling the behavior of objects over time. It includes detailed explanations and visual representations of various Timing Diagrams20.
These references should provide a comprehensive understanding of Timing Diagrams in UML and their applications.

