Sebuah model aliran data adalah cara intuitif untuk menunjukkan bagaimana sebuah sistem memproses data. Di tingkat analitis, mereka harus digunakan untuk memodelkan cara data diproses dalam sistem yang ada.
Setelah publikasi buku DeMarco tentang Analisis Sistem Terstruktur, model aliran data telah menjadi semakin banyak digunakan dalam analisis. Mereka adalah bagian yang melekat dari pendekatan terstruktur yang dikembangkan dari pekerjaan ini. Simbol-simbol yang digunakan dalam model ini mewakili pemrosesan fungsi (persegi panjang melengkung), penyimpanan data (persegi panjang), dan pergerakan data antara fungsi (panah yang diberi label).
Mengapa DFD masih berguna untuk pengembangan perangkat lunak?
Meskipun pemodelan yang berorientasi aliran data dianggap sebagai teknologi yang ketinggalan zaman oleh beberapa insinyur perangkat lunak, itu masih merupakan salah satu simbol analisis kebutuhan yang paling banyak digunakan. Meskipun diagram aliran data (DFD) bukan bagian formal dari UML, mereka dapat digunakan untuk melengkapi diagram UML dan memberikan wawasan tambahan tentang kebutuhan dan proses sistem.
Model aliran data sangat berharga karena melacak dan mencatat bagaimana data yang terkait dengan proses tertentu bergerak melalui sistem membantu analis memahami apa yang terjadi. Keuntungan dari diagram aliran data adalah bahwa, tidak seperti beberapa simbol pemodelan lainnya, mereka sederhana dan intuitif. Mereka biasanya dapat dijelaskan kepada pengguna sistem potensial yang mungkin terlibat dalam analisis dan validasi kebutuhan.
Mengapa DFD?
DFD secara grafis mewakili fungsi, atau proses, yang menangkap, memanipulasi, menyimpan, dan mendistribusikan data antara sistem dan lingkungannya serta antara komponen sistem. Representasi visual menjadikannya alat komunikasi yang baik antara Pengguna dan perancang Sistem. Struktur DFD memungkinkan dimulai dari gambaran umum yang luas dan mengembangkannya menjadi hierarki diagram yang lebih rinci. DFD sering digunakan karena alasan berikut:
- Aliran informasi logis dari sistem
- Penentuan persyaratan konstruksi sistem fisik
- Kesederhanaan notasi
- Penetapan persyaratan sistem manual dan otomatis
DFD adalah Proses Dekompisi Top-Down
Pemodelan aliran data adalah proses “top-down”. Pertama, analisis seluruh proses pengadaan. Sub-proses kemudian dianalisis dengan cara dekomposisi top-down.
DFD dapat digunakan untuk memodelkan sistem atau perangkat lunak pada tingkat abstraksi mana pun. Seperti yang disebutkan sebelumnya, DFD dapat dibagi menjadi tingkat yang mewakili aliran informasi dan detail fungsional yang meningkat. Nomor level dalam DFD adalah 0, 1, 2 atau lebih tinggi. Di sini, kita akan melihat bahwa ada tiga level utama dalam diagram aliran data, yaitu, level 0 DFD, level 1 DFD, dan level 2 DFD.
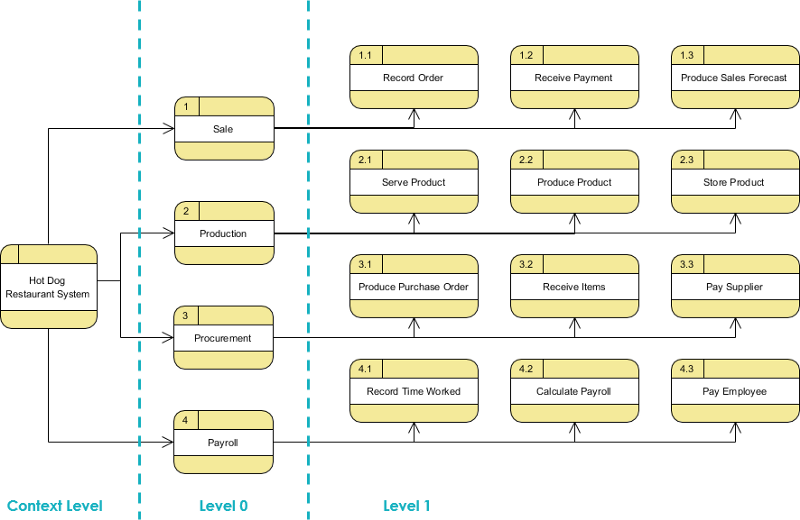
Diagram Konteks — Tingkat DFD
Diagram Konteks (juga dikenal sebagai level 0 DFD), mewakili seluruh kebutuhan perangkat lunak sebagai gelembung, dengan data input dan output yang diwakili oleh panah input dan output.
Sistem kemudian didekomposisi menjadi DFD dengan beberapa gelembung. Bagian-bagian dari sistem yang diwakili oleh setiap gelembung kemudian dipecah dan dicatat ke dalam diagram aliran data yang semakin rinci. Proses ini dapat diulang pada tingkat yang diperlukan hingga program yang bersangkutan sepenuhnya dipahami.
Jumlah input dan output antara level harus dipertahankan, sebuah konsep yang dikenal sebagai leveling DeMacro. Oleh karena itu, jika gelembung “A” memiliki dua input X1 dan X2 serta satu output Y, maka diagram aliran data sub-level yang mewakili DFD level atas “A” harus memiliki tepat dua input eksternal dan satu output eksternal.
Dalam DFD level 1, diagram konteks didekomposisi menjadi beberapa proses. Di level ini kita menyoroti fungsi utama dari sistem dan memecah proses tingkat tinggi dari DFD level 0 menjadi subproses lebih lanjut untuk mewakili rincian aktivitas pemrosesan.
Diagram konteks (level 0 DFD) — diagram konteks DFD adalah diagram yang mewakili gambaran umum sistem dan interaksinya dengan sisa “dunia”.
Diagram aliran data level 1 — level 1 DFD memberikan pandangan yang lebih rinci tentang sistem daripada diagram konteks dengan menunjukkan subproses utama dan penyimpanan data yang membentuk keseluruhan sistem.
Level 2 (atau lebih rendah) — keuntungan utama dari teknologi pemodelan aliran data adalah bahwa kompleksitas rinci dari sistem dunia nyata dapat dikelola dan dimodelkan pada tingkat abstrak melalui teknologi yang disebut “leveling”. Beberapa elemen dari diagram aliran data mana pun dapat didekomposisi (“didekomposisi”) menjadi model yang lebih rinci pada tingkat yang lebih rendah dalam hierarki
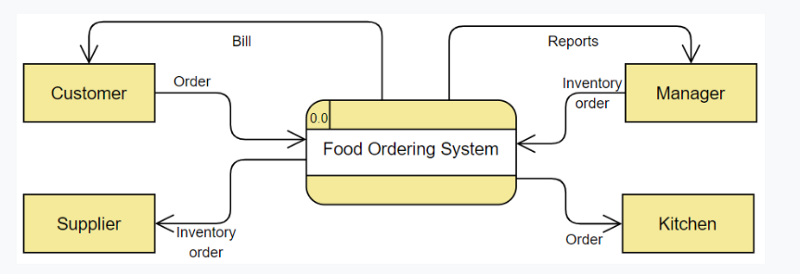
Tingkat DFD — Contoh— Sistem Pemesanan Makanan
Level 0
Ini juga dikenal sebagai diagram konteks. Ini dirancang untuk menjadi pandangan abstraksi, menunjukkan sistem sebagai satu proses dengan hubungannya dengan entitas eksternal.
- Diagram konteks harus muat dalam satu halaman.
- Nama proses dalam diagram konteks harus menjadi nama sistem informasi.
- Misalnya, Sistem Penilaian, Sistem Pemrosesan Pesanan, Sistem Pendaftaran.
Dalam DFD level 1, diagram konteks didekomposisi menjadi beberapa proses. Di level ini kita menyoroti fungsi utama dari sistem dan memecah proses tingkat tinggi dari DFD level 0 menjadi subproses lebih lanjut untuk mewakili rincian aktivitas pemrosesan.
Level 1 — Sistem Pemesanan Makanan
Dalam DFD level 1, diagram konteks didekomposisi menjadi beberapa proses. Di level ini kita menyoroti fungsi utama dari sistem dan memecah proses tingkat tinggi dari DFD level 0 menjadi subproses lebih lanjut untuk mewakili rincian aktivitas pemrosesan.
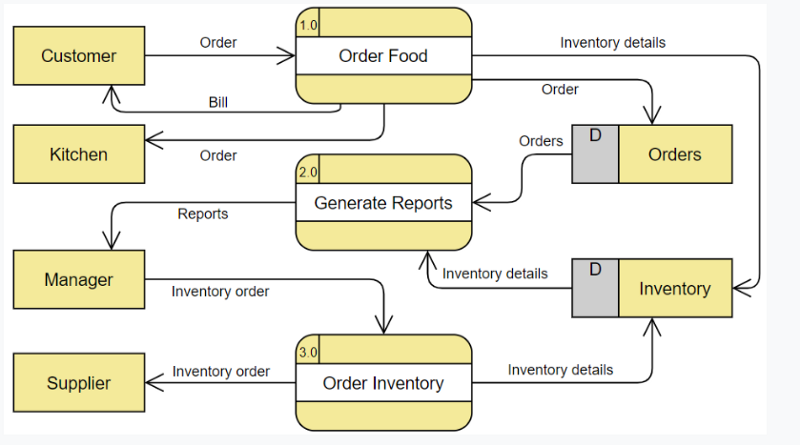
Jika ada proses dengan banyak aliran data yang menghubungkan antara beberapa entitas eksternal, kita bisa terlebih dahulu mengekstrak proses tertentu tersebut dan entitas eksternal yang terkait ke dalam diagram terpisah yang mirip dengan diagram konteks, sebelum Anda menyempurnakan proses tersebut ke dalam level DFD yang terpisah; dan dengan cara ini Anda dapat memastikan konsistensi antara mereka dengan lebih mudah.
Simbol DFD
Ada empat simbol dasar yang digunakan untuk merepresentasikan diagram aliran data.
Proses
Sebuah proses menerima data masukan dan menghasilkan keluaran dengan konten atau bentuk yang berbeda. Proses dapat sesederhana mengumpulkan data masukan dan menyimpannya di database, atau bisa juga kompleks seperti menghasilkan laporan yang berisi penjualan bulanan dari semua toko ritel di wilayah barat laut.
Setiap proses memiliki nama yang mengidentifikasi fungsi yang dilakukannya.
Nama terdiri dari sebuah kata kerja, diikuti oleh sebuah kata benda tunggal.
Contoh:
- Terapkan Pembayaran
- Hitung Komisi
- Verifikasi Pesanan
Notasi DFD
- Sebuah persegi panjang membulat mewakili sebuah proses
- Proses diberikan ID untuk referensi yang mudah

Contoh Proses

Aliran Data
Aliran data adalah jalur bagi data untuk bergerak dari satu bagian sistem informasi ke bagian lainnya. Aliran data dapat mewakili satu elemen data seperti ID Pelanggan atau dapat mewakili sekumpulan elemen data (atau struktur data).
Contoh:
- Customer_info (NamaBelakang, NamaDepan, SS#, Tel #, dll.)
- Order_info (OrderId, Item#, TanggalPesanan, CustomerID, dll.).
Contoh Aliran Data:
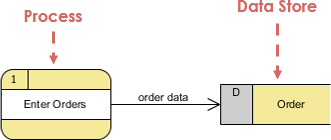
Notasi
- Garis lurus dengan panah masuk adalah aliran data masukan
- Garis lurus dengan panah keluar adalah aliran data keluaran
Perhatikan bahwa:
Karena setiap proses mengubah data dari satu bentuk ke bentuk lainnya, setidaknya satu aliran data harus masuk dan satu aliran data harus keluar dari setiap simbol proses.
Penyimpanan Data
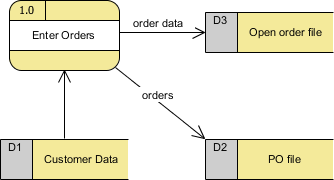
Sebuah penyimpanan data atau repositori data digunakan dalam diagram aliran data untuk merepresentasikan situasi ketika sistem harus menyimpan data karena satu atau lebih proses perlu menggunakan data yang disimpan di kemudian hari.
Notasi
- Data dapat ditulis ke dalam penyimpanan data, yang digambarkan dengan panah keluar
- Data dapat dibaca dari penyimpanan data, yang digambarkan dengan panah masuk.
- Contohnya adalah: inventaris, Piutang, Pesanan, dan Pembayaran Harian.

Contoh Penyimpanan Data
Perhatikan bahwa:
- Sebuah penyimpanan data harus terhubung ke proses dengan aliran data.
- Setiap penyimpanan data harus memiliki setidaknya satu aliran data masukan dan setidaknya satu aliran data keluaran (meskipun aliran data keluaran adalah pesan kontrol atau konfirmasi).
Entitas Eksternal
Entitas eksternal adalah orang, departemen, organisasi luar, atau sistem informasi lain yang menyediakan data ke sistem atau menerima keluaran dari sistem. Entitas eksternal adalah komponen di luar batas sistem informasi. Mereka mewakili bagaimana sistem informasi berinteraksi dengan dunia luar.
- Sebuah persegi panjang mewakili entitas eksternal
- Mereka baik menyediakan data atau menerima data
- Mereka tidak memproses data
Notasi
- Seorang pelanggan mengajukan pesanan dan kemudian menerima tagihan dari sistem
- Seorang vendor mengeluarkan faktur

Contoh Entitas Eksternal

Perhatikan bahwa:
- Entitas eksternal juga disebut terminator karena mereka adalah asal data atau tujuan akhir.
- Sebuah entitas eksternal harus terhubung ke proses melalui aliran data.
Aturan Aliran Data
Salah satu aturan untuk mengembangkan DFD adalah bahwa semua aliran harus dimulai dan diakhiri pada langkah pemrosesan. Ini cukup logis, karena data tidak dapat berubah dengan sendirinya tanpa diproses. Dengan menggunakan aturan jempol, cukup mudah untuk mengidentifikasi aliran data yang ilegal dan memperbaikinya dalam DFD.
Deskripsi Salah / Benar


Sebuah entitas tidak dapat memberikan data kepada entitas lain tanpa adanya pemrosesan yang terjadi.


Data tidak dapat berpindah langsung dari sebuah entitas ke sebuah cerita data tanpa diproses.


Data tidak dapat berpindah langsung dari sebuah penyimpanan data tanpa diproses.


Data tidak dapat berpindah langsung dari satu penyimpanan data ke penyimpanan data lainnya tanpa diproses.
Kesalahan lain yang sering dibuat dalam DFD
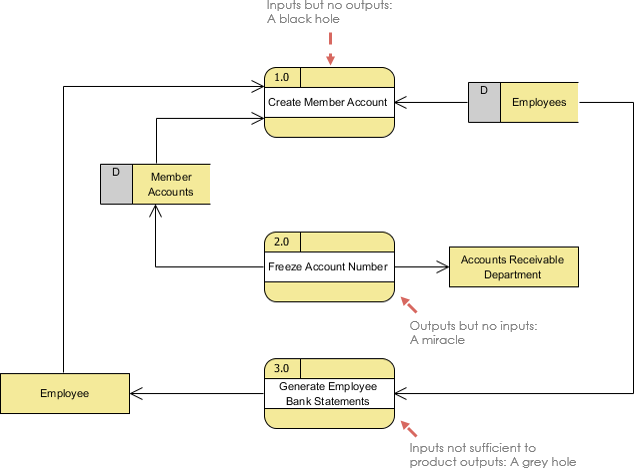
Kelas kedua kesalahan DFD muncul ketika keluaran dari satu langkah pemrosesan tidak cocok dengan inputnya dan dapat diklasifikasikan sebagai:
- Lubang hitam — Sebuah langkah pemrosesan mungkin memiliki aliran input tetapi tidak memiliki aliran output.
- Keajaiban — Sebuah langkah pemrosesan mungkin memiliki aliran output tetapi tidak memiliki aliran input.
- Lubang abu-abu — Sebuah langkah pemrosesan mungkin memiliki keluaran yang lebih besar daripada jumlah inputnya.
Alat UML Gratis
- Pembuat Diagram Aliran Data Daring
- Bagaimana Cara Membuat Diagram Aliran Data (DFD)?
- Perangkat Lunak Diagram Aliran Data (DFD)
Notasi DFD yang Berbeda
This post is also available in Deutsch, English, Español, فارسی, Français, 日本語, Polski, Portuguese, Ру́сский, Việt Nam, 简体中文 and 繁體中文.


