Yang Bahasa Pemodelan Terpadu (UML) adalah bahasa pemodelan umum yang digunakan dalam bidang rekayasa perangkat lunak, dirancang untuk memberikan pendekatan standar dalam memvisualisasikan desain sistem. Motivasi awal untuk menciptakan UML adalah keinginan untuk menstandarisasi berbagai sistem notasi dan metode desain perangkat lunak. Dalam UML, diagram kelas adalah salah satu enam jenis diagram struktur. Diagram kelas adalah dasar dari proses pemodelan objek dan memodelkan struktur statis dari sistem.
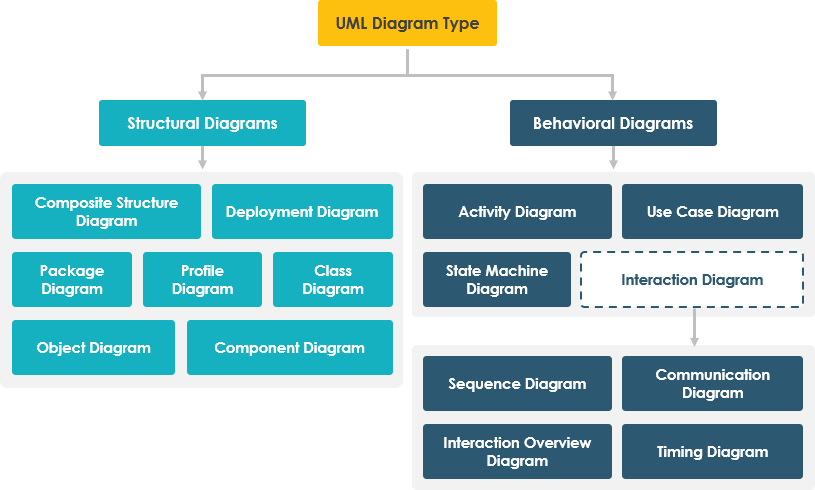
Diagram struktur menunjukkan struktur statis dari sistem dan bagiannya pada berbagai tingkat abstraksi dan implementasi serta bagaimana mereka saling terkait. Elemen dalam diagram struktur mewakili konsep-konsep bermakna dari sebuah sistem, dan dapat mencakup konsep abstrak, dunia nyata, dan implementasi, ada tujuh jenis diagram struktur sebagai berikut:
- Diagram Kelas
- Diagram Komponen
- Diagram Penempatan
- Diagram Objek
- Diagram Paket
- Diagram Struktur Komposit
- Diagram Profil
Apa itu Diagram Kelas?
Diagram kelas dalam Bahasa Pemodelan Terpadu (UML) adalah diagram struktur statis yang menggambarkan struktur sebuah sistem dengan menunjukkan kelas-kelasnya, atribut-atributnya, operasi (atau metode), dan hubungan antara objek.Diagram kelas adalah cetak biru untuk sebuah sistem atau subsistem. Anda dapat menggunakan diagram kelas untuk memodelkan objek-objek yang membentuk sistem, menunjukkan hubungan antara objek, dan menggambarkan peran objek-objek ini serta layanan yang mereka sediakan.
Asal Usul UML
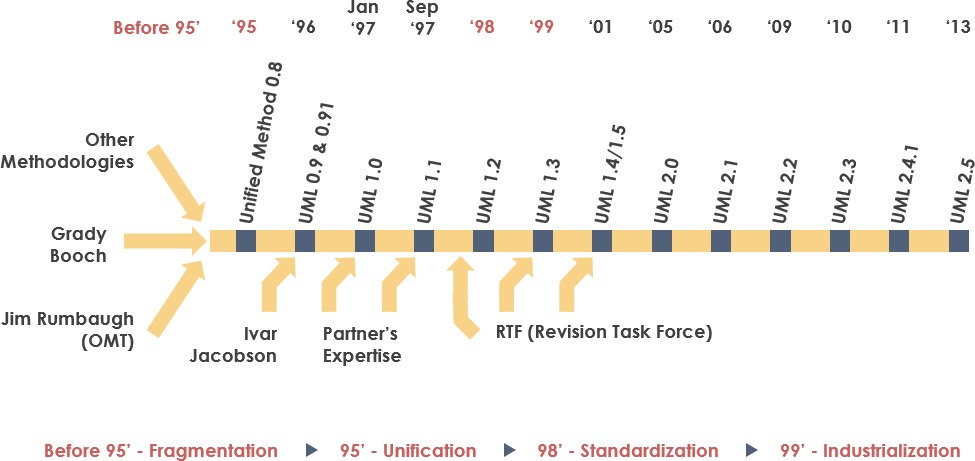
Tujuan UML adalah untuk menyediakan notasi standar yang dapat digunakan oleh semua metode berorientasi objek dan untuk memilih serta mengintegrasikan elemen terbaik dari notasi pendahulu. UML telah dirancang untuk berbagai aplikasi. Oleh karena itu, ia menyediakan konstruksi untuk berbagai sistem dan aktivitas (misalnya, sistem terdistribusi, analisis, desain sistem, dan penempatan).
UML adalah notasi yang dihasilkan dari unifikasi OMT dari
- Teknik Pemodelan Objek OMT [James Rumbaugh 1991] – adalah yang terbaik untuk analisis dan sistem informasi yang intensif data.
- Booch [Grady Booch 1994] – sangat baik untuk desain dan implementasi. Grady Booch telah bekerja secara luas dengan Bahasa Ada bahasa, dan telah menjadi pemain utama dalam pengembangan teknik Berorientasi Objek untuk bahasa tersebut. Meskipun metode Booch kuat, notasinya kurang diterima dengan baik (banyak bentuk awan mendominasi modelnya – tidak terlalu rapi)
- OOSE (Rekayasa Perangkat Lunak Berorientasi Objek [Ivar Jacobson 1992]) – menampilkan model yang dikenal sebagai Kasus Penggunaan. Kasus Penggunaan adalah teknik yang kuat untuk memahami perilaku seluruh sistem (sebuah area di mana OO secara tradisional lemah).
Pada tahun 1994, Jim Rumbaugh, pencipta OMT, mengejutkan dunia perangkat lunak ketika ia meninggalkan General Electric dan bergabung dengan Grady Booch di Rational Corp. Tujuan kemitraan ini adalah untuk menggabungkan ide-ide mereka menjadi satu metode yang terpadu (judul kerja untuk metode tersebut memang adalah “Metode Terpadu”).
Tujuan Diagram Kelas
Diagram kelas berguna dalam banyak fase desain sistem. Selama fase analisis, diagram kelas dapat membantu Anda memahami persyaratan dari domain masalah dan mengidentifikasi komponennya. Dalam proyek perangkat lunak berorientasi objek, diagram kelas yang dibuat pada tahap awal proyek berisi kelas-kelas yang sering diubah menjadi kelas dan objek perangkat lunak yang sebenarnya saat menulis kode.
Kemudian, Anda dapat menyempurnakan analisis awal dan model konseptual menjadi diagram kelas untuk menunjukkan bagian-bagian tertentu dari sistem, antarmuka pengguna, implementasi logika, dan seterusnya.
Diagram kelas banyak digunakan dalam pemodelan sistem berorientasi objek karena mereka adalah satu-satunya diagram UML yang dapat dipetakan langsung ke bahasa berorientasi objek. Selama fase implementasi dari siklus pengembangan perangkat lunak, Anda dapat menggunakan diagram kelas untuk mengubah model menjadi kode dan kode menjadi model.
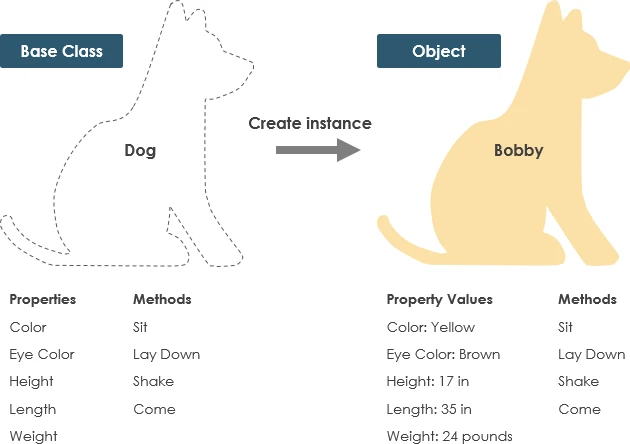
Contoh Kelas
Seekor anjing memiliki keadaan – warna, nama, ras serta perilaku – mengibaskan, menggonggong, makan. Sebuah objek adalah instansi dari sebuah kelas.
Notasi Kelas UML
Sebuah kelas mewakili sebuah konsep yang mengenkapsulasi keadaan (atribut) dan perilaku (operasi. Setiap atribut memiliki tipe. Setiap operasi has a tanda tangan. Nama kelas adalah satu-satunya informasi yang wajib.

Nama Kelas:
- Nama kelas muncul di bagian pertama.
Atribut Kelas:
- Atribut ditampilkan di bagian kedua.
- Tipe atribut ditampilkan setelah titik dua.
- Atribut dipetakan ke variabel anggota (anggota data) dalam kode.
Operasi Kelas (Metode):
- Operasi ditampilkan di bagian ketiga. Mereka adalah layanan yang disediakan kelas.
- Tipe pengembalian dari sebuah metode ditampilkan setelah titik dua di akhir tanda tangan metode.
- Tipe pengembalian dari parameter metode ditampilkan setelah titik dua mengikuti nama parameter. Operasi dipetakan ke metode kelas dalam kode

Hubungan Kelas
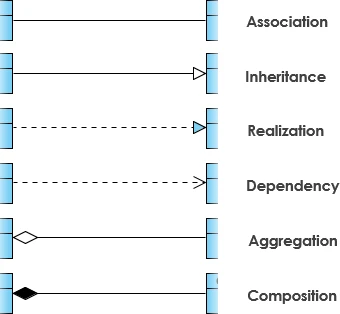
Sebuah kelas dapat terlibat dalam satu atau lebih hubungan dengan kelas lain. Sebuah hubungan dapat berupa salah satu dari jenis berikut: (Lihat gambar di sebelah kanan untuk representasi grafis dari hubungan).
| Jenis Hubungan | Representasi Grafis |
|---|---|
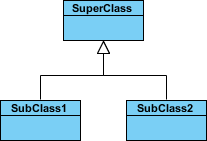
Pewarisan (atau Generalisasi):
|
 |
Asosiasi Sederhana
|
 |
| Agregasi
Sebuah jenis asosiasi khusus. Ini mewakili hubungan “bagian dari”.
|
 |
| Komposisi:
Sebuah jenis agregasi khusus di mana bagian-bagian dihancurkan ketika keseluruhan dihancurkan.
|
 |
Ketergantungan
|
 |
Nama Hubungan
- Nama-nama hubungan ditulis di tengah garis asosiasi.
- Nama hubungan yang baik masuk akal ketika Anda membacanya dengan keras:
- “Setiap spreadsheet mengandung beberapa jumlah sel”,
- “sebuah ekspresi dievaluasi menjadi sebuah nilai”
- Mereka sering memiliki ujung panah kecil untuk menunjukkan arah arah mana untuk membaca hubungan, misalnya, ekspresi dievaluasi menjadi nilai, tetapi nilai tidak dievaluasi menjadi ekspresi.
Hubungan – Peran
- Sebuah peran adalah tujuan arah dari sebuah asosiasi.
- Peran ditulis di ujung garis asosiasi dan menggambarkan tujuan yang dimainkan oleh kelas tersebut dalam hubungan.
- Misalnya, sebuah sel terkait dengan sebuah ekspresi. Sifat hubungan tersebut adalah bahwa ekspresi adalah rumus dari sel tersebut.
Visibilitas atribut dan operasi Kelas
Dalam desain berorientasi objek, ada notasi visibilitas untuk atribut dan operasi. UML mengidentifikasi empat jenis visibilitas: publik, terlindungipribadi, dan paket.
Simbol +, -, # dan ~ sebelum nama atribut dan operasi dalam sebuah kelas menunjukkan visibilitas atribut dan operasi.
- + menunjukkan atribut atau operasi publik
- – menunjukkan atribut atau operasi pribadi
- # menunjukkan atribut atau operasi terlindungi
- ~ menunjukkan atribut atau operasi paket
Contoh Visibilitas Kelas
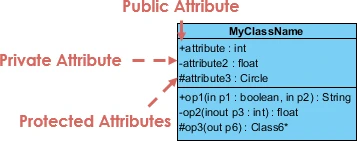
Dalam contoh di atas:
- atribut1 dan op1 dari MyClassName adalah publik
- atribut3 dan op3 terlindungi.
- atribut2 dan op2 adalah pribadi.
Akses untuk masing-masing jenis visibilitas ini ditunjukkan di bawah untuk anggota kelas yang berbeda.
| Hak Akses | publik (+) | pribadi (-) | terlindungi (#) | Paket (~) |
|---|---|---|---|---|
| Anggota kelas yang sama | ya | ya | ya | ya |
| Anggota kelas turunan | ya | tidak | ya | ya |
| Anggota kelas lainnya | ya | tidak | tidak | dalam paket yang sama |
Multiplikasi
Berapa banyak objek dari setiap kelas yang berpartisipasi dalam hubungan dan multiplikasi dapat dinyatakan sebagai:
- Tepat satu – 1
- Nol atau satu – 0..1
- Banyak – 0..* atau *
- Satu atau lebih – 1..*
- Jumlah Tepat – misalnya 3..4 atau 6
- Atau hubungan kompleks – misalnya 0..1, 3..4, 6.* akan berarti jumlah objek apa pun selain 2 atau 5
Contoh Multiplikasi
- Persyaratan: Seorang Siswa dapat mengambil banyak Kursus dan banyak Siswa dapat terdaftar dalam satu Kursus.
- Dalam contoh di bawah ini, diagram kelas (di sebelah kiri), menggambarkan pernyataan persyaratan di atas untuk model statis sementara diagram objek (di sebelah kanan) menunjukkan snapshot (sebuah instance dari diagram kelas) dari pendaftaran kursus untuk kursus Rekayasa Perangkat Lunak dan Manajemen Basis Data masing-masing)


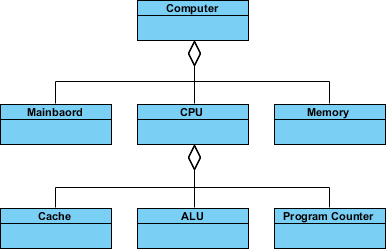
Contoh Agregasi – Komputer dan bagian-bagiannya
- Agregasi adalah kasus khusus dari asosiasi yang menunjukkan hierarki “terdiri dari”
- Agregat adalah kelas induk, komponen adalah kelas anak
Contoh Pewarisan – Taksonomi Sel
- Pewarisan adalah kasus khusus lain dari asosiasi yang menunjukkan hierarki “jenis dari”
- Pewarisan menyederhanakan model analisis dengan memperkenalkan taksonomi
- Kelas anak mewarisi atribut dan operasi dari kelas induk.
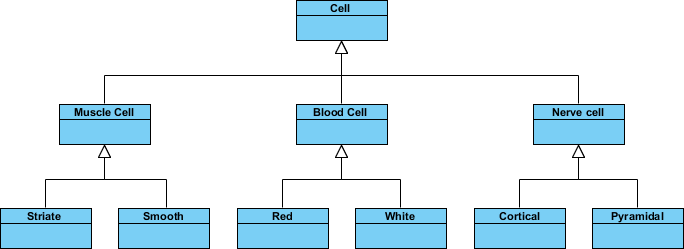
Diagram Kelas – Contoh Alat Diagram
Diagram kelas juga dapat memiliki catatan yang dilampirkan pada kelas atau hubungan. Catatan ditampilkan dalam warna abu-abu.
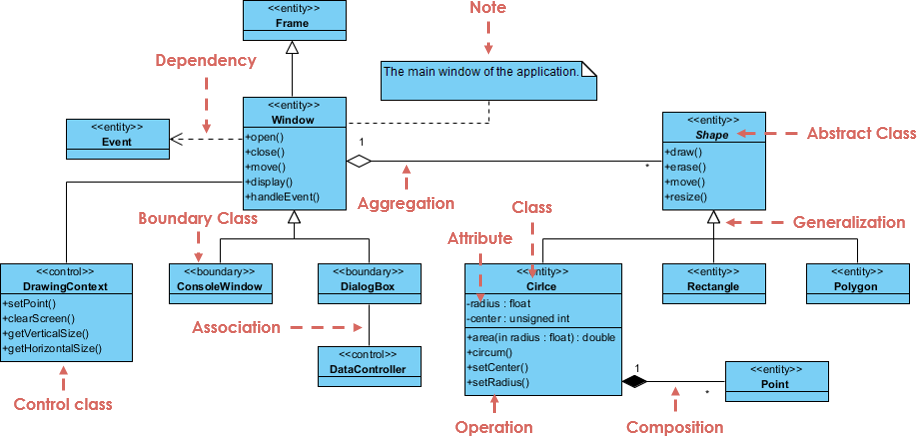
Dalam contoh di atas:
Kita dapat menginterpretasikan arti dari diagram kelas di atas dengan membaca poin-poin sebagai berikut.
- Bentuk adalah kelas abstrak. Ini ditampilkan dalam huruf miring.
- Bentuk adalah kelas super. Lingkaran, Persegi Panjang, dan Poligon diturunkan dari Bentuk. Dengan kata lain, Lingkaran adalah Bentuk. Ini adalah hubungan generalisasi / pewarisan.
- Ada asosiasi antara DialogBox dan DataController.
- Bentuk adalah bagian dari Jendela. Ini adalah hubungan agregasi. Bentuk dapat ada tanpa Jendela.
- Titik adalah bagian dari Lingkaran. Ini adalah hubungan komposisi. Titik tidak dapat ada tanpa Lingkaran.
- Jendela bergantung pada Acara. Namun, Acara tidak bergantung pada Jendela.
- Atribut dari Lingkaran adalah jari-jari dan pusat. Ini adalah kelas entitas.
- Nama metode dari Lingkaran adalah area(), circum(), setCenter() dan setRadius().
- Parameter jari-jari dalam Lingkaran adalah parameter masuk dari tipe float.
- Metode area() dari kelas Lingkaran mengembalikan nilai dari tipe double.
- Atribut dan nama metode dari Persegi Panjang disembunyikan. Beberapa kelas lain dalam diagram juga memiliki atribut dan nama metode mereka yang disembunyikan.
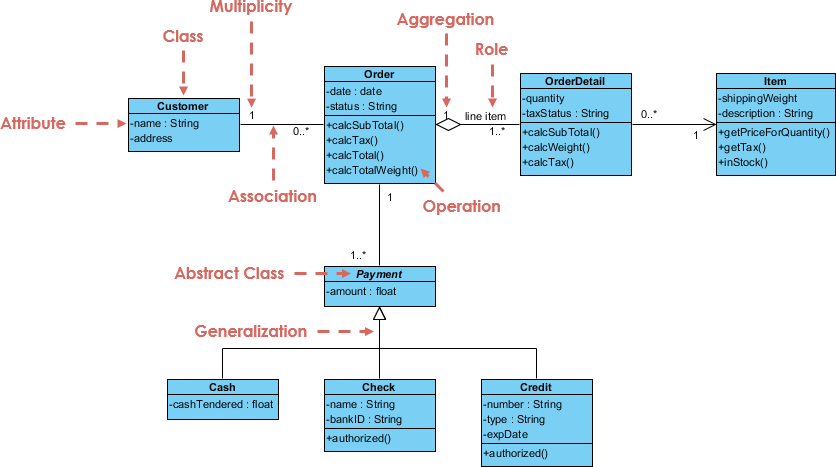
Contoh Diagram Kelas: Sistem Pemesanan
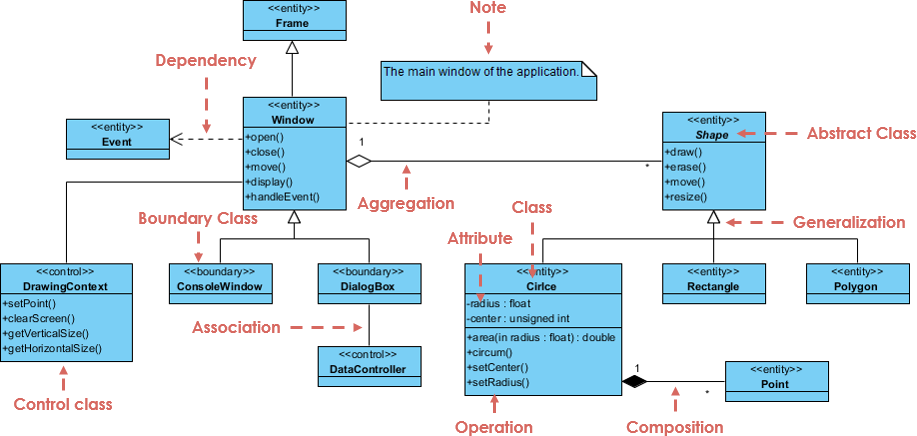
Contoh Diagram Kelas: GUI
Diagram kelas juga dapat memiliki catatan yang dilampirkan pada kelas atau hubungan.
Menghadapi Sistem Kompleks – Diagram Kelas Ganda atau Tunggal?
Tak terhindarkan, jika Anda sedang memodelkan sistem besar atau area bisnis besar, akan ada banyak entitas yang harus Anda pertimbangkan. Haruskah kita menggunakan diagram kelas ganda atau tunggal untuk memodelkan masalah ini? Jawabannya adalah:
- Alih-alih memodelkan setiap entitas dan hubungannya pada satu diagram kelas, lebih baik menggunakan beberapa diagram kelas.
- Membagi sistem menjadi beberapa diagram kelas membuat sistem lebih mudah dipahami, terutama jika setiap diagram adalah representasi grafis dari bagian tertentu dari sistem.
Perspektif Diagram Kelas dalam Siklus Hidup Pengembangan Perangkat Lunak
Kita dapat menggunakan diagram kelas dalam berbagai fase pengembangan dari sebuah siklus hidup pengembangan perangkat lunak dan biasanya dengan memodelkan diagram kelas dalam tiga perspektif berbeda (tingkat detail) secara bertahap saat kita maju:
Perspektif Konseptual: Diagram-diagram tersebut diinterpretasikan sebagai menggambarkan hal-hal di dunia nyata. Jadi, jika Anda mengambil perspektif konseptual, Anda menggambar diagram yang mewakili konsep-konsep dalam domain yang sedang dipelajari. Konsep-konsep ini akan secara alami terkait dengan kelas-kelas yang mengimplementasikannya. Perspektif konseptual dianggap independen bahasa.
Perspektif Spesifikasi: Diagram-diagram tersebut diinterpretasikan sebagai menggambarkan abstraksi perangkat lunak atau komponen dengan spesifikasi dan antarmuka tetapi tanpa komitmen pada implementasi tertentu. Jadi, jika Anda mengambil perspektif spesifikasi, kita melihat antarmuka perangkat lunak, bukan implementasinya.
Perspektif Implementasi: Diagram-diagram tersebut diinterpretasikan sebagai menggambarkan implementasi perangkat lunak dalam teknologi tertentu dan bahasa.. Jadi, jika Anda mengambil perspektif implementasi, kita melihat implementasi perangkat lunak..
Mencari alat pemodelan diagram kelas gratis?
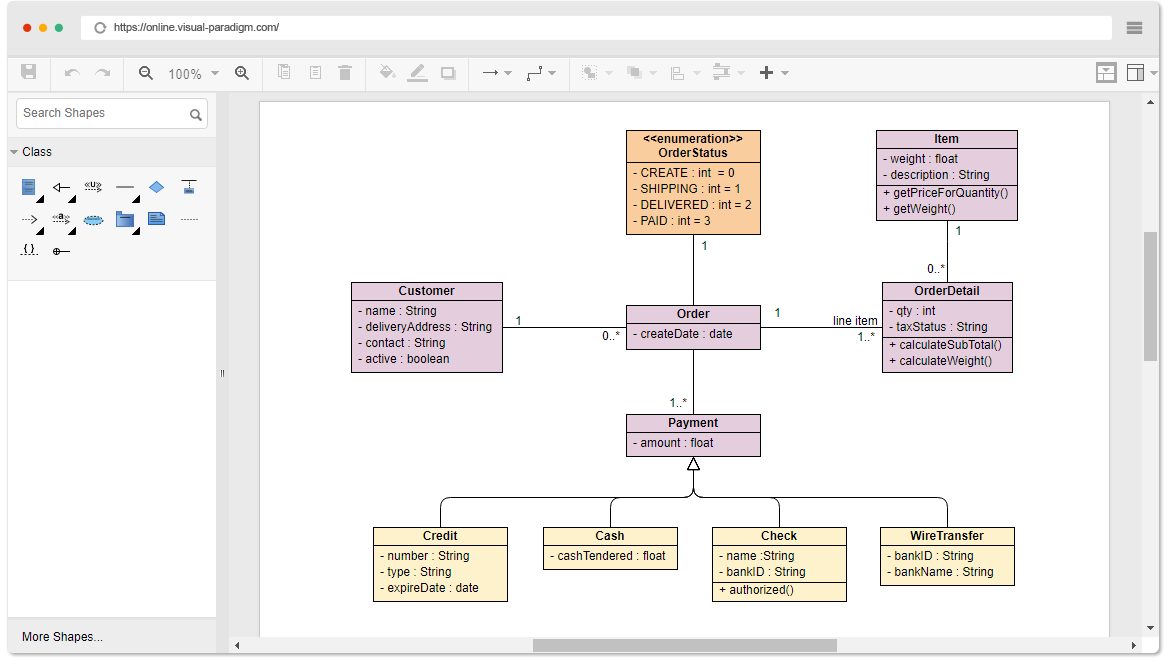
Visual Paradigm Online (VP Online) Edisi Gratis adalah perangkat lunak menggambar online gratis yang mendukung diagram kelas, diagram UML lainnya, alat ERD, dan alat bagan organisasi. Ini memiliki editor yang sederhana namun kuat yang memungkinkan Anda untuk membuat diagram kelas dengan cepat dan mudah. Editor UML gratis ini tidak memiliki iklan, tidak ada batas waktu akses, dan tidak ada batasan, misalnya, pada jumlah diagram, jumlah bentuk, dll. Anda memiliki diagram yang Anda buat untuk tujuan pribadi dan non-komersial.
Mencari pemodelan UML yang lebih formal di desktop Anda?
Visual Paradigm Community Edition diluncurkan sejak 2004 untuk menyediakan perangkat lunak UML gratis untuk tujuan non-komersial semata, mendukung pengguna yang sedang mengambil langkah pertama dalam pemodelan UML, dan yang membutuhkan perangkat lunak pemodelan UML gratis dan lintas platform untuk penggunaan pribadi, seperti menerapkan UML pada proyek mahasiswa.
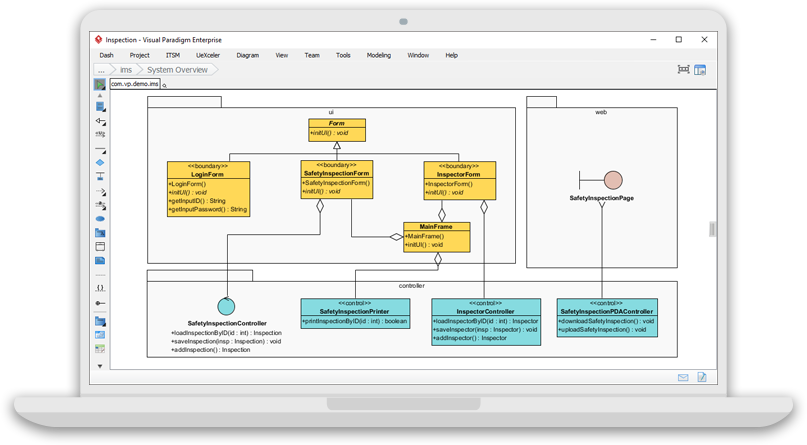
Alat pemodelan UML gratis untuk semua jenis tujuan non-komersial. Mendukung 13 diagram UML 2.x

Kami telah diadopsi oleh lebih dari 1 Juta instalasi di seluruh dunia, dan masih terus berkembang. Banyak orang menggunakan edisi berbayar Visual Paradigm untuk menggambar diagram UML dan ERD profesional untuk desain & analisis sistem dan basis data, setiap hari.
Alasan 2
Dipercaya oleh profesional TI dan organisasi besar
Banyak organisasi blue chip, perusahaan TI, konsultan, universitas, LSM, dan unit pemerintah di seluruh dunia telah mengadopsi Visual Paradigm (edisi berbayar). Gambar di bawah ini menunjukkan beberapa pelanggan berbayar kami.

Alasan 3
Kualitas tinggi – Pemenang penghargaan
Kami tidak hanya dipercaya oleh perusahaan-perusahaan terkenal di seluruh dunia, tetapi juga oleh industri. Visual Paradigm adalah pemenang berbagai penghargaan internasional.

Alasan 4
Platform pemodelan yang paling banyak digunakan untuk akademisi
Alat UML yang paling banyak digunakan untuk akademisi, diadopsi oleh ribuan Universitas dan Perguruan Tinggi.

Alasan 5
Koleksi besar sumber daya pembelajaran GRATIS (didukung oleh Lingkaran Komunitas VP)
Ratusan contoh UML dan ERDsiap untuk diimpor ke dalam Visual Paradigm untuk eksperimen instan atau untuk memulai model UML Anda sendiri. Semua GRATIS.
Alasan 6
Jalur peningkatan ke edisi komersial untuk spektrum aplikasi dan kemungkinan yang luas
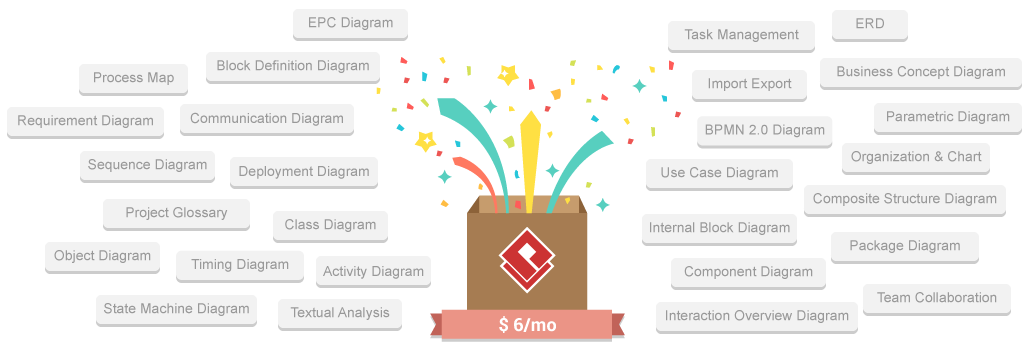
Peningkatan mudah untuk sekumpulan besar fitur tambahan (misalnya, dukungan BPMN dan kolaborasi tim) dan untuk penggunaan komersial, mulai dari $6 / bulan
Alasan 7
Forum pengguna aktif untuk mendapatkan bantuan dan bertukar ide & pengalaman
Dukung, bagikan, dan tukar ide Anda dengan orang lain di Visual Paradigmforum pengguna aktif Visual Paradigm..
Alasan 8
Aplikasi lintas platform, ramah pengguna, cepat & responsif
Visual Paradigm dapat berjalan di berbagai platform seperti Windows, Linux, dan Mac. Antarmukanya yang intuitif dan fitur pemodelan yang kuat membuat pemodelan cepat dan mudah!

Referensi
- Apa itu UML?
- Mengapa Pemodelan UML?
- Ikhtisar 14 Jenis Diagram UML
- Apa itu Diagram Kelas?
- Apa itu Diagram Komponen?
- Apa itu Diagram Penyebaran?
- Apa itu Diagram Objek?
- Apa itu Diagram Paket?
- Apa itu Diagram Struktur Komposit?
- Apa itu Diagram Profil?
- Apa itu Diagram Kasus Penggunaan?
- Apa itu Diagram Aktivitas?
- Apa itu Diagram Mesin Status?
- Apa itu Diagram Urutan?
- Apa itu Diagram Komunikasi?
- Apa itu Diagram Ikhtisar Interaksi?
- Apa itu Diagram Waktu
This post is also available in Deutsch, English, Español, فارسی, Français, 日本語, Polski, Portuguese, Ру́сский, Việt Nam, 简体中文 and 繁體中文.


