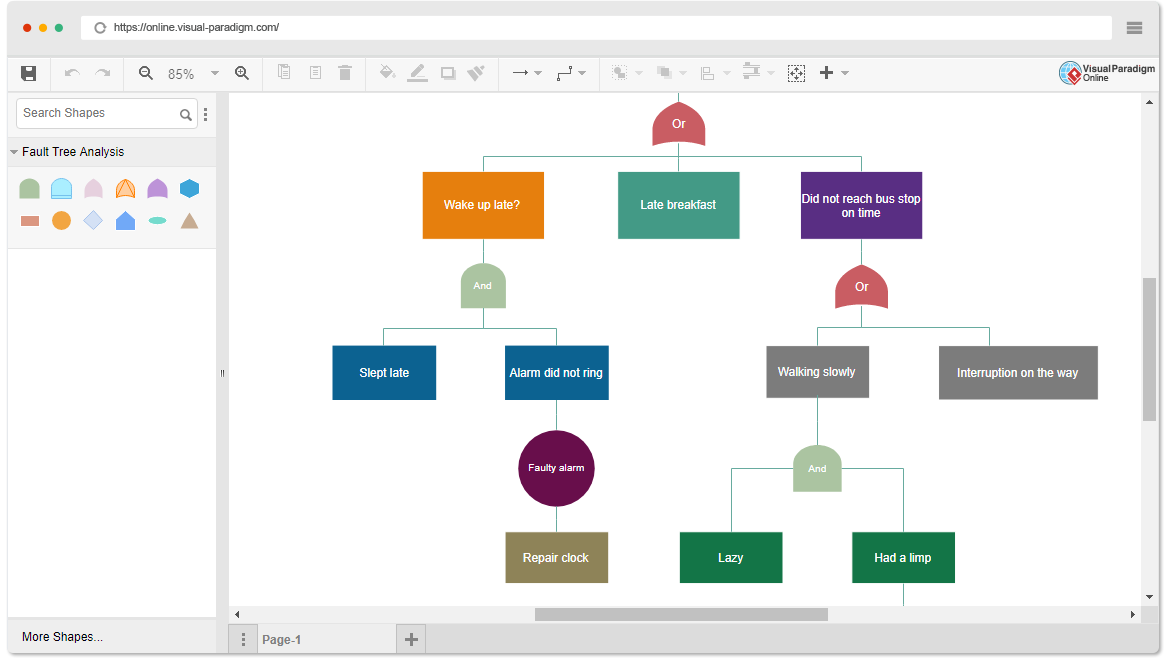
Fault tree analysis (FTA) is a top-down deductive fault analysis in which Boolean logic is used in conjunction with a series of low-level events to analyze the unexpected states of the system. This analysis method is primarily used in safety engineering and reliability engineering to understand how systems fail, determine the best way to reduce risk, and determine (or feel) the event rate of safety incidents or specific system-level (functional) failures.
Continue readingPenulis: vpadmin
Simple Thinking Tools: T charts and Y charts
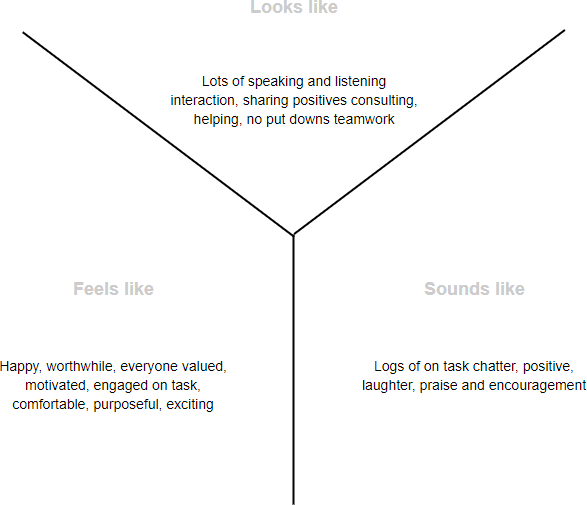
Both T-charts and Y-charts help to graphically organize and record ideas, feelings and information, while identifying and focusing on what teachers / students already know, understand, value and can do. It enables students / teachers / teachers to compare and contrast ideas, feelings and information in various context.
Continue readingWhat is Interrelationship Diagram?
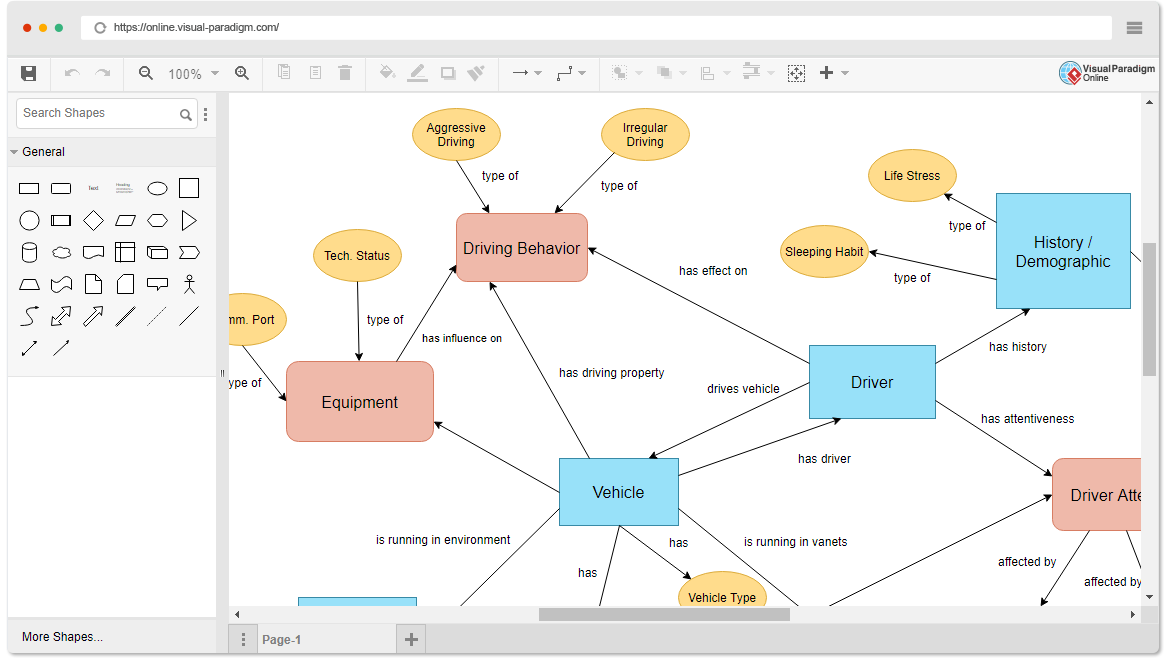
An Interrelationship Diagram is a visual display that maps out the cause and effect links among complex, multivariable problems or desired outcomes. With the linked connections, you can better analyze the cause-and-effect relationships that exist among all factors of a complex situation
Continue readingWhat is Hexagonal Architecture Diagram
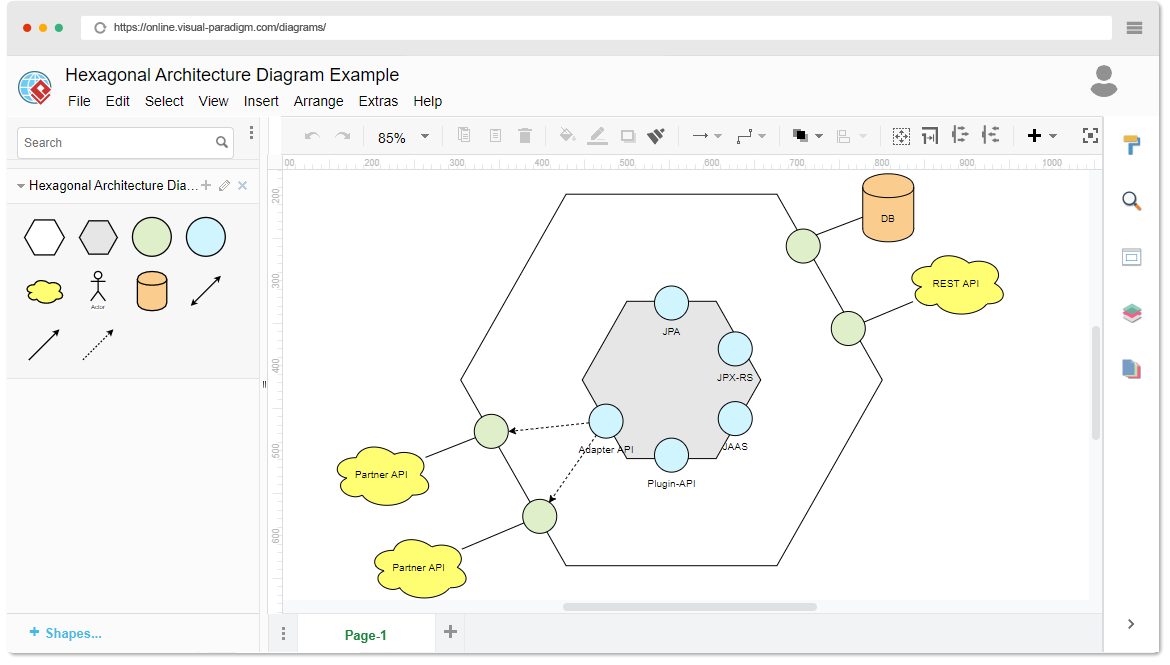
Hexagonal architecture diagram is an architectural pattern used in software design aiming at creating loosely coupled application components. This approach is an alternative to the traditional layered architecture. It is one of the many forms of DDD (Domain Driven Design Architecture).
Continue readingThe Best Continuous Improvement Tool: What is SIPOC?
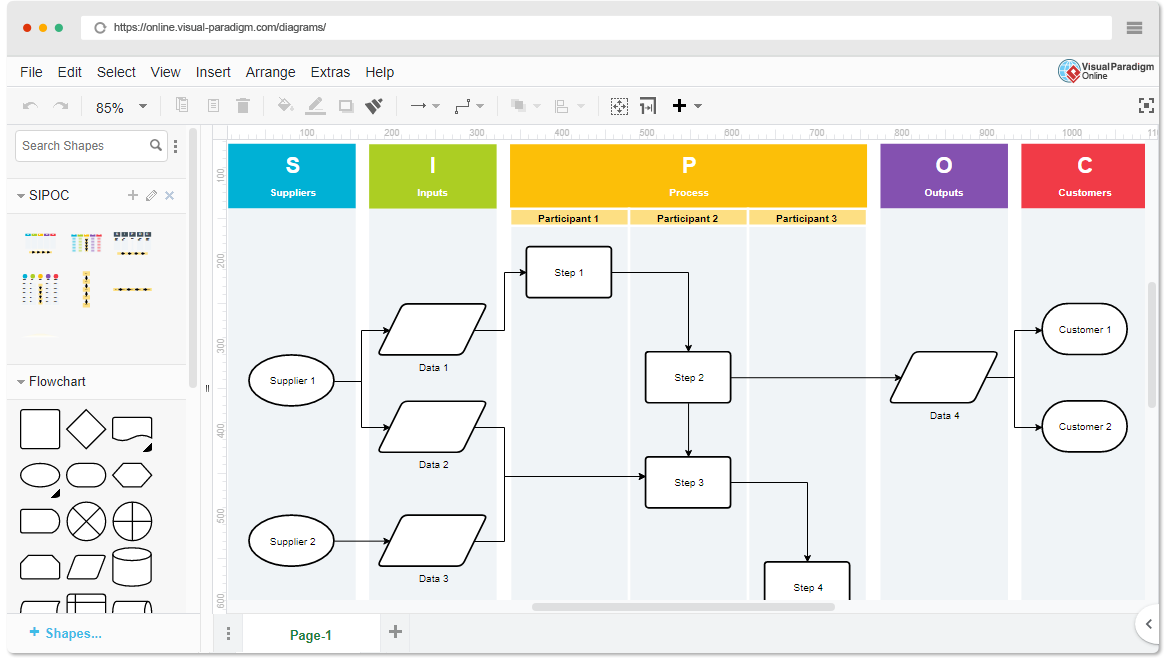
The acronym SIPOC stands for Suppliers, Inputs, Process, Outputs, and Customer. Using information from these five areas creates a process map that gives a high-level overview of a Six Sigma project. To create a SIPOC diagram, you have to specify the five main activities of the process and identify the potential suppliers, inputs, outputs, and customers.
Continue readingCritical Thinking: What is Y-Chart?
The Y-Chart is a graph consisting of three parts which can help organize the understanding of the subject by writing down and/or drawing the look, feel and sound of the subject. (1) What Does It Look Like? (2) What Does It Feel Like? (3) What Does It Sound Like?
Continue readingWhat is Value Stream Mapping?
Value stream mapping is a technique to identify and eliminate process waste. It is a special type of flow chart that uses symbols called “lean language” to describe and improve inventory and information flow. It helps us provide customers with the best value through a complete value creation process and minimize waste
Continue readingPERT Chart Tutorial
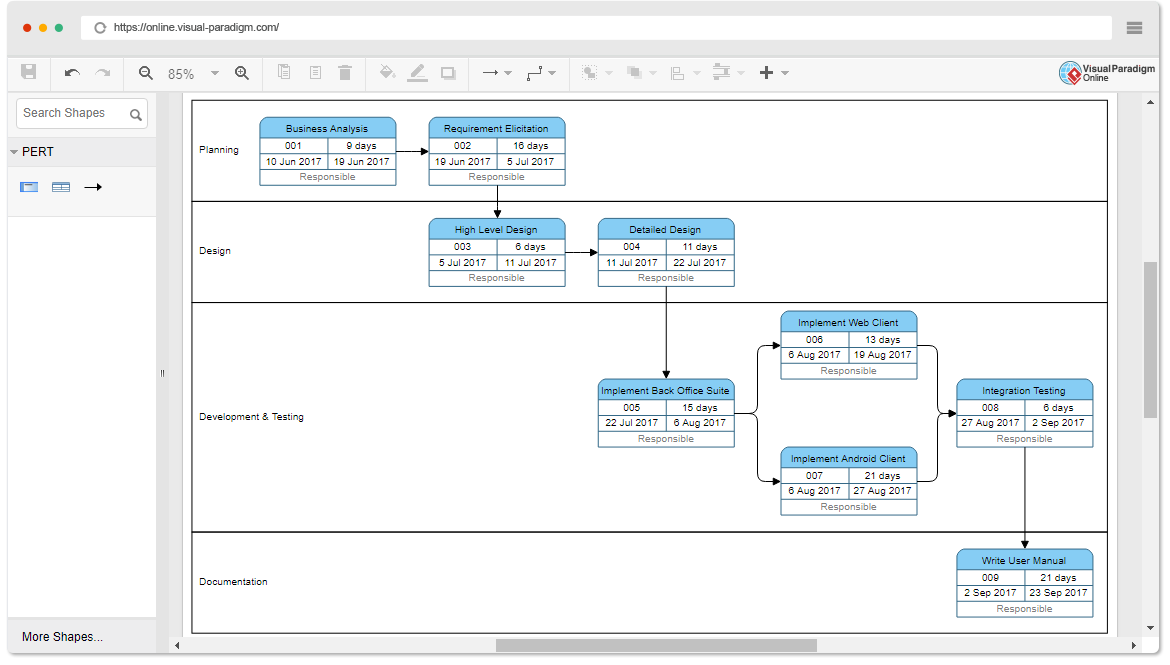
PERT Chart is acronym for (Program Evaluation and Review Technique). A PERT chart is a project management tool used to schedule, organize, and coordinate tasks within a project. It is basically a method to analyze the tasks involved in completing a given project, especially the time needed to complete each task, and to identify the minimum time needed to complete the total project.
Continue readingWhat is Self Management Approach?
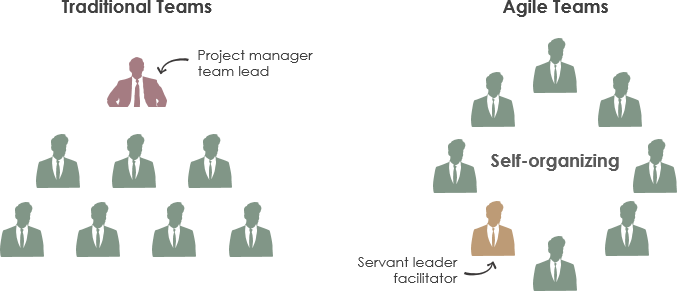
A self-managed team is a group of employees who are responsible for all or most aspects of producing a product or service. The self-managed team is the basic unit of the new horizontal organization. Self-managed teams are an outgrowth of the earlier team approach.
Continue readingWhat is a Sprint in Scrum?
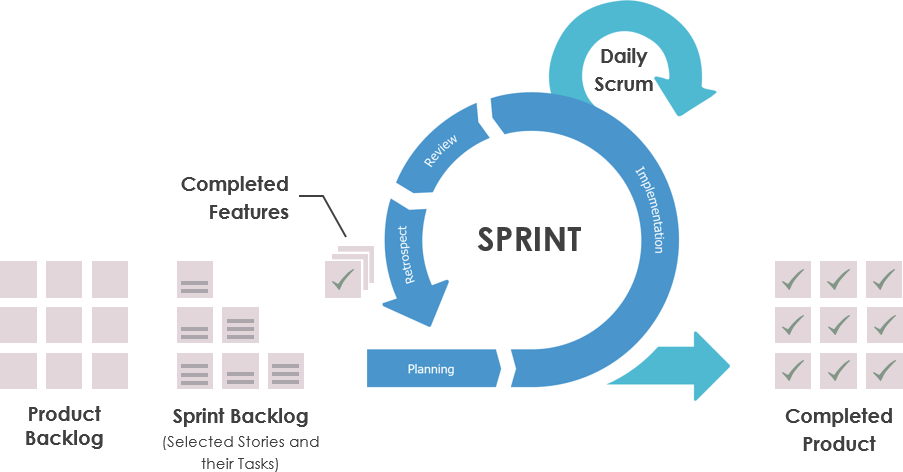
Sprint is one timeboxed iteration of a continuous development cycle. Within a Sprint, planned amount of work has to be completed by the team and made ready for review. Scrum projects are broken down into small and consistent time intervals referred to as sprints. They can be as short as a few days and generally are no longer than 3–4 weeks.
Continue reading