Diagram Aliran Data(DFD) mewakili aliran informasi melalui sistem. DFD dengan cepat menjadi cara populer untuk memvisualisasikan langkah-langkah utama dan data yang terlibat dalam proses sistem perangkat lunak.
Diagram aliran data (DFD) adalah cara untuk mewakili aliran data dari suatu proses atau sistem (biasanya sistem informasi), misalnya:
- Dari Mana Data Berasal?
- Kemana Data Pergi?
- Bagaimana Data Disimpan?
Dengan kata lain, ini menunjukkan bagaimana data diproses oleh sistem dalam hal input dan output menggunakan teknik dekomposisi top-down (atau dikenal sebagai penyempurnaan bertahap).
Apa itu Penyempurnaan Bertahap?
Salah satu cara efektif untuk menyelesaikan masalah kompleks adalah dengan memecahnya menjadi sub-masalah yang lebih sederhana. Anda mulai dengan memecah seluruh tugas menjadi bagian-bagian yang lebih sederhana.
Penyempurnaan langkah demi langkah pada dasarnya adalah dekomposisi sistem untuk mendapatkan wawasan tentang subsistem yang membentuk sistem, yang dikenal sebagai metode dekomposisi top-down.
Sebagai contoh, gambaran umum sistem dikembangkan sebagaidiagram konteks sistemyang menentukan, tetapi tidak menentukan, tingkat mana pun dari subsistem. Setiap subsistem ini kemudian disempurnakan menjadi detail yang lebih besar (seperti tingkat 0, 1, 2, dan seterusnya dalam DFD), terkadang pada banyak tingkat subsistem tambahan, sampai seluruh spesifikasi dikurangi menjadi elemen dasar.
Seperti biasa, sesi curah pendapat telah menghasilkan ide-ide (sebenarnya, hal-hal untuk daftar tugas kita) yang berada pada tingkat “detail” yang berbeda—beberapa di antaranya berada di “tingkat yang lebih rendah” daripada yang lain, atau, kita bisa katakan, beberapa mengandung yang lain.
Mari kita susun ini secara hierarkis. Dengan kata lain, mari kita identifikasi langkah-langkah mana yang merupakan bagian dari langkah lain. Salah satu cara untuk melakukan ini adalah dengan memikirkan setiap tindakan sebagai satu set tindakan.
Contoh Penyempurnaan Bertahap
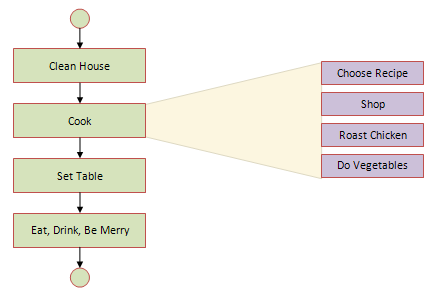
Bersihkan rumah
{Vakum ruang makan, Rapikan ruang tamu}
Masak
{Pilih resep, Belanja bahan, Panggang Ayam. Siapkan Sayuran}
Siapkan Meja
Cari taplak meja, Keluarkan piring, Siapkan gelas, Siapkan peralatan makan, Serbet
Panggang ayam
{Panaskan oven hingga400 , Masukkan ayam ke dalam wajan, Biarkan ayam di dalam400 oven selama90 menit}
Siapkan Sayuran
Cincang sayuran, Masak sayuran
(*Sumber: Desain top-down dan penyempurnaan bertahap — Buku Wiki)
Setelah elemen dasar ini diidentifikasi, kita dapat membangunnya menjadi modul komputer. Setelah mereka dibangun, kita dapat menyatukannya dan membuat seluruh sistem dari komponen individu ini.
Teknik Dekomposisi Top-Down dalam DFD
Dalam DFD,dekomposisi top-down(juga disebut leveling atau penyempurnaan bertahap) adalah teknik yang digunakan untuk menunjukkan lebih banyak detail dalam DFD tingkat rendah. Leveling dilakukan dengan menggambar serangkaian diagram yang semakin rinci sampai tingkat detail yang diinginkan tercapai. Seperti yang ditunjukkan pada Gambar, Leveling DFD pertama-tama menampilkan sistem yang ditargetkan sebagai satu proses, dan kemudian menunjukkan lebih banyak detail sampai semua proses menjadi primitif fungsional.
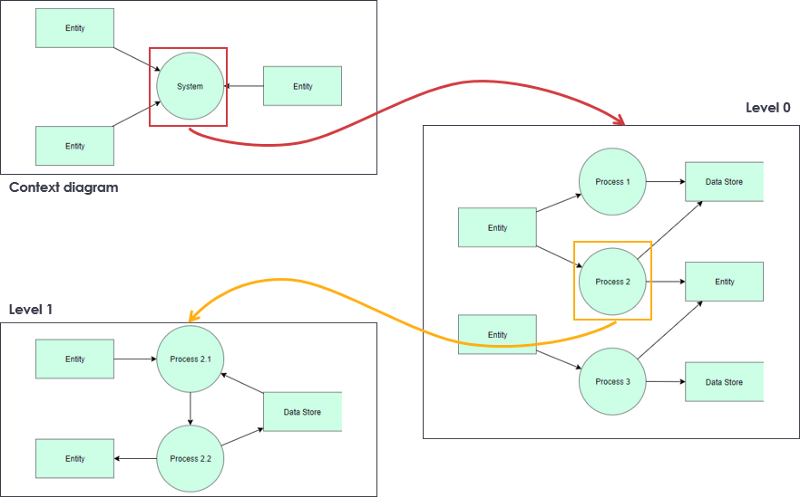
- DFD yang Berada pada Tingkat yang Lebih Tinggi Lebih Sedikit Rinci
- DFD Tingkat Tinggi Harus Dekomposisi Menjadi DFD yang Lebih Rinci di Tingkat yang Lebih Rendah
- Diagram Konteks adalah yang tertinggi dalam hierarki (Lihat Aturan Pembuatan DFD). Tingkat Nol yang disebut diikuti oleh DFD 0, dimulai dengan Penomoran Proses (Misalnya, Proses 1, Proses 2).
- Selanjutnya, yang disebut sebagai Tingkat Pertama — DFD 1 — Penomoran Berlanjut. Misalnya, Proses 1 Dibagi Menjadi Tiga Tingkat Pertama Dari DFD, Yang Dinomori 1.1, 1.2 Dan 1.3.
- Demikian pula, Proses Di Tingkat Kedua (DFD 2) Dinomori Misalnya 1.1.1, 1.1.2, 1.1.3 Dan 1.1.4.
- Jumlah Tingkat Bergantung Pada Ukuran Sistem Model. Setiap Proses Di Tingkat 0 Mungkin Tidak Memiliki Jumlah Tingkat Dekompisi Yang Sama.
Contoh DFD — Contoh Sistem Layanan Pelanggan
Diagram aliran data adalah hierarki diagram yang terdiri dari:
- Diagram Konteks (secara konseptual tingkat nol)
- DFD Tingkat-1
- Dan kemungkinan DFD Tingkat-2 dan tingkat dekomposisi fungsional lebih lanjut tergantung pada kompleksitas sistem Anda
DFD Konteks
Gambar di bawah ini menunjukkan Diagram Aliran Data konteks yang digambar untuk Sistem Layanan Pelanggan perusahaan kereta api. Ini berisi sebuah proses (bentuk) yang mewakili sistem untuk dimodelkan, dalam hal ini, “Sistem CS“. Ini juga menunjukkan peserta yang akan berinteraksi dengan sistem, yang disebut entitas eksternal. Dalam contoh ini, Asisten CS dan Penumpang adalah dua entitas yang akan berinteraksi dengan sistem. Di antara proses dan entitas eksternal, terdapat aliran data (penghubung) yang menunjukkan adanya pertukaran informasi antara entitas dan sistem.

Edit contoh DFD Yourdon dan Coad ini
DFD Konteks adalah pintu masuk dari model aliran data. Ini berisi satu dan hanya satu proses dan tidak menunjukkan penyimpanan data.
DFD Tingkat 1
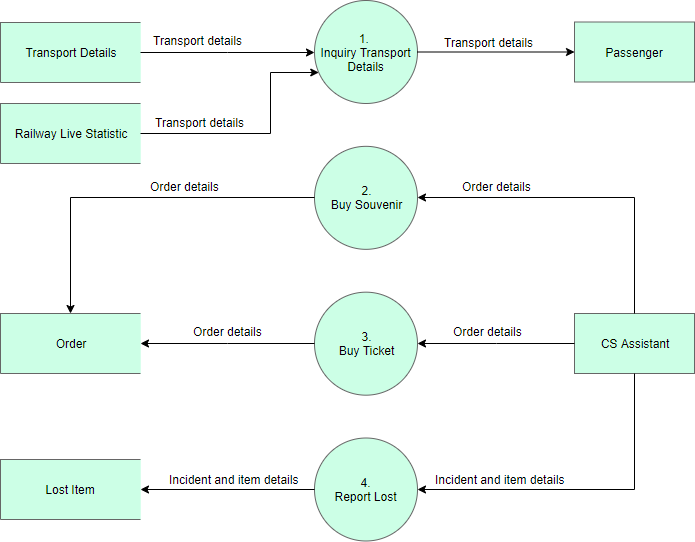
Gambar di bawah ini menunjukkan DFD tingkat 1, yang merupakan dekomposisi (yaitu, pemecahan) dari proses Sistem CS yang ditunjukkan dalam DFD konteks. Bacalah diagram tersebut dan kemudian kami akan memperkenalkan beberapa konsep kunci berdasarkan diagram ini.
Edit contoh Diagram Yourdon dan Coad ini
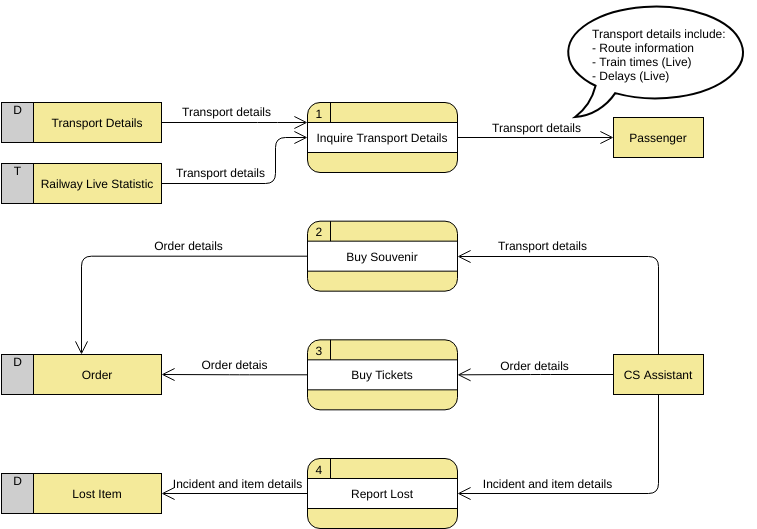
Contoh Diagram Aliran Data Sistem CS mengandung empat proses, dua entitas eksternal, dan empat penyimpanan data. Meskipun tidak ada pedoman desain yang mengatur posisi bentuk dalam Diagram Aliran Data, kami cenderung menempatkan proses di tengah dan penyimpanan data serta entitas eksternal di sisi untuk memudahkan pemahaman.
Berdasarkan diagram, kita tahu bahwa seorang Penumpang dapat menerima Detail transportasi dari Proses Inquiry Detail Transportasi proses, dan detailnya disediakan oleh penyimpanan data Detail Transportasi dan Statistik Langsung Kereta Api. Sementara data yang disimpan di Detail Transportasi adalah data persisten (ditunjukkan dengan label “D”), data yang disimpan di Statistik Langsung Kereta Api adalah data sementara yang disimpan untuk waktu singkat (ditunjukkan dengan label “T”). Bentuk callout digunakan untuk mencantumkan jenis detail yang dapat ditanyakan oleh seorang penumpang.
Asisten CS dapat memulai Beli Souvenir proses, yang akan menghasilkan Detail Pesanan disimpan di Pesanan penyimpanan data. Meskipun pelanggan adalah orang nyata yang membeli souvenir, itu adalah Asisten CS yang mengakses sistem untuk menyimpan detail pesanan. Oleh karena itu, kami membuat aliran data dari Asisten CS ke Beli Souvenir proses.
Asisten CS juga dapat memulai Beli Tiket proses dengan memberikan Detail Pesanan dan detail akan disimpan kembali di Pesanan penyimpanan data. Diagram Aliran Data adalah diagram tingkat tinggi yang digambar dengan tingkat abstraksi yang tinggi. Penyimpanan data Pesanan yang digambar di sini tidak selalu menunjukkan database pesanan nyata atau tabel pesanan dalam database. Cara bagaimana detail pesanan disimpan secara fisik akan diputuskan kemudian saat mengimplementasikan sistem.
Akhirnya, Asisten CS dapat memulai Laporkan Hilang proses dengan memberikan Detail Insiden dan Barang dan informasi akan disimpan di Barang Hilang database.
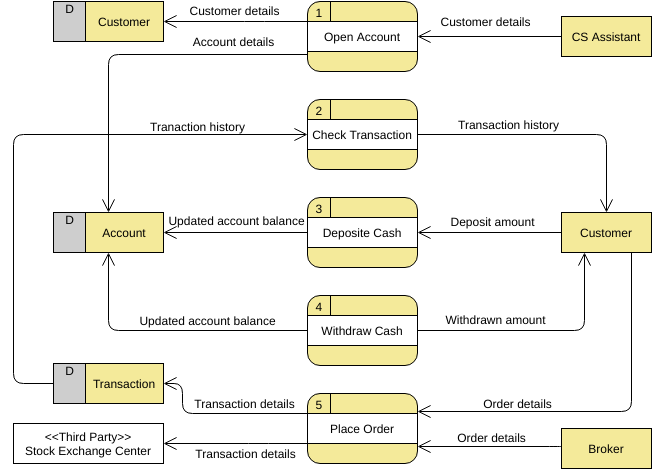
Pelajari Lebih Lanjut DFD melalui Contoh
This post is also available in Deutsch, English, Español, فارسی, Français, 日本語, Polski, Portuguese, Ру́сский, Việt Nam, 简体中文 and 繁體中文.
