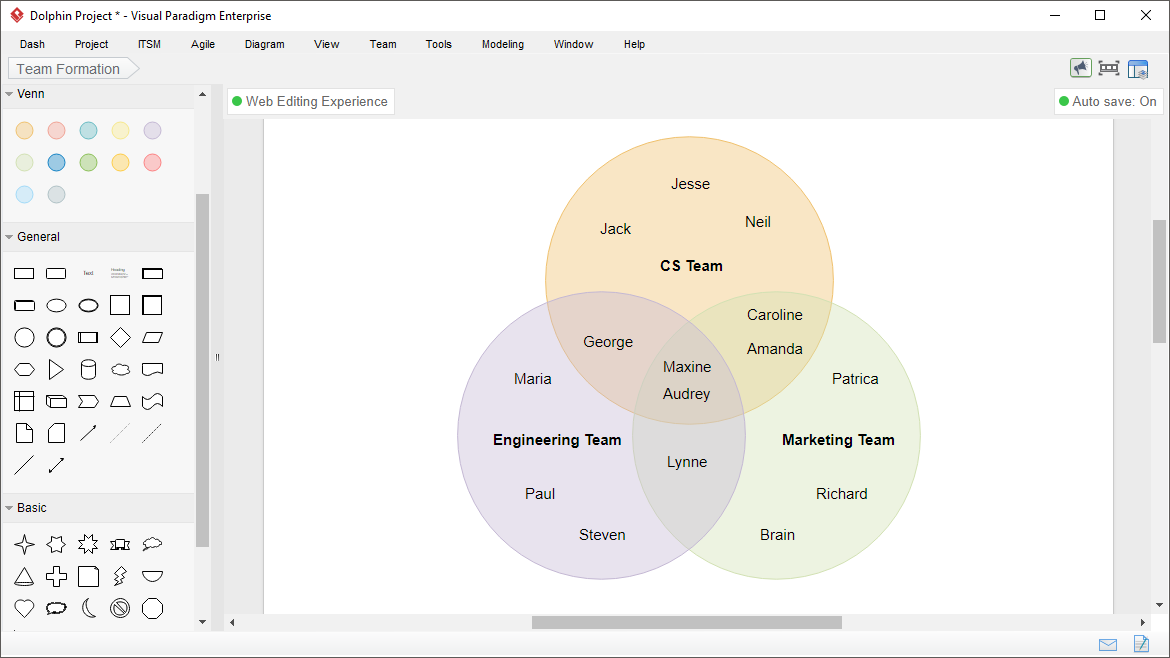
Venn diagrams are graphical or pictorial representations of relationships between different groups of things. Venn Diagram was invented by John Venn around 1880. Venn diagrams are also called set diagrams. Venn diagrams give a logical representation of the groups or sets. Relationships between two or three sets can be easily understood with the help of Venn diagrams. In mathematics, Venn diagrams are used to analyze known information obtained from surveys, data reports, and tables.
Continue reading