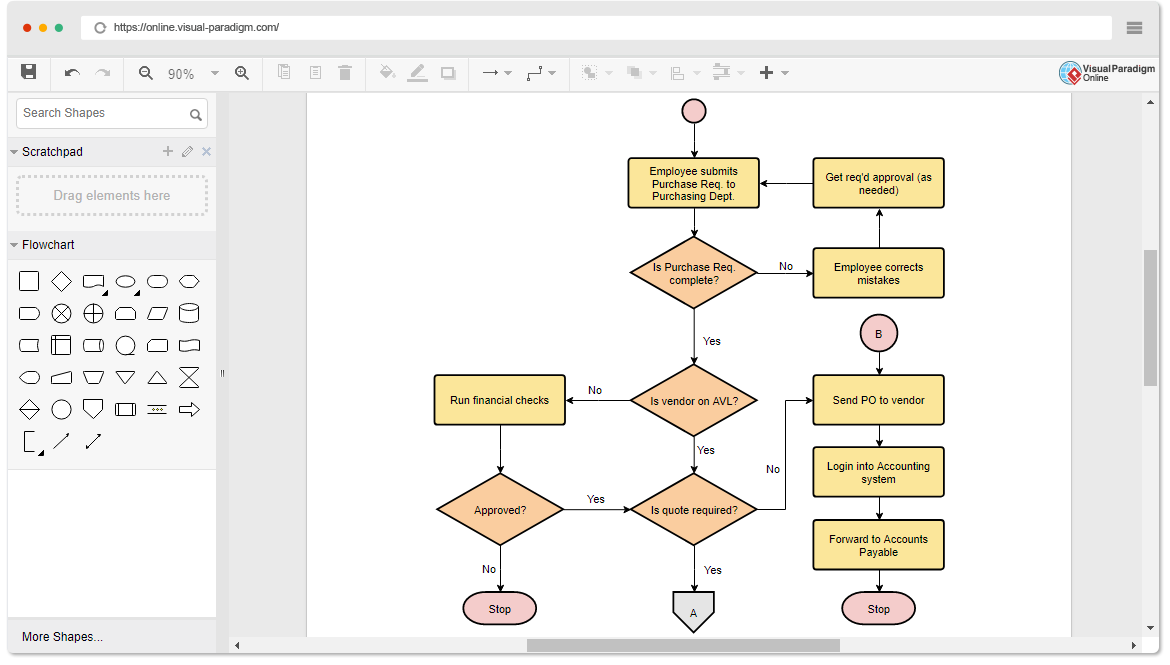
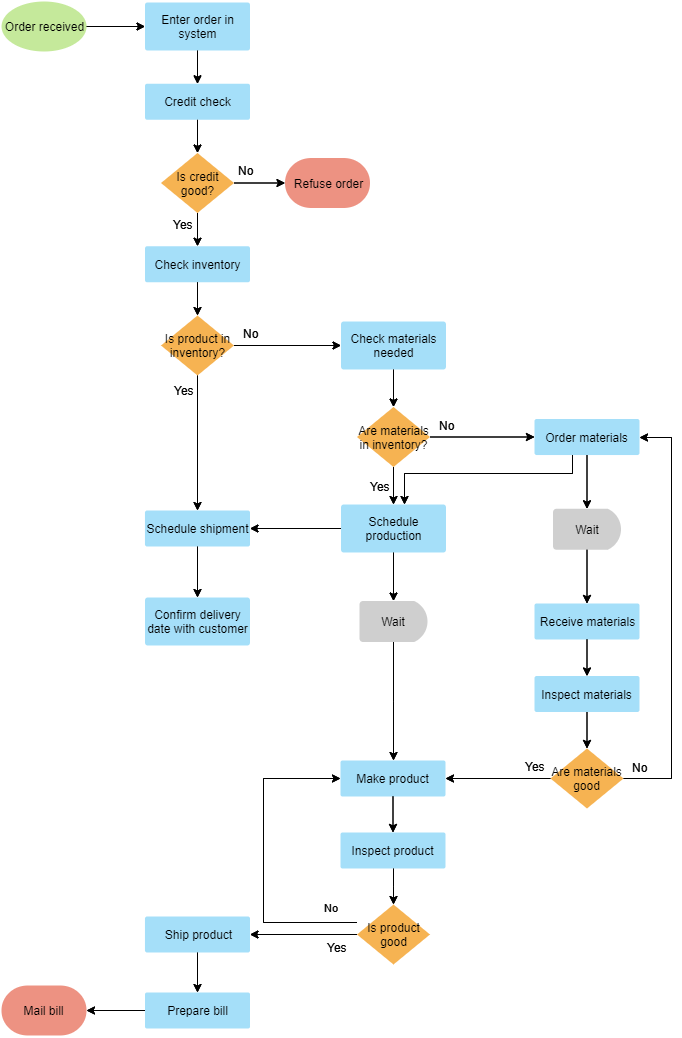
A flowchart is a graphical representation of the operations involved in a data processing system. operations in the system. Often, the best way to understand a problem is to draw a diagram. Diagrams usually give us a more complete picture of a situation than a short set of words or phrases. However, the combination of visual symbols )(shapes) and text provides a very powerful tool for communication and problem solving. Algorithms can be developed more quickly when a flowchart is created to represent them. Flowcharts are much easier to understand than algorithms.
Continue reading


![Top 30 Best UML Modeling Software [2022]](https://cdn-images.visual-paradigm.com/features/v14/3/uml-and-sysml-tools/sequence-diagram.png)


