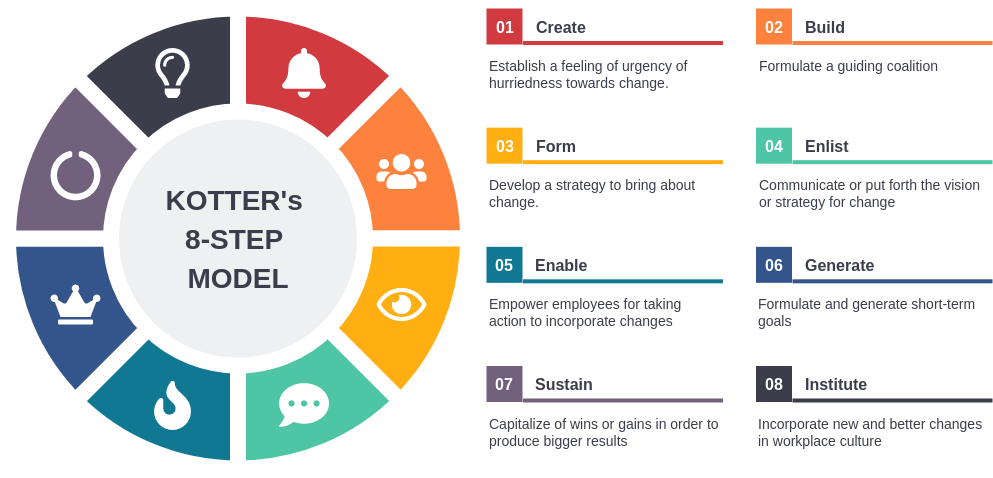
Kotter suggests that for change to be successful, 75% of the practice team needs to “buy into” the change. In other words, you have to really work hard on Step One, and spend significant time and energy building urgency, before moving onto the next steps. Don’t panic and jump in too fast because you don’t want to risk further short-term losses — if you act without proper preparation, you could be in for a very bumpy ride.
Continue readingTag: tw-done
A Comprehensive Guide to 5 Why Analysis
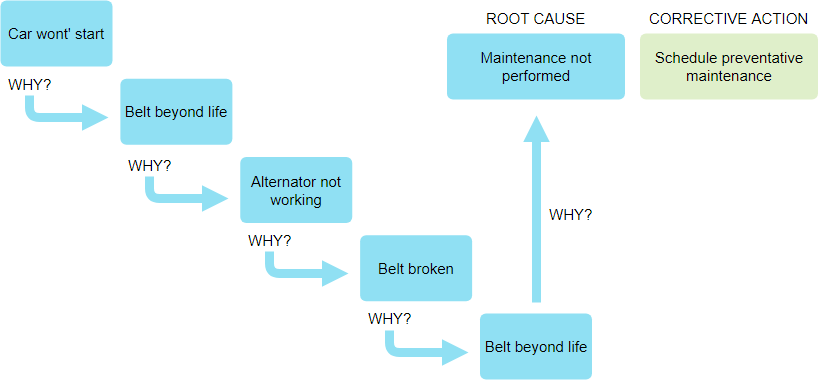
The 5 Whys is a simple tool used to help you understand what’s causing a problem by using an iterative interrogative technique to explore the root cause underlying a particular problem. As the name suggested, 5 Whys takes five iterations of asking “Why” to drill down from one symptom to another until you reached the root cause (Sometimes asking “Why?” five times is too many, and sometimes you need to ask it more than five times).
Continue readingSystem Thinking with Casual Loop Diagram – Learn by Examples
Causal loops diagrams (also known as system thinking diagrams) are used to display the behavior of cause and effect from a system’s standpoint. A causal loop diagram (CLD) is a causal diagram that aids in visualizing how different variables in a system are interrelated.
Continue readingVenn Diagram: A Comprehensive Tutorial
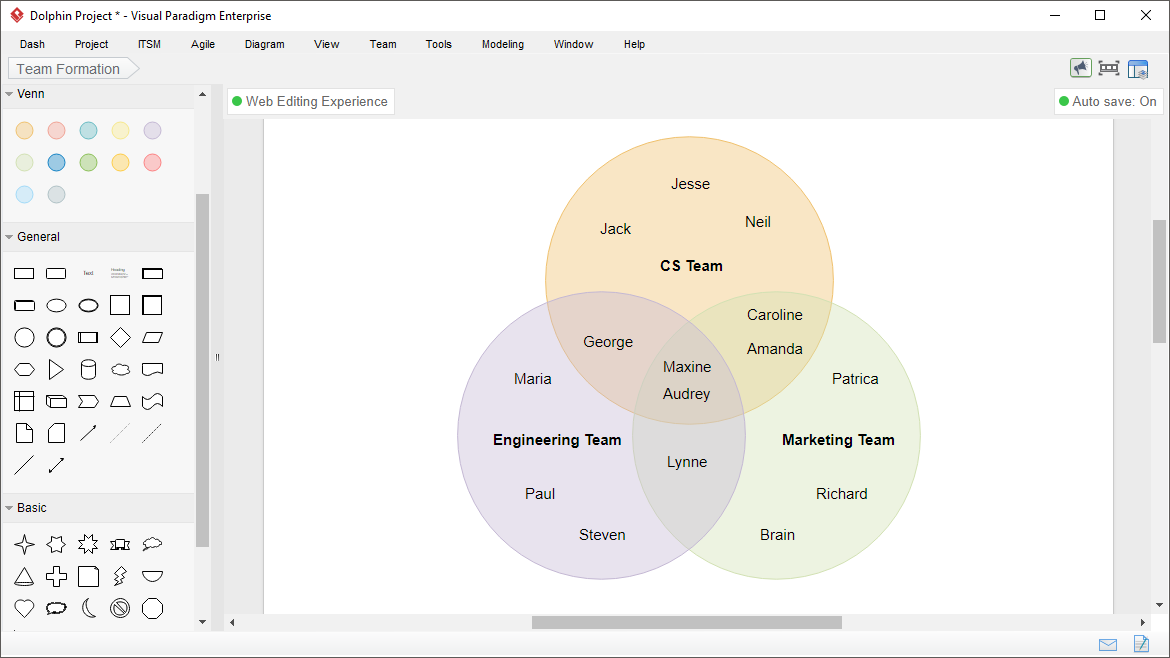
Venn diagrams are graphical or pictorial representations of relationships between different groups of things. Venn Diagram was invented by John Venn around 1880. Venn diagrams are also called set diagrams. Venn diagrams give a logical representation of the groups or sets. Relationships between two or three sets can be easily understood with the help of Venn diagrams. In mathematics, Venn diagrams are used to analyze known information obtained from surveys, data reports, and tables.
Continue readingStrategic Planning to Actionable Items: From SWOT to TOWS Analysis
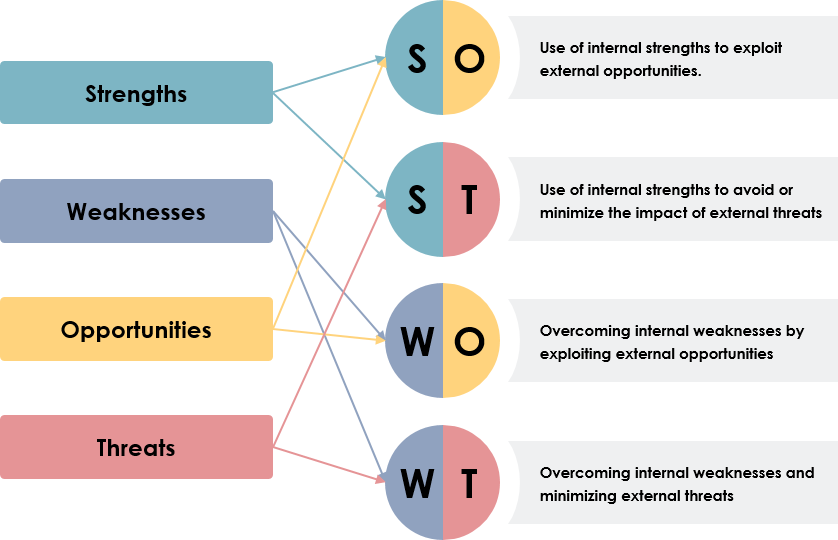
SWOT matrix is a planning tool, whereas TOWS matrix is an action tool. In SWOT analysis you identify all the Strengths, Weaknesses, Opportunities, and Threats in point form. After that you think of each point as a singular perspective. Whereas, TOWS matrix identifies the relationships between these factors and selecting strategies on their bases. Strengths and weaknesses are abstract concepts that can be hard to think about without any sort of context.
Continue readingEnterprise Integration Patterns (EIP) Tutorial
Enterprise Integration Patterns (EIP)is a book by Gregor Hohpe and Bobby Woolf and describes 65 patterns for the use of enterprise application integration and message-oriented middle-ware in the form of a pattern language. They help us use standardized ways to integrate applications, no need to reinventing the wheel each time you have a problem.
Continue readingA Comprehensive Tutorial on SSADM
Structured Systems Analysis and Design Method (SSADM) structural systems analysis and design methods, standards set in the early 1980s development, is widely used in the design and application of the calculation. It uses a combination of text and diagrams for system design throughout the life cycle, from the initial design concept to the application of actual physical design.
Continue readingA Comprehensive Guide to BPMN
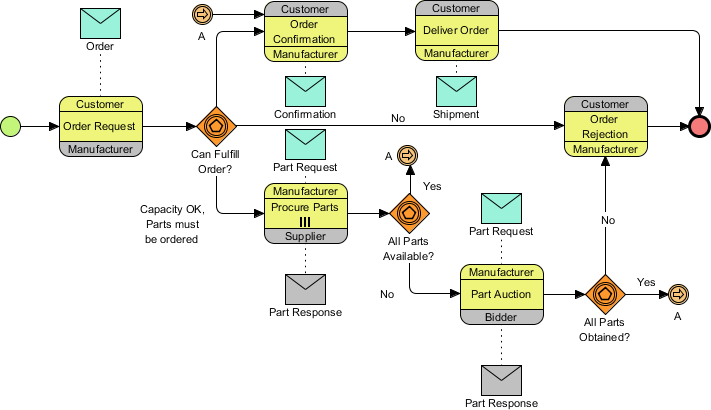
BPMN stands for Business Process Modeling Notation. BPMN is very similar to the concept of flowcharting that has been around since the 1980s. Like flowcharting BPMN modeling has the aim of allowing a person to map a workflow in such a way that it can be understood easily by other interested parties.
Continue readingA Comprehensive Guide to 14 Types of UML Diagram
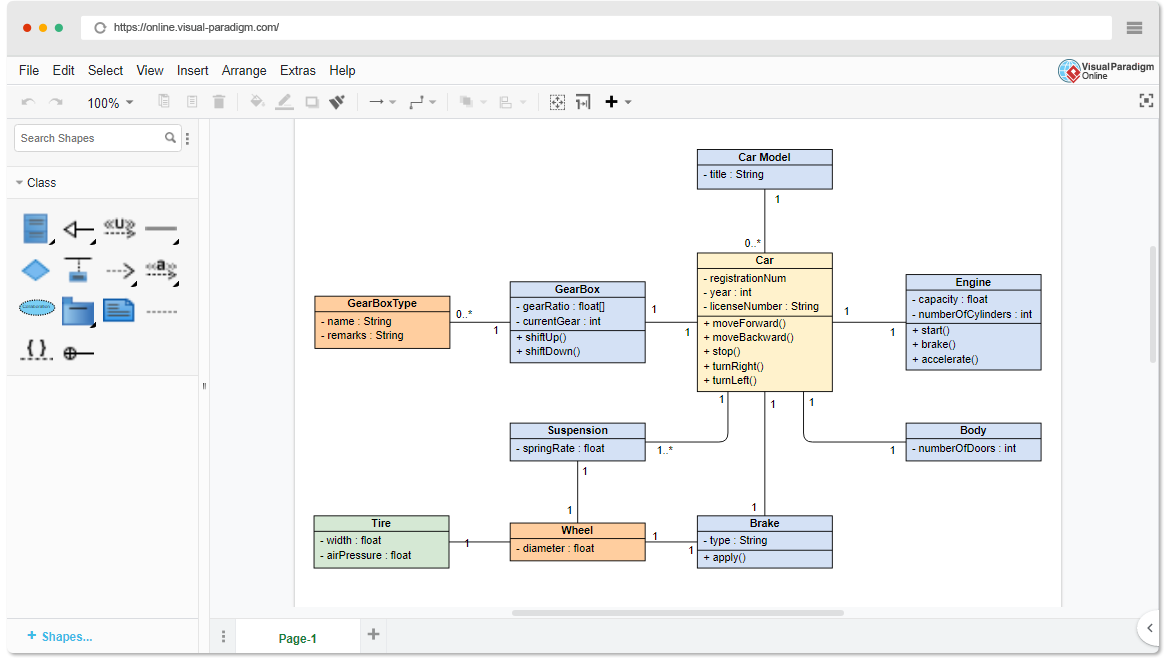
The Unified Modeling Language is a standardized general-purpose modeling language and nowadays is managed as a de facto industry standard by the Object Management Group (OMG). UML includes a set of graphic notation techniques to create visual models for software-intensive systems. In UML 2.2 there are 14 types of UML diagrams, which are divided into two categories
Continue readingStrategic Planning with Strategy Map & Balanced Score Card
A strategy map developed by Robert S. Kaplan and David P. Norton as part of their Balanced Scorecard framework for strategic planning and management. A strategy map is a visual representation of a company’s overall objectives and how they relate to one another on a single page.
Continue reading