In today’s data-driven world, visualizing information effectively is crucial for conveying complex data in a digestible format. Infographics are powerful tools that help the brain process visual information more efficiently than textual information. However, creating a successful and valuable infographic requires more than just combining several data charts. It involves a thoughtful approach to design and storytelling.
Here are seven essential tips to help you create impactful infographics:
1. Choose the Right Chart Format
Select a chart format that accurately tells the story you want to convey. Consider the goals, the type of information, and the specific outcomes you aim to achieve. Different chart forms can present the same data in various ways, so choose the one that best fits your narrative.
2. Avoid Unreasonable Chart Formats
Steer clear of unnecessary elements like redundant chart copies, unnecessary illustrations, shadows, and decorations. The goal of data visualization is to simplify complex data, so avoid overcomplicating the design. Choose the right chart and let it serve its purpose effectively.
3. Design for Quick Understanding
Focus on making your infographic easy to understand. Add, adjust, or delete simple elements in the chart to enhance overall clarity. For example, adding a trend line to a line chart or limiting the number of slices in a pie chart can significantly improve readability.
4. Start with a Zero Baseline in Line Charts
While not mandatory, starting a line chart from a zero baseline is beneficial when comparing multiple values. If small fluctuations in data are meaningful, you can truncate the ratio instead of starting from zero to highlight these differences.
5. Choose the Most Effective Visualization
Ensure your data visualization is consistent and easy to compare at a glance. Pay attention to the number of types when using stacked bar charts, grouped bar charts, or line charts. Avoid overwhelming readers with too many comparisons.
6. Pay Attention to Chart Placement
On a large screen, place related charts close to each other to facilitate comparison. For example, if you have two stacked bar graphs, ensure they are positioned in a way that the audience can easily understand the contrast between them.
7. Tell a Continuous Story
Create a narrative that flows logically. For instance, instead of just showing a 30% sales increase in the fourth quarter, display the sales growth from the first quarter to provide a comprehensive view and highlight the continuous story.
Recommended Tool: Visual Paradigm Online
Visual Paradigm Online is a versatile tool that can help you create professional and engaging infographics. It offers a wide range of templates and customization options to suit various data visualization needs. Whether you’re a beginner or an experienced designer, Visual Paradigm Online provides the tools you need to create impactful infographics.
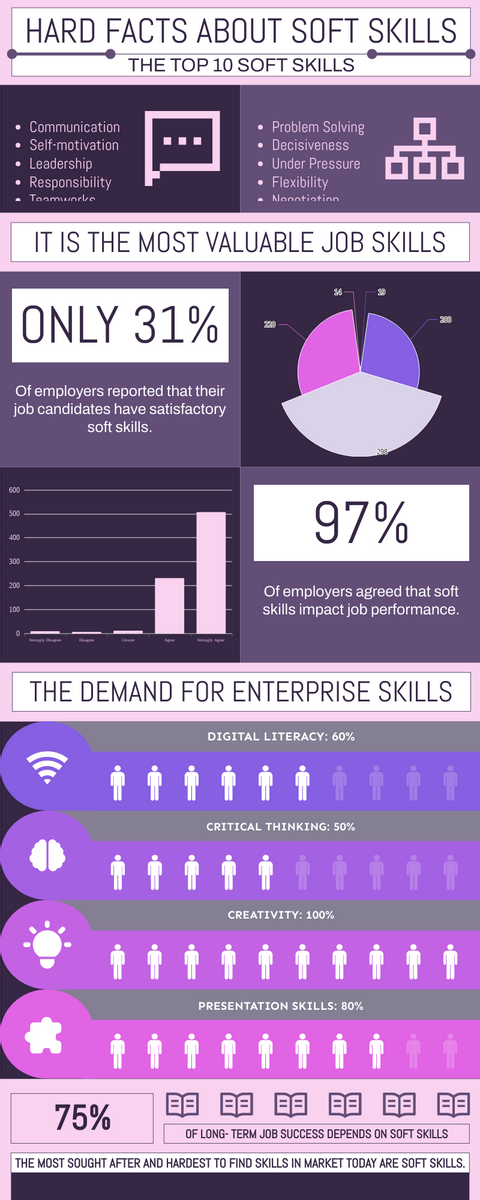
This is an infographic example that can be quickly understood: Hard Facts About Soft Skills Infographic


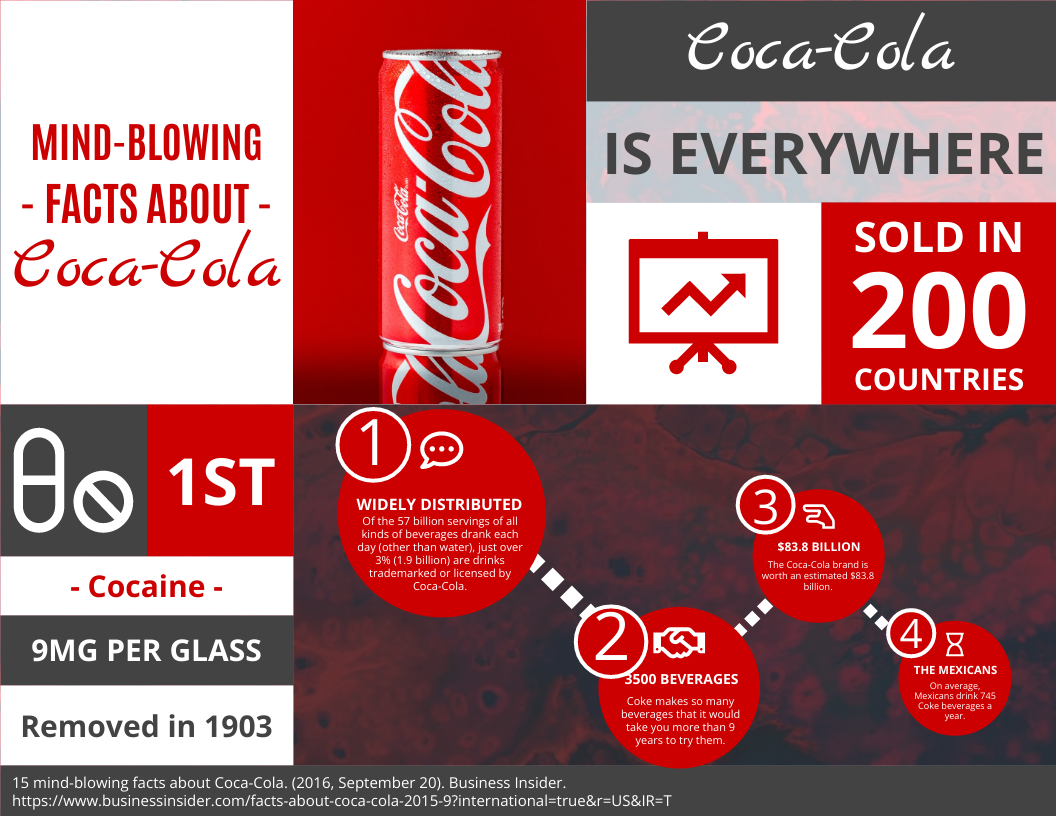
Mind-blowing Facts About Coca-Cola horizontal infographic

Insomnia Facts And Stats Infographic

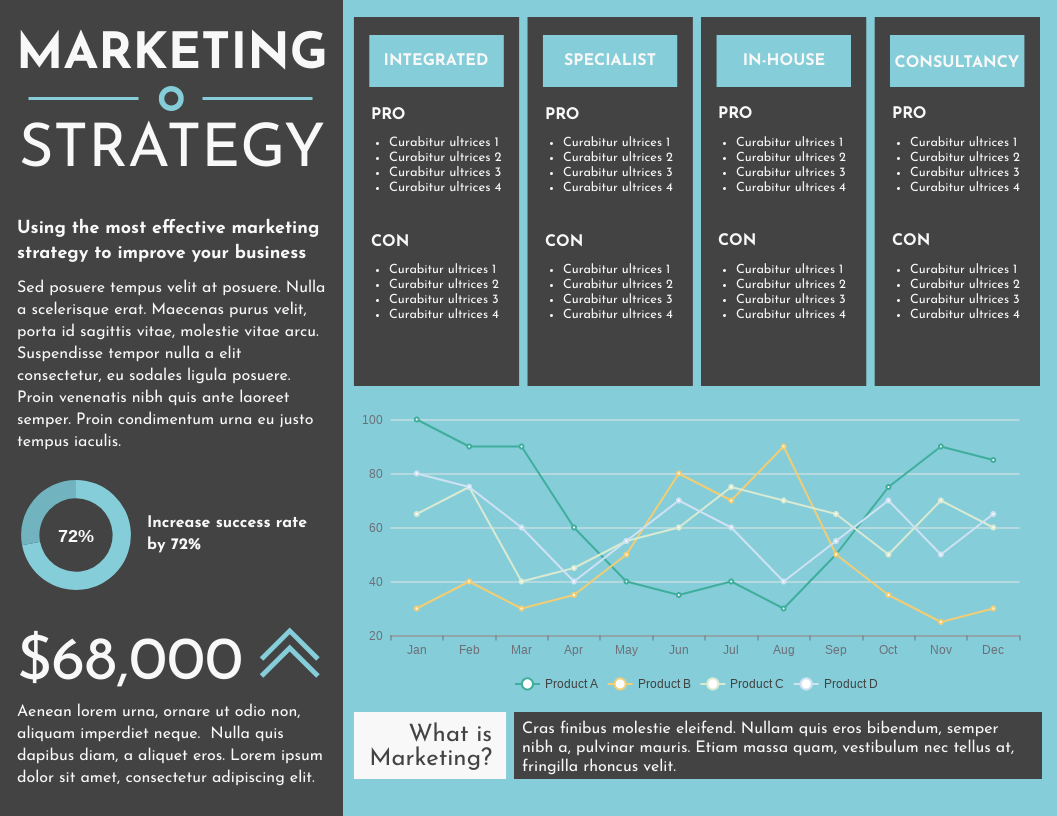
Marketing strategy horizontal Infographic
Reference List for Visual Paradigm Tool
- Visual Paradigm Online: Visual Paradigm Online
By following these tips and utilizing tools like Visual Paradigm Online, you can create infographics that are not only visually appealing but also effective in communicating complex data. Start your journey to mastering data visualization today!
References
- Online Infographic Maker – Visual Paradigm Online
- Description: Visual Paradigm Online offers a versatile online graphical design software that helps you create beautiful infographics. The tool includes an advanced map editor with over 200 customizable maps, allowing you to visualize data in various formats such as geomaps and heatmaps. It is perfect for all industries and businesses, providing a wide variety of free icons, photos, illustrations, and cliparts to electrify your infographics. The user-friendly interface allows non-designers to create professional infographics by simply dragging and dropping elements.
- URL: Visual Paradigm Online – Infographic Maker 1
- Visual Paradigm – Online Productivity Suite
- Description: Visual Paradigm Online provides a comprehensive solution for creating professional infographics, cards, posters, flyers, and other visuals. The intuitive visual graphic editor offers over 50 chart types to represent your data effectively. The platform also includes tools for creating photo books, digital publications, and more, making it a one-stop solution for all your design needs.
- URL: Visual Paradigm – Online Productivity Suite 2
- Free Infographic Templates – Visual Paradigm Online
- Description: Visual Paradigm Online offers a wide range of free infographic templates that help you express information visually. These templates include simple icons, images, illustrations, charts, and text, covering various marketing scenarios such as education, garment, catering, and information technology. The tool also provides millions of high-quality graphic assets, including photos, cliparts, icons, and shapes, to customize your infographics.
- URL: Visual Paradigm Online – Free Infographic Templates 3
- Free Infographic Maker and Graphic Design Software | InfoART
- Description: InfoART by Visual Paradigm is a free infographic maker and graphic design software that allows you to create professional infographics, flyers, and marketing visuals in minutes. The tool includes beautiful design templates and in-tool resources, making it easy for non-designers to create compelling designs quickly.
- URL: InfoART – Free Infographic Maker 4
- Amazing Free Infographic Maker – Visual Paradigm Online
- Description: Visual Paradigm Online offers a free infographic maker with access to over 2,000,000 high-resolution stock photos, illustrations, and icons. The tool focuses on creating attractive templates and an intuitive infographic editor, allowing anyone to design professional infographics without needing to be a graphic designer.
- URL: Visual Paradigm Online – Free Infographic Maker 5
- What is Infographics? – Free Infographic Guide – Visual Paradigm Online
- Description: This guide by Visual Paradigm Online explains what infographics are and their benefits. Infographics are graphic visual representations of information, data, or knowledge intended to present information quickly and clearly. The guide highlights the advantages of using infographics for displaying data, explaining concepts, and improving cognition.
- URL: Visual Paradigm Online – What is Infographics? 6
- Visual Paradigm
- Description: Visual Paradigm is an all-in-one UML, SysML, BPMN modeling platform for Agile, EA TOGAF ADM process management. It provides content creators with charts, data widgets, and maps to visualize data while offering information, tables, and spreadsheet tools to increase productivity. The platform also features a rich set of Agile and Scrum tools for project management.
- URL: Visual Paradigm
- Visual Paradigm Online
- Description: Visual Paradigm Online offers a versatile online drawing solution that includes tools for creating professional flowcharts, UML diagrams, BPMN, ArchiMate, ER Diagrams, DFD, SWOT, Venn, org charts, and mind maps. The platform works cross-platforms, including Mac, Windows, and Linux.
- URL: Visual Paradigm Online – Online Drawing Tool
- Unleash Your Creativity with Visual Paradigm Online Free Edition – Visual Paradigm Guides
- Description: Visual Paradigm Online Free Edition is a versatile and powerful online drawing software that offers support for Class Diagrams, UML diagrams, ERD tools, and Organization Chart tools. It empowers users to bring their ideas to life with precision and creativity, making it an excellent tool for various diagramming needs.
- URL: Unleash Your Creativity with Visual Paradigm Online Free Edition
- Visual Paradigm Online Drive
- Description: Visual Paradigm Online Drive provides a platform to manage and access your documents, presentations, PDFs, charts, and digital publications under one roof. It offers a powerful online office suite that covers all your needs, from text documents and spreadsheets to presentations and forms.
- URL: Visual Paradigm Online Drive
These references provide a comprehensive overview of the capabilities and benefits of using Visual Paradigm Online for creating infographics and other visual content.

