Introduction Use Case Diagrams are a fundamental tool in software engineering and systems analysis, used to capture and model the
Continue reading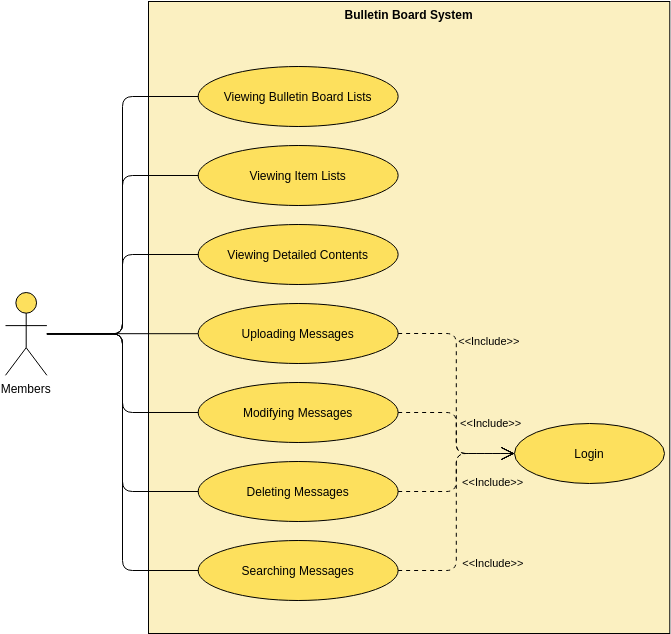
Learning one new thing everyday


Introduction Use Case Diagrams are a fundamental tool in software engineering and systems analysis, used to capture and model the
Continue reading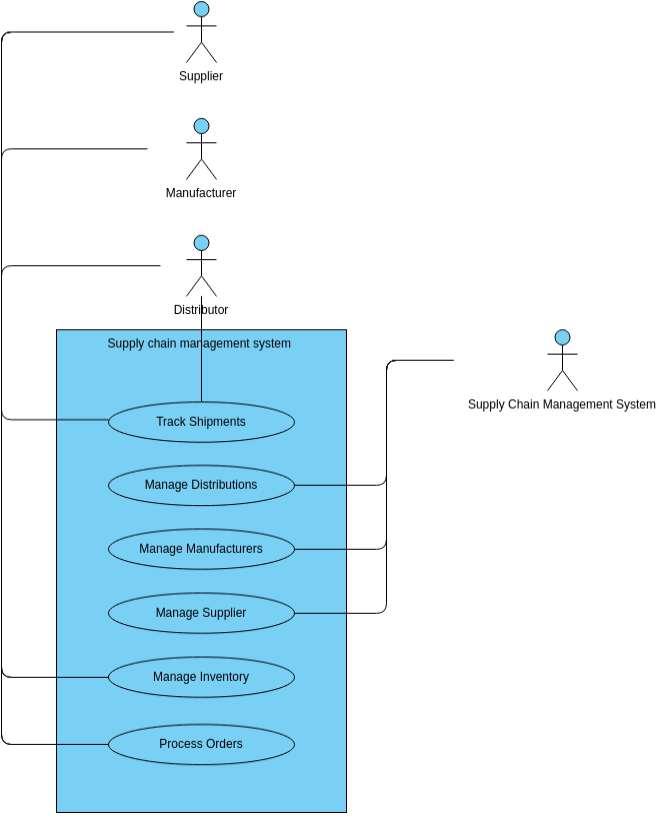
Introduction Use Case Analysis is a critical technique in software engineering and systems analysis that helps in understanding, capturing, and
Continue readingReferences Unlocking New Possibilities Enhanced TTS for Education and Corporate Animation Bringing Your Animated Characters to Life with AI-Driven TTS
Continue reading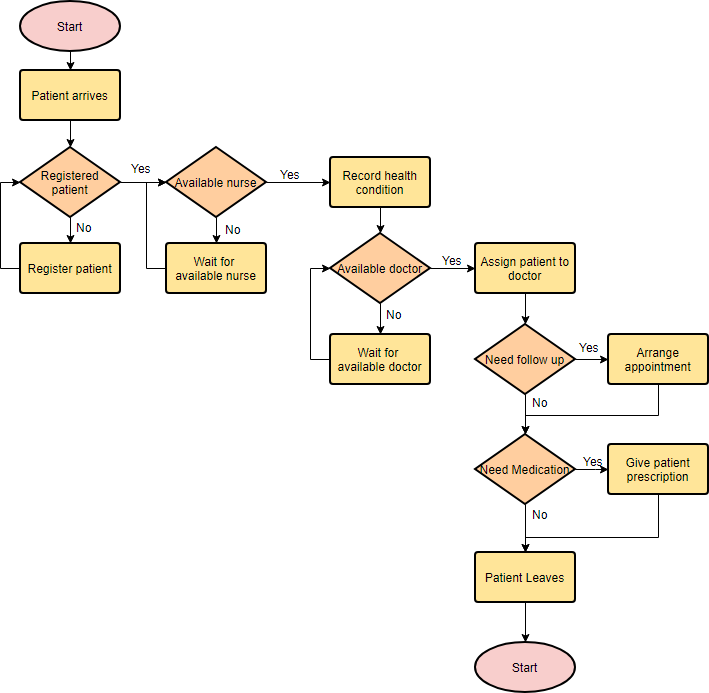
Introduction Flowcharts are powerful visual tools used to represent the sequence of steps and decisions in a process. They help
Continue reading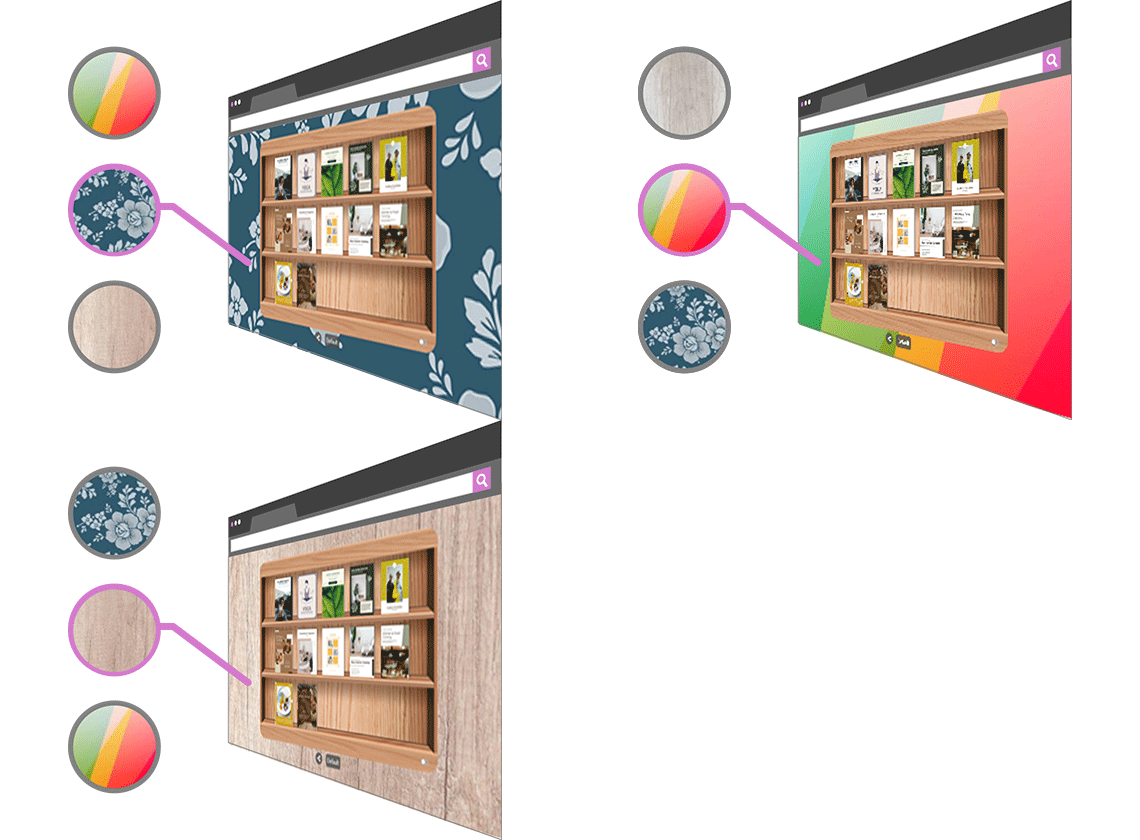
在数字时代,管理和分享您的电子书和文档变得比以往任何时候都更容易。Visual Paradigm Online 提供了强大的工具,帮助您创建美观的虚拟书架,并轻松与朋友和同事分享。本文将介绍如何使用 Visual Paradigm Online 的翻页书编辑器和虚拟书架功能,提升您的数字阅读体验。 组织您的书籍 轻松插入和组织电子书 通过拖放功能,您可以轻松地将电子书插入并组织在虚拟书架中。您还可以根据书籍类型或流派创建多个书架,方便管理和查找。 展示您的 PDF、PPT 和其他文档 使用我们的翻页书制作工具设计您的电子书,或上传文件并将其转换为数字出版物。无论您创建什么类型的出版物,我们的电子书架都是管理和分享您的书籍收藏的完美方式。 书架定制 个性化您的书架 不同类型的书籍带有不同的氛围。您可以根据书籍收藏定制书架,选择适合您的主题和背景。我们提供多种主题和背景选项,确保您的书架外观与您的书籍收藏相得益彰。 装饰配件 小装饰品和配件可以为书架增添新意,给读者带来强烈的视觉冲击。我们提供丰富的高质量装饰品,随时可用于填充您的书架。缺乏灵感?尝试随机功能,让我们的引擎为您找到最佳的装饰方式。
Continue readingIn the digital age, creating high-quality visual content has become essential for professionals across various fields. Whether you’re a designer,
Continue reading
Visual Paradigm Online – AniFuzion 是一个功能强大的动画制作工具,适合初学者和专业人士。以下是一个详细的学习计划,帮助您系统地掌握 AniFuzion 的各项功能,从基础到高级,逐步提升您的动画制作技能。 第一周:入门与基础 注册与初步了解 注册 Visual Paradigm Online 并访问 AniFuzion。 熟悉 AniFuzion 的用户界面和基本功能。 基础动画制作 学习如何使用预定义的动画预设为文本、形状和对象制作动画。 参考资源:AniFuzion:轻松的高质量视频动画
Continue reading
在当今信息爆炸的时代,信息图表成为了传达复杂信息的有效工具。无论你是设计师还是普通用户,都可以利用这些工具轻松创建专业的信息图表。以下是五大最佳信息图表制作工具,帮助你在短时间内创建出色的视觉内容。 1. Visual Paradigm Online Visual Paradigm Online 是一个集成多功能的平台,非常适合用于制作数字创意演示。它不仅提供信息图表制作功能,还包括翻页书、动画以及大量的模板。用户可以选择数百种专业设计的模板,并使用其丰富的剪贴画、图标、照片、图表和地图库进行定制。这使得创建和分享设计变得非常简单和高效。 2. Canva Canva 是一个广受欢迎的在线设计工具,适用于创建各种视觉内容,包括信息图表、海报、传单和名片。Canva 提供了大量的模板和设计元素,用户可以通过拖放编辑器轻松定制设计。其用户友好的界面和丰富的资源库使其成为设计新手的理想选择。 3. Piktochart Piktochart 专注于信息图表的创建,提供了大量的模板和设计元素,帮助用户快速生成专业的视觉内容。Piktochart 的拖放编辑器使得设计过程变得简单直观,用户可以轻松添加图表、地图和图标,创建出富有吸引力的信息图表。 4.
Continue reading
Visual Paradigm Online:全能的在线生产力套件 在数字时代,效率和便捷性是我们追求的核心目标。Visual Paradigm Online(VP Online)作为一款全能的在线生产力套件,将所有文档、演示文稿、PDF、图表和数字出版物整合在一个平台上,帮助您提升工作效率,简化日常任务。 一站式解决方案 VP Online 提供了一个统一的平台,将团队、目标和行动整合在一起。无需安装任何软件,也无需信用卡,您可以免费开始使用这个强大的工具。 虚拟书架组织 翻页书书架 VP Online 的翻页书书架功能让您可以轻松地将电子书插入书架并进行整理。通过简单的拖放操作,您可以根据书籍类型或流派创建多个书架,使您的藏书更加有条理和易于管理。 动画解说视频制作 在线动画解说视频制作工具 VP Online
Continue reading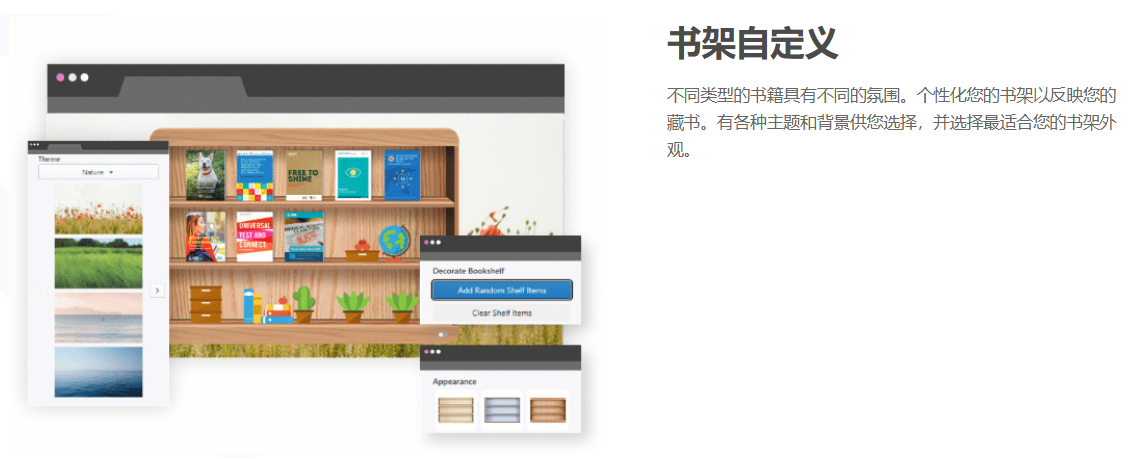
在数字时代,虚拟书架成为展示和分享您的翻页书和其他演示文稿的理想工具。无论是个人收藏还是专业作品,虚拟书架都能帮助您以一种视觉上令人愉悦的方式组织和展示您的内容。以下是如何利用虚拟书架来管理和分享您的数字藏书的详细介绍。 创建漂亮的虚拟书架 我们的翻页书编辑器使您能够轻松创建漂亮的虚拟书架,并通过链接与朋友和同事分享。无论您是想展示个人作品还是专业出版物,虚拟书架都能为您的藏书增添一份独特的魅力。 整理您的书籍 通过简单的拖放操作,您可以轻松地将电子书插入书架并进行整理。根据书籍类型或流派,您还可以创建多个书架,使您的藏书更加有条理和易于管理。 显示您的 PDF、PPT 和其他文档 使用我们的翻页书制作器,您可以设计自己的电子书,或者上传文件并将其转换为数字出版物。无论您创建哪种类型的出版物,我们的电子书架都是管理和分享您的藏书的完美方式。 书架自定义 不同类型的书籍具有不同的氛围,您可以个性化您的书架以反映您的藏书风格。我们提供各种主题和背景供您选择,确保书架的外观与您的书籍完美契合。 用配饰装饰 小装饰品和配件可以让书架焕然一新,给读者带来巨大的视觉冲击。我们提供丰富的高品质装饰品,随时可用来填满您的书架。如果您缺乏创意,可以尝试随机化功能,让我们的引擎检测出利用书架空位的最佳方法。 以链接形式分享 每个已发布的书架都有其自己的唯一链接。您可以通过社交媒体分享此链接,或将其发布到网上,以便其他人直接访问您的书架。任何拥有此链接的人都可以看到您的藏书并阅读存储在该特定书架中的书籍。 立即制作翻页书 准备好为全球数百万读者创建一本翻页书了吗?无论您是想展示个人作品还是专业出版物,虚拟书架都能帮助您以一种视觉上令人愉悦的方式组织和展示您的内容。立即开始,创建您的第一本翻页书,并与全世界分享您的才华和创意。 通过虚拟书架,您可以轻松地管理和展示您的翻页书和其他演示文稿集合。无论是个人收藏还是专业作品,虚拟书架都能为您的藏书增添一份独特的魅力,并与更多读者分享您的精彩内容。
Continue reading