Introduction to SWOT Analysis SWOT analysis is a strategic planning tool used to identify and evaluate the strengths, weaknesses, opportunities,
Continue reading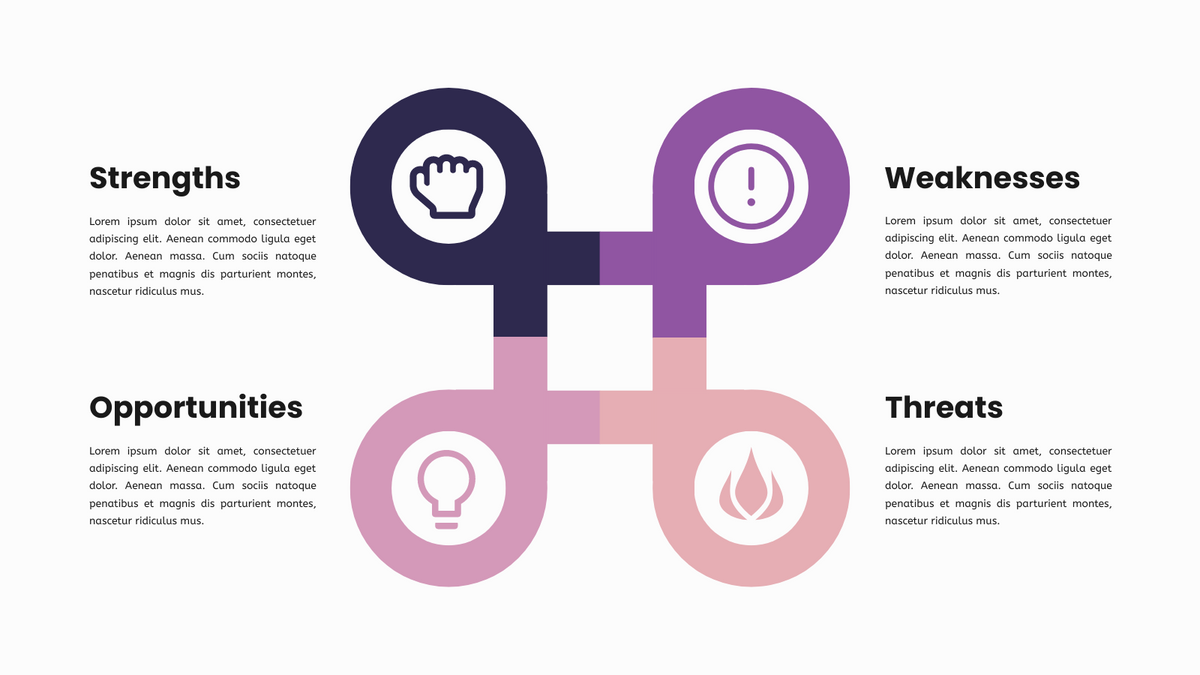
Comprehensive Guide to SWOT Analysis
SWOT Analysis is a strategic planning tool used to identify and evaluate the Strengths, Weaknesses, Opportunities, and Threats involved in
Continue reading
Comprehensive Guide for Beginners: Adopting UML as a Tool for Development Teams
Introduction Unified Modeling Language (UML) is a standardized modeling language used to visualize the design of a system. It is
Continue reading
Comprehensive Guide to Learning and Sharing Experiences with Visual Paradigm’s All-in-One Platform
Introduction Visual Paradigm is a powerful all-in-one platform designed to enhance team collaboration and streamline the modeling process. This guide
Continue reading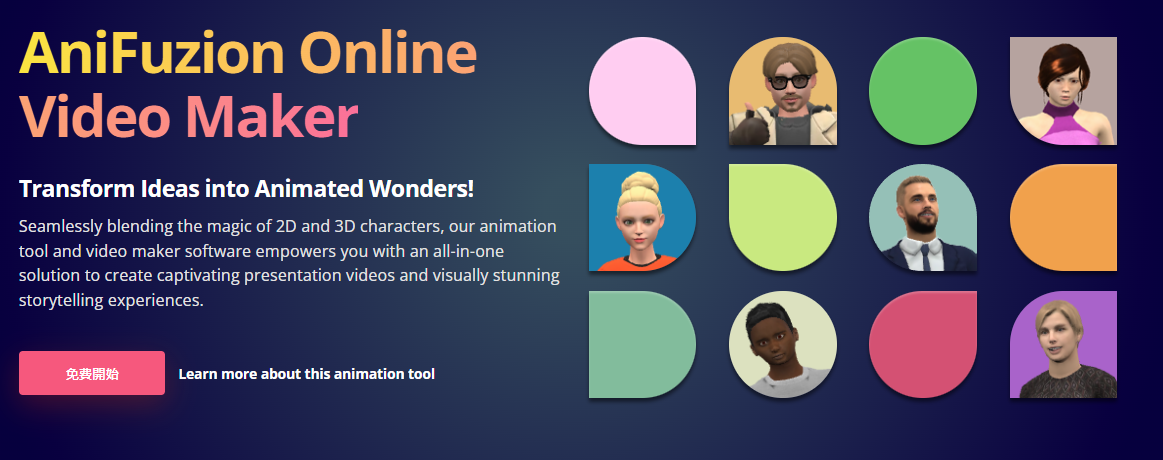
Sharing My Journey with AniFuzion: Creating a Stunning Animated Video Presentation
After successfully completing my learning journey with AniFuzion, I am thrilled to share my experiences and the stunning animated video
Continue reading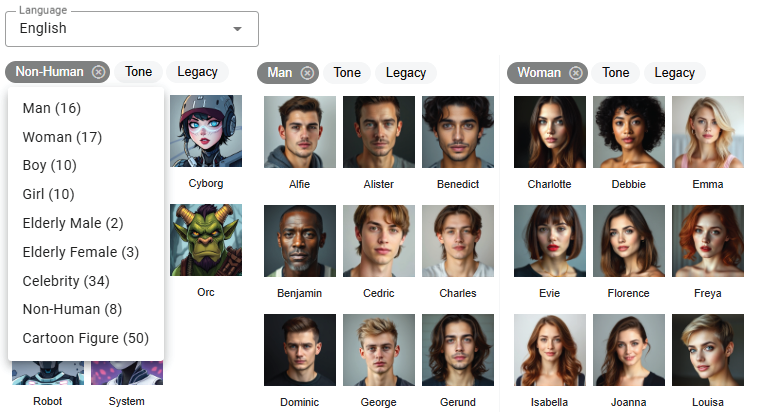
Elevate Your Animations with Anifuzion’s Enhanced Text-to-Speech Features
In the dynamic world of animation, creating engaging and lifelike characters is essential. While visuals play a crucial role, the
Continue reading
Comprehensive Guide to AniFuzion: The Animated Video Tool by Visual Paradigm Online
Introduction to AniFuzion AniFuzion, offered by Visual Paradigm Online, is a cutting-edge animated video tool designed to cater to both
Continue readingComprehensive Guide to Flowcharts: Key Concepts, Examples, and Best Tools
Introduction to Flowcharts Flowcharts are visual tools used to represent algorithms, workflows, or processes. They use various shapes and symbols
Continue reading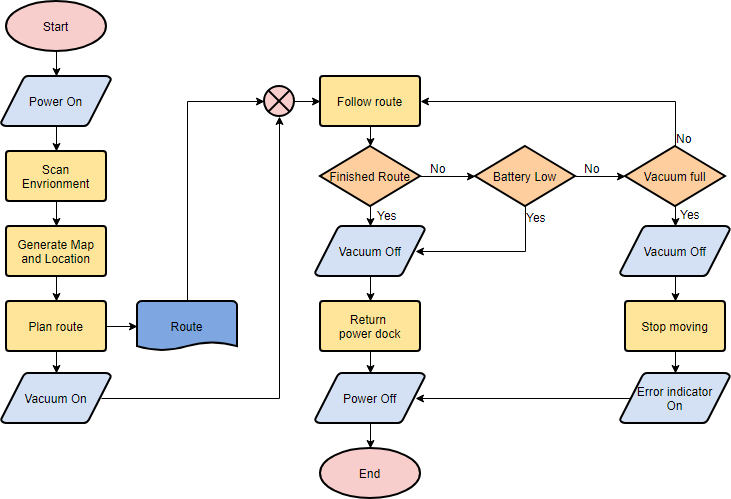
Why Visual Paradigm Online is the Best Diagramming Platform
In the realm of diagramming tools, Visual Paradigm Online stands out as a premier platform, offering a rich collection of
Continue reading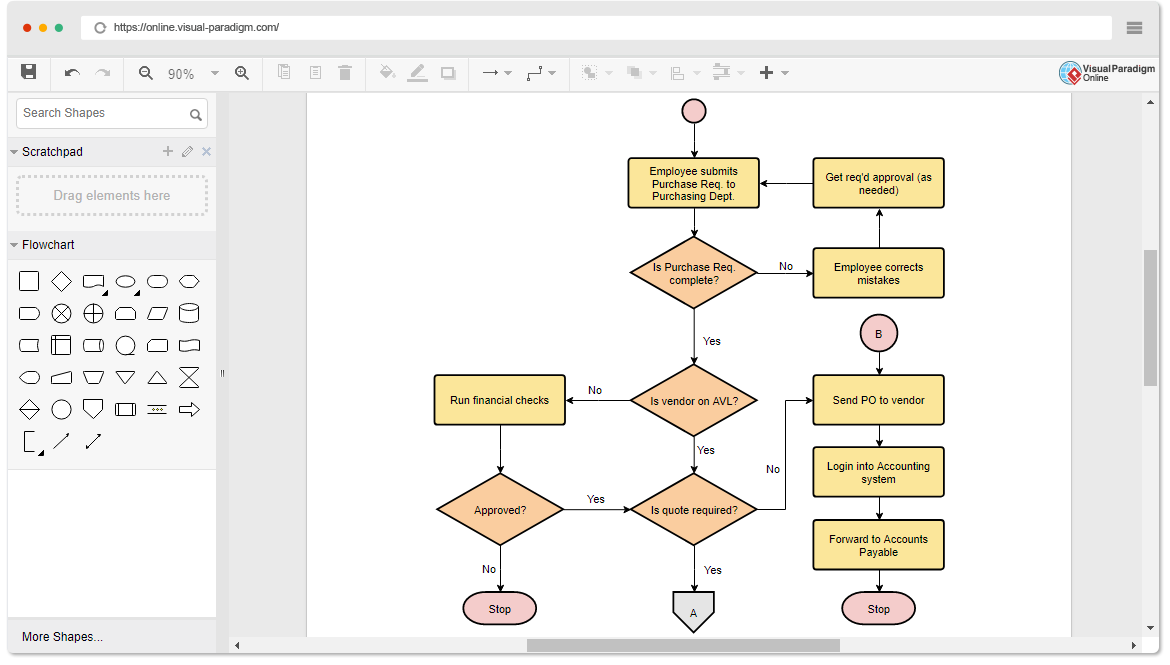
Comprehensive Guide to Flowcharting: Process, Key Concepts, and Stepwise Refinements
Introduction Flowcharting is a visual representation of a process or system, showing the sequence of steps and decisions involved in
Continue reading