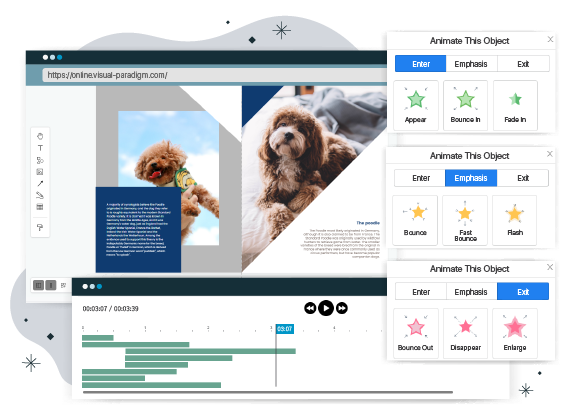
If you’ve ever tried to create MS’s Visio Flowchart®, you know how hard it is. You can start with a few basic tools, if you need to change anything — move shapes, delete shapes or add new shapes — it’s too hard! You know what I mean. Visual Paradigm Online automates all your complex tasks with just a few clicks.
Continue readingUML from What to How with Use Case and Activity Diagram
Use case diagrams and activity diagrams are behavioral UML diagrams that describe the dynamic characteristics of a system. The difference between use case diagrams and activity diagrams is that use case diagrams help to model the system, user interactions, while activity diagrams help to model the workflow of the system and are often used to illustrate the internal logic of use cases. These diagrams offer multiple advantages. They help model business requirements and understand the functionality of the system at a high level.
Continue readingApplying UML in Different Levels of Usage
UML can be used as much or as little as you like. Martin Fowler describes three common ways that people tend to use UML: (1) UML as a sketch ; (2) UML as a blueprint ; (3) UML as a programming language.
Continue readingWhat is Cross-functional Flowchart?
A cross-functional flowchart (sometimes referred to as a deployment flowchart) is a business process mapping tool used to articulate the steps and stakeholders of a given process. Typically, we use a cross-functional flowchart to show the relationship between a business process and the functional units (such as departments) responsible for that process.
Continue readingState Diagram Comprehensive Guide with Examples
A state machine diagram is a behavior which specifies the sequence of states an object visits during its lifetime in response to events, together with its responses to those events.
Continue readingMind Map — A Practical Tutorial with 30+ Examples
Mind mapping is an effective means to take notes and brainstorm essay topics. A mind map involves writing down a central theme and thinking of new and related ideas which radiate out from the center. By focusing on key ideas written down in your own words and looking for connections between them, you can map knowledge in a way that will help you to better understand and retain information.
Continue readingA Comprehensive Guide to Flowchart with 50+ Examples
A flowchart is a diagram of the sequence of steps in a process. It is a general purpose tool that can be used for a variety of purposes, such as manufacturing processes, management or service processes, or project planning. It is often defined as a graphical representation of an algorithm, a step-by-step approach to a task. It displays the steps as various types of boxes and shows their order by connecting the boxes with arrows.
Continue readingData Flow Diagram Comprehensive Guide with Examples
Data Flow diagrams (DFDS) describe logical models and data transformations in the system. It includes a mechanism for modeling data flows and supports decomposition to illustrate the details of data flows and functionality. A data flow chart cannot display information about the order of operations. Therefore, it is not a process or process modeling approach.
Continue readingAll You Need to Know About Use Case Modeling
Use cases describe how users use the system to achieve specific goals. A use-case diagram consists of a system, related use cases, and actors, and relates them to each other to visualize: What is it describing? (System), who is using the system? What are the actors trying to achieve? Thus, use cases help ensure that the right system is developed by capturing requirements from the user’s point of view.
Continue readingTop 7 Most Popular Agile Estimation Methods for User Stories
In software development, “estimation” in the usual sense includes a quantitative assessment of the effort required to perform a specific development task; this is usually expressed in terms of duration. Agile estimation is the process of evaluating the effort required to complete the tasks on a product’s backlog in order of priority. This effort is usually measured in terms of the time required to complete the task, which in turn leads to accurate sprint planning.
Continue reading