UML State machine diagram and activity diagram are both behavioral diagrams but have different emphases. Activity diagram is flow of functions without trigger (event) mechanism, state machine is consist of triggered states.
Continue reading
Uczenie się jednej nowej rzeczy każdego dnia


UML State machine diagram and activity diagram are both behavioral diagrams but have different emphases. Activity diagram is flow of functions without trigger (event) mechanism, state machine is consist of triggered states.
Continue reading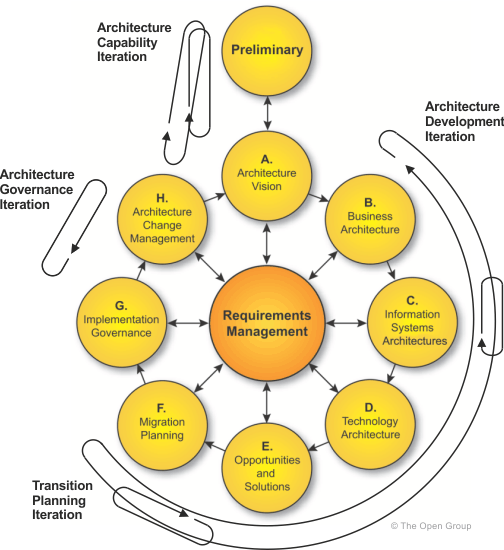
TOGAF (Framework Architektury Otwartej Grupy) to otwarty framework organizacyjny. Sam framework jest dobrze udokumentowanym zbiorem wiedzy, w tym szczegółowymi metodami
Continue readingWhen teams first start agile development, little has changed, other than perhaps more meetings on the schedule. They may still operate separately or limit their interactions with customers. You might see the work break down into waterfall kind of tasks, then design user stories, then build stories, then test stories. Therefore, the „Agile Teams” are agile in form when they just walk around without understanding or accepting agile principles and values. Teams become agile when they think and act in line with agile values and principles.
Continue reading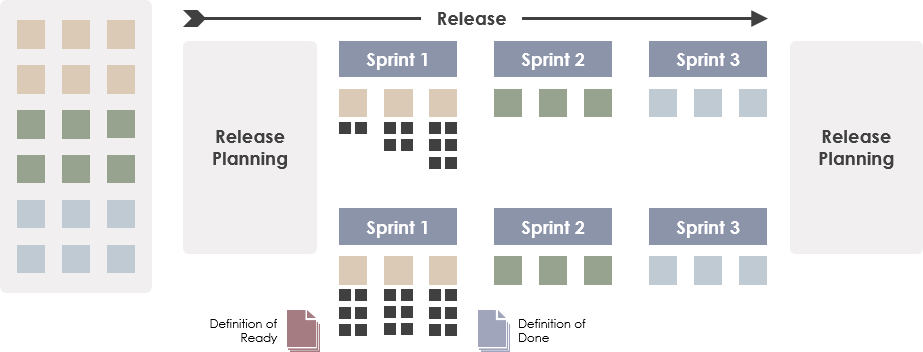
The Definition of Ready is a set of agreements that lets everyone know when something is ready to begin, e.g., when a user story is ready to be taken into a sprint, or when all necessary conditions are right for a team to start a sprint. An appropriate definition of ready will substantially improve the Scrum team’s chance of successfully meeting its sprint goal.
Continue reading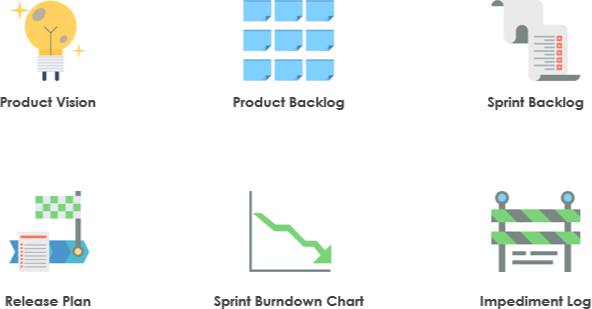
Transparency is the first important aspect of the Scrum process and must be visible to those responsible for the outcome. Transparency requires that these aspects be defined in their daily activities and artifacts so that teams can share a common understanding of what they see.
Continue reading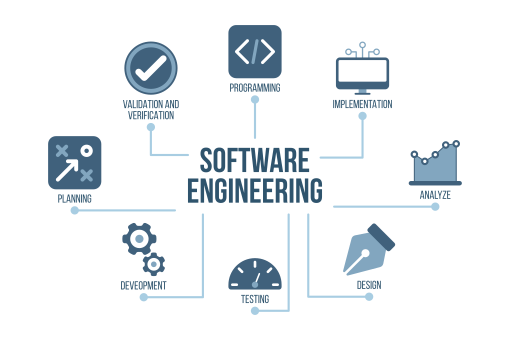
Software engineering focuses on the development of software products. it is a systematic, disciplined, and quantifiable approach to software development, operation, and maintenance; That is, engineering to software applications.
Continue reading
Strategic analysis is the core step of the strategic planning cycle. Every strategist should have a set of analytical model tools to deal with. However, there are many techniques and tools available for strategic analysis. If you search Google on the Internet, you will find many options available.
Continue reading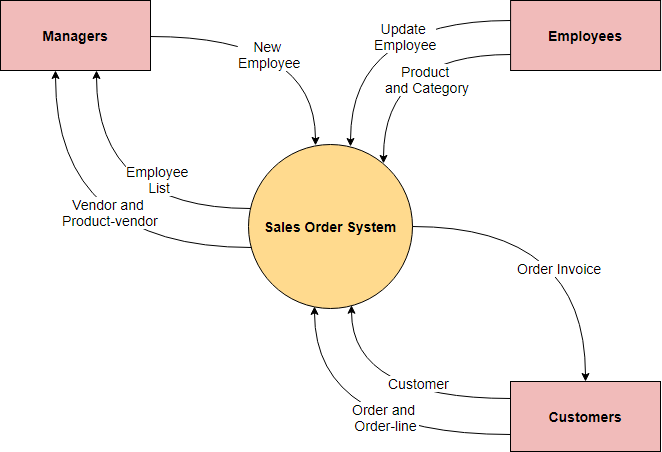
The context diagram shows the system considered as a single high-level process, and then shows the relationship of the system to other external entities (systems, organizational groups, external data stores, and so on). Another name for a context diagram is a context-level data flow graph or 0-level DFD.
Continue reading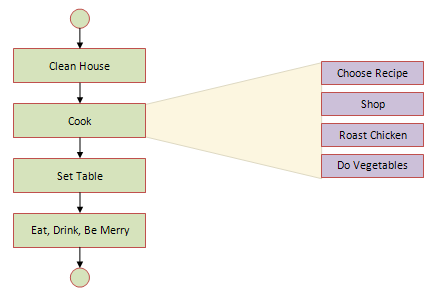
One of the effective way to solve a complex problem is to break it down into simpler sub-problems. You start by breaking down the whole task into simpler parts. Step-by-step refinement is essentially a decomposition of the system to gain insight into the subsystems that make up the system, known as the top-down decomposition method.
Continue reading
A Scatter Plot (also known as a scatter Chart, and Correlation Plot) is a tool for analyzing the relationship between two variables, used to determine the degree of correlation between two variables. One variable is plotted on the horizontal axis and the other on the vertical axis. The pattern of their intersection points graphically displays the relational pattern. It is one of the Seven Basic Tools of Quality.
Continue reading