Infographics refers to the visual representation of data, information or knowledge. Infographics are used as a powerful tool that allows people to easily digest information through the use of perspective data, charts, and statistics.
Continue readingKategoria: Infographics
A Comprehensive Guide to 5 Why Analysis
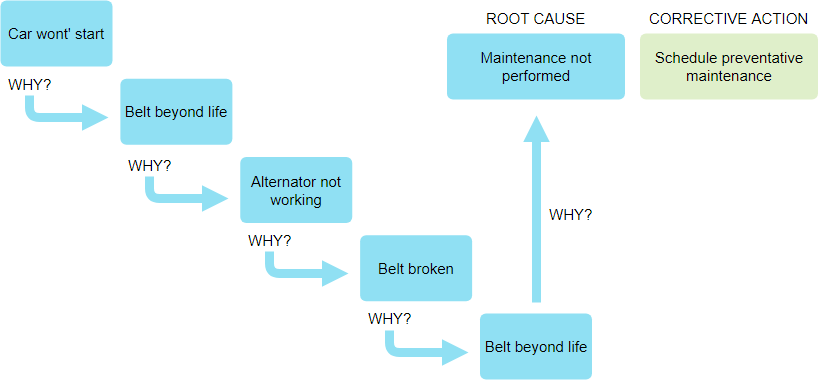
The 5 Whys is a simple tool used to help you understand what’s causing a problem by using an iterative interrogative technique to explore the root cause underlying a particular problem. As the name suggested, 5 Whys takes five iterations of asking “Why” to drill down from one symptom to another until you reached the root cause (Sometimes asking “Why?” five times is too many, and sometimes you need to ask it more than five times).
Continue readingVenn Diagram: A Comprehensive Tutorial
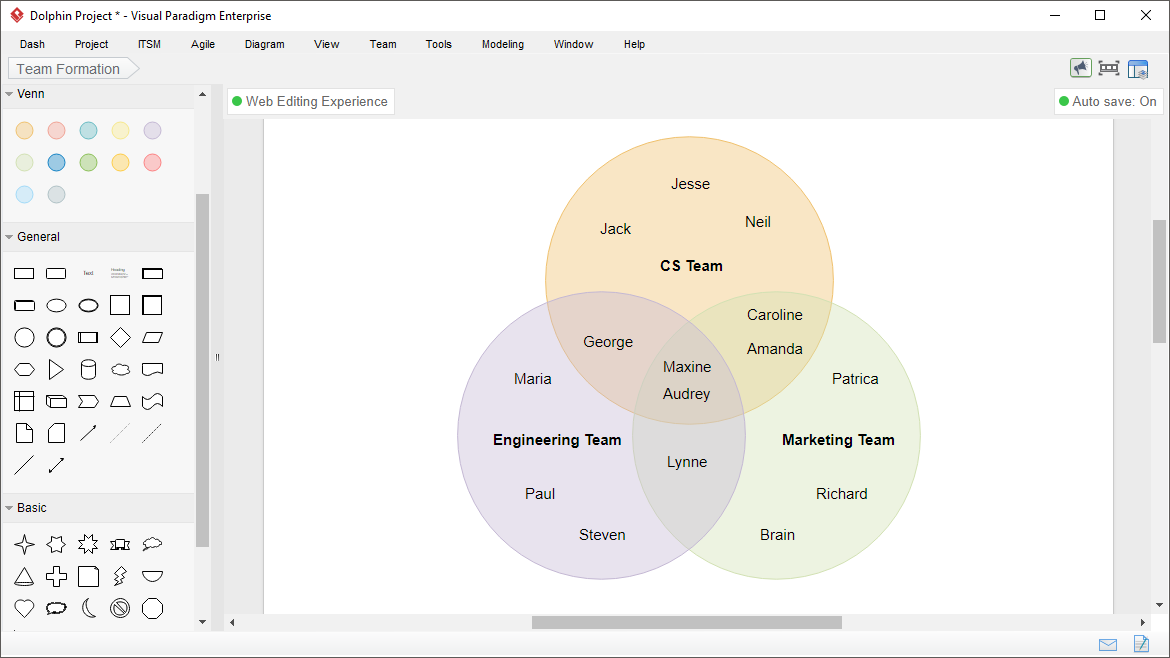
Venn diagrams are graphical or pictorial representations of relationships between different groups of things. Venn Diagram was invented by John Venn around 1880. Venn diagrams are also called set diagrams. Venn diagrams give a logical representation of the groups or sets. Relationships between two or three sets can be easily understood with the help of Venn diagrams. In mathematics, Venn diagrams are used to analyze known information obtained from surveys, data reports, and tables.
Continue readingVisualize Data with Online Charts
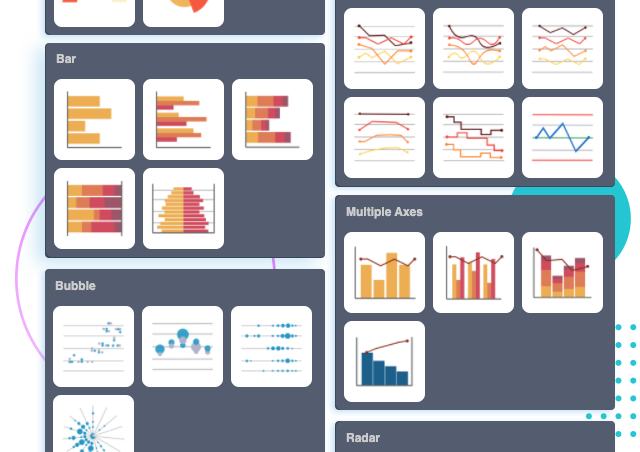
Choose from over 50 chart types to find the perfect representation of your data. Both common and advanced chart types are supported, including bar, line, area, pie, doughnut, radar, and rose charts. Visualize your data and statistics quickly and easily with Visual Paradigm’s online chart maker.
Continue readingThe Best Easy Dashboard for BI 2019
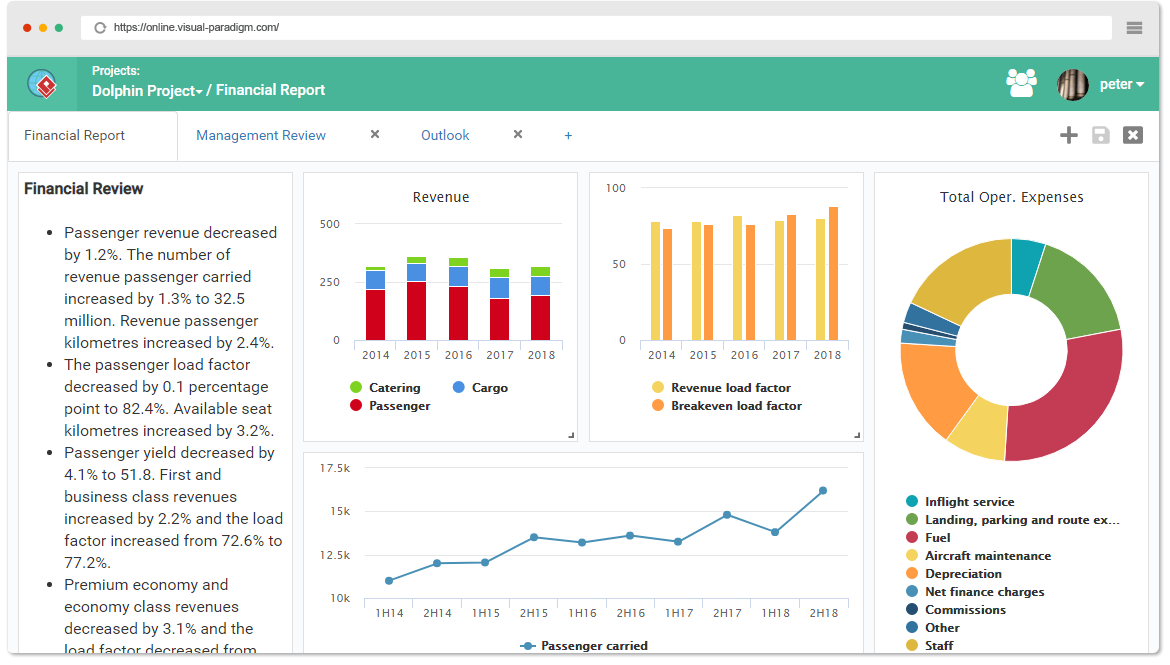
The latest update of Visual Paradigm Online features a powerful dashboard software, which is a highly configurable data visualization tool that help people see and understand their data easily. Visual Paradigm Online helps you visualize your data into valuable insights. Build dashboards and perform ad-hoc data analyses in just a few steps. A wide range of chart and graph are available to fulfill different business needs. Together with the intuitive spreadsheet editor, anyone can visualize data in few minutes. No coding, just insight.
Continue readingCreate and Visualize your Visual Information in one Unified FREE Dashboard
Visualization Paradigm online helps you visualize your data into valuable insights. You can build dashboards and perform AD hoc data analysis in just a few steps. A wide range of charts and graphs are available to meet different business needs. Coupled with an intuitive spreadsheet editor, anyone can visualize data in a matter of minutes. There is no coding, only insight.
Continue reading