Czym jest Diagram Przepływu Danych?
A diagram przepływu danych jest graficzną reprezentacją przepływu danych w systemie informacyjnym. Może opisywać przychodzące przepływy danych, wychodzące przepływy danych oraz dane przechowywane. DFD nie wspomina o tym, jak dane przepływają przez system.
Technika DFDdekomponuje diagram przepływu danych na wysokim poziomie w zestaw bardziej szczegółowych diagramów, zapewniając ogólny widok całego systemu, a także bardziej szczegółową dekompozycję. Zapewnia ogólny widok całego systemu, a także bardziej szczegółową dekompozycję oraz, w razie potrzeby, bardziej szczegółowe rozbicie i opis poszczególnych działań w celu ułatwienia wyjaśnienia i zrozumienia.
W rezultacie zakres i granice systemu są wyraźnie wskazane na diagramie. Ostatecznym wynikiem dobrze opracowanego DFD jest „duży obraz”, który pokazuje, co dzieje się na każdym poziomie.
Dlaczego DFD?
Diagramy przepływu danychzapewniają graficzną reprezentację systemu, która ma być dostępna dla
specjalistów komputerowych oraz użytkowników niespecjalistycznych.Jest to graficzna reprezentacja, która jest bardzo łatwa do zrozumienia, ponieważ pomaga wizualizować treść.
Modele umożliwiają inżynierom oprogramowania, klientom i użytkownikom skuteczną współpracę podczas analizy i specyfikacji wymagań.
Chociaż oznacza to, że nasi klienci muszą zrozumieć techniki modelowania i konstrukcje, w modelowaniu przepływu danych używa się tylko ograniczonego zestawu konstrukcji, a stosowane zasady są zaprojektowane tak, aby były proste i łatwe do śledzenia.
Oto korzyści z techniki DFD:
- Jest to prosta technika graficzna, która jest łatwa do zrozumienia.
- Może być łatwiej zrozumiana przez publiczność techniczną i nietechniczną.
- Pomaga opisać granice systemu.
- Ułatwia komunikację istniejącej wiedzy o systemie do użytkowników końcowych.
- Zapewnia szczegółową reprezentację komponentów systemu.
- Jest używany jako część dokumentacji systemu.
DFD vs Diagram Przepływu
Istnieje znacząca różnica między DFD a diagramem przepływu. Zasadniczo, DFD pokazuje przepływ danych; diagramy przepływu pokazują przepływ kontroli.
- Diagram przepływu opisuje przepływ kontroli w module programu i pomaga zobrazować kroki do rozwiązania problemu.
- DFD ilustruje wejścia, wyjścia, jak dane będą przepływać przez system i gdzie dane będą przechowywane. Nie zawiera żadnych elementów kontrolnych ani rozgałęzień.
Elementy DFD
- Podmioty – Podmioty są źródłem i celem danych informacyjnych. Podmioty są reprezentowane przez
prostokąty i mają swoje własne nazwy.

- Procesy – Działania i czynności wykonywane na danych są reprezentowane przez okrągłe lub okrągłe prostokąty.

- Przechowywanie Danych – Istnieją dwie warianty przechowywania danych – może być reprezentowane jako – 1. Może być reprezentowane jako prostokąt bez dwóch małych krawędzi, 2) lub jako otwarty prostokąt z tylko jedną krawędzią
Otwarty prostokąt z brakującymi krawędziami.

- Przepływ Danych – ruch danych jest reprezentowany przez ostre strzałki. Ruch danych jest pokazany jako idący od dołu strzałki jako jego źródło do głowy strzałki jako jego cel.

Przykład Przepływu Danych – e-Banking
Kierownik banku przekazuje nowe dane konta do otwartego procesu Konta, co skutkuje tym, że dane klienta są przechowywane w bazie danych Klienta, a dane konta są przechowywane w bazie danych Konta. Chociaż używamy słowa „wynik” w naszej interpretacji, DFD nie sugeruje przyczynowości; Wszystko, co pokazuje, to że proces otwierania konta może odczytywać dane z interfejsu kierownika banku bez zapisywania danych do bazy danych klienta i bazy danych konta w określonej kolejności.
Klient korzystający z procesu logowania do bankowości internetowej musi podać pewne dane, takie jak nazwa użytkownika i hasło, w formie zestawu danych logowania.
Klient może otrzymać sumę pieniędzy z wypłaty lub wpłacić sumę pieniędzy na depozyt; W obu przypadkach skutkuje to aktualizacją salda konta w bazie danych konta (chociaż ta przyczynowość nie może być modelowana w sposób expliczny).
Klient może zainicjować proces transferu środków i musi podać cel konta oraz kwotę środków. Proces transferu środków może wysłać kwotę środków do innego banku przez inny interfejs bankowy.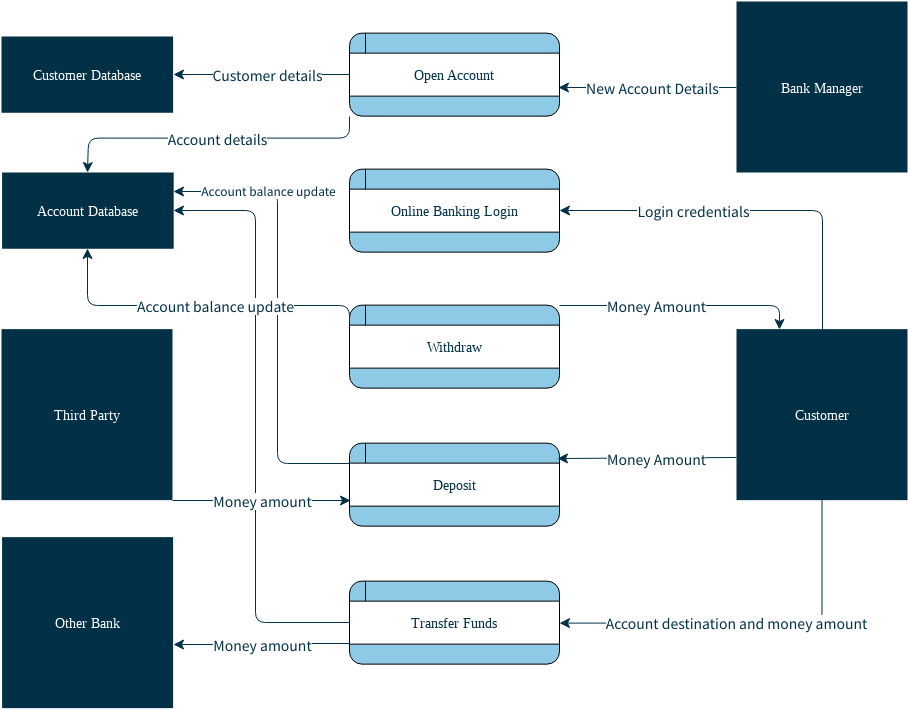
Edytuj ten przykład Diagramu Przepływu Danych
Ten przykład DFD pokazany powyżej zawiera pięć procesów, cztery zewnętrzne interfejsy/role i dwa magazyny danych. Nie ma na celu być wyczerpującą reprezentacją przepływów danych w systemie bankowym, ale jest wystarczająco kompleksowy, aby dać poczucie, jak zbudować DFD.
Technika Dekompozycji Odgórnej – Wiele poziomów DFD
Główną zaletą techniki modelowania przepływu danych jest to, że dzięki technice zwanej dekompozycją odgórną (znaną również jako „poziomowanie”), szczegółowa złożoność rzeczywistych systemów może być zarządzana i modelowana w hierarchii abstrakcji. Poziomowanie osiąga się poprzez rysowanie serii coraz bardziej szczegółowych DFD, aż osiągnięty zostanie pożądany poziom szczegółowości.
Aby uczynić DFD jeszcze bardziej złożonymi (tj. nie za dużo procesów), możesz stworzyć wielopoziomowe DFD.
- Diagram kontekstowy zawiera proces systemu kontrolnego (agregowanego).
- DFD na wyższym poziomie jest mniej szczegółowy (bardziej szczegółowy DFD jest rozwijany na niższym poziomie) zwany procesem dekompozycji odgórnej.
- Diagram kontekstowy zaczyna się od numerów procesów (np. proces 1, proces 2 itd.).
- Numeracja kontynuuje się w tzw. pierwszym poziomie (DFD). Na przykład proces 1 w diagramie kontekstowym jest rozwijany w trzy procesy w DFD poziomu pierwszego i jest numerowany 1.1, 1.2 i 1.3.
- Podobnie, procesy w drugim poziomie są numerowane, np. 2.1.1, 2.1.2, 2.1.3 i 2.1.4. Numeracja procesów w hierarchii:
- (1, 2, 3,…);
- (1.1, 1.2, 1.3, …, 2.1, 2.2, 2.3,…);
- (1.1.1, 1.1.2, 1.1.3,…).
- Liczba poziomów zależy od wielkości modelu systemu.
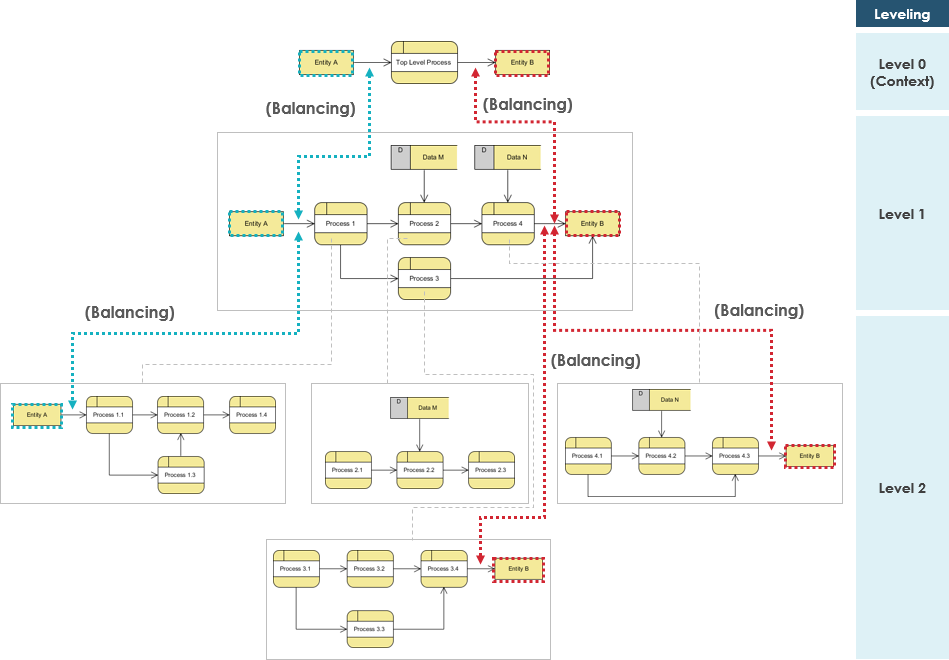
Podczas wykonywania dekompozycji odgórnej do DFD na niższe poziomy DFD, wejścia i wyjścia muszą być zachowane między poziomami DFD. Na przykład, poziom n i n+1 muszą mieć te same wejścia i wyjścia
Przykład DFD – system zamawiania jedzenia
Diagram kontekstowy (Poziom 0 – DFD)
Diagram kontekstowy pokazuje przegląd systemu i jak wchodzi w interakcję z innymi częściami „świata”. Diagram kontekstowy to diagram przepływu danych, który pokazuje tylko najwyższy poziom, zwany poziomem 0. Na tym poziomie jest tylko jeden widoczny węzeł procesu, który reprezentuje funkcjonalność całego systemu, tj. jak wchodzi w interakcję z podmiotami zewnętrznymi. Niektóre z korzyści płynących z diagramu kontekstowego to.
- Pokazuje przegląd granic systemu
- Dzięki swojej prostej notacji nie wymaga wiedzy technicznej do zrozumienia
- Łatwy do narysowania, modyfikacji i rozwinięcia dzięki ograniczonej notacji
Rysunek poniżej pokazuje diagram kontekstowy (diagram przepływu danych na najwyższym poziomie) stworzony dla systemu zamawiania jedzenia.
- Zawiera proces (kształt) reprezentujący model systemu, w tym przypadku „system zamawiania jedzenia”.
- Pokazuje również uczestników, którzy będą wchodzić w interakcję z systemem, zwanych podmiotami zewnętrznymi.
W tym przykładzie dostawca, kuchnia, menedżer i klient są podmiotami, które będą wchodzić w interakcję z systemem.
Między procesem a podmiotami zewnętrznymi znajdują się przepływy danych (łączniki), które pokazują, że istnieje wymiana informacji między podmiotami a systemem.
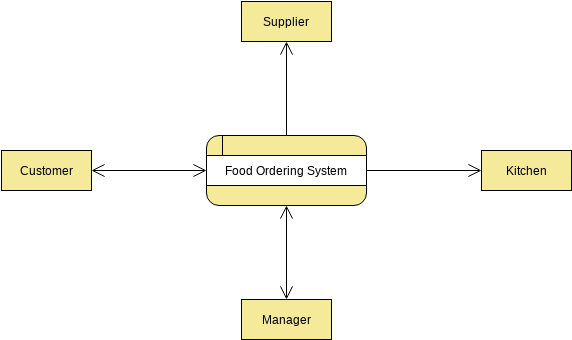
Kontekstowy DFD jest punktem wejścia do modelu przepływu danych. Zawiera jeden i tylko jeden proces i nie pokazuje żadnego przechowywania danych.
Poziom 1 DFD
Poziom 1 DFD przedstawia bardziej szczegółowy widok systemu niż diagram kontekstowy. Pokazując główne podprocesy i magazyny danych, które tworzą system.
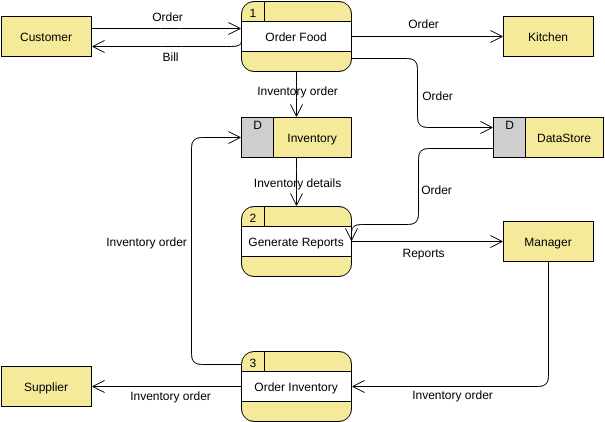
Poniższy diagram pokazuje Poziom 1 DFD, który jest rozbiciem (tj. dekompozycją) procesów systemu zamawiania jedzenia pokazanych w Kontekstowym DFD. Przeczytaj diagram, a następnie wprowadzimy kilka kluczowych koncepcji na jego podstawie.
Edytuj ten przykład Diagramu Przepływu Danych
Przykład diagramu przepływu danych systemu zamawiania jedzenia zawiera trzy procesy, cztery podmioty zewnętrzne i dwa magazyny danych.
- Zgodnie z diagramem wiemy, że klient może złożyć zamówienie. Proces zamawiania jedzenia otrzymuje zamówienie, przekazuje je do kuchni, przechowuje w magazynie danych zamówień i przechowuje zaktualizowane szczegóły zapasów w magazynie danych zapasów. Proces również zapewnia fakturowanie dla klienta.
- Menedżerowie mogą otrzymywać raporty poprzez proces Generowania Raportu, który przyjmuje szczegóły zapasów i zamówienia jako wejścia do magazynów danych zapasów i zamówień, odpowiednio.
- Menedżer może również zainicjować proces Zamówienia Zapasów, podając zamówienie na zapasy. Proces ten przekazuje zamówienie na zapasy do dostawcy i przechowuje zaktualizowane szczegóły zapasów w magazynie danych zapasów.
Logika vs Fizyczny DFD
Diagramy przepływu danych dzielą się na logiczne i fizyczne diagramy przepływu danych. Logiczy DFD koncentruje się na biznesie i jego działaniu. Opisuje wydarzenia biznesowe, które występują oraz dane wymagane i generowane dla każdego wydarzenia. Fizyczny DFD z kolei pokazuje, jak system będzie wdrażany. Oto główne różnice między logicznym DFD a fizycznym DFD:
Logiczny DFD
- Logiczny DFD przedstawia, jak działa biznes.
- Procesy reprezentują działalność biznesową.
- Magazyny danych reprezentują zbiór danych niezależnie od tego, jak dane są przechowywane.
- To sposób, w jaki biznes kontroluje.
Fizyczny DFD
-
- Fizyczny DFD przedstawia, jak system będzie wdrażany (lub jak działa obecny system).
- Procesy reprezentują programy, moduły programowe i procedury ręczne.
- Magazyny danych reprezentują fizyczne pliki i bazy danych, pliki ręczne.
- Pokazuje kontrole w celu walidacji danych wejściowych, uzyskania rekordu, zapewnienia pomyślnego zakończenia procesu i bezpieczeństwa systemu.
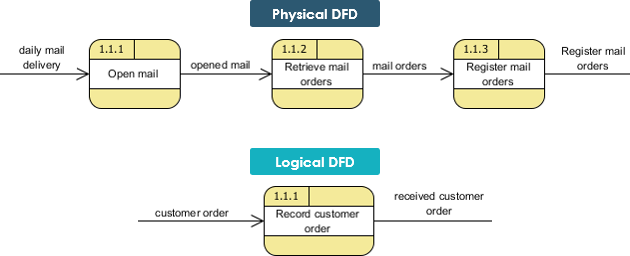
- Fizyczny DFD określa rzeczywisty przepływ fizycznej dokumentacji, podczas gdy logiczny DFD koncentruje się tylko na przepływie informacji w terminach biznesowych.
Na przykład, fizyczny DFD określa rzeczywisty przepływ fizycznej dokumentacji, podczas gdy logiczny DFD koncentruje się tylko na przepływie informacji w terminach biznesowych.
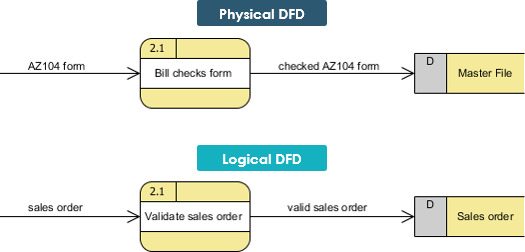
Ponadto, logiczny DFD eliminuje procesy fizyczne, które odnoszą się tylko do działań fizycznych i nie przekształcają danych.
Przykład Logicznnego DFD – Sklep Spożywczy
Logiczny DFD ilustruje zaangażowane procesy, nie wchodząc w szczegóły dotyczące fizycznej realizacji działań.

Edytuj ten przykład logicznego DFD
Przykład fizycznego DFD – Sklep spożywczy
- Fizyczny DFD pokazuje, że używany jest kod kreskowy – kod UPC PRICE, który znajduje się na większości produktów w sklepie spożywczym.
- Dodatkowo, fizyczny DFD wspomina o procesach ręcznych, takich jak skanowanie, i wyjaśnia, że używany jest plik tymczasowy do przechowywania sumy częściowej przedmiotów.
- Płatność może być dokonana gotówką, czekiem lub kartą debetową.
Na koniec odnosi się do paragonu po jego nazwie, PARAGON KASOWY.

Edytuj ten przykład fizycznego DFD.
Wskazówki i uwagi dotyczące diagramów przepływu danych.
- Nie rób tego zbyt skomplikowanym; zazwyczaj 5-7 przeciętnych osób może zarządzać procesami.
- A magazyn danych musi być powiązany z co najmniej jednym procesem.
- Przepływ danych nie powinien istnieć między 2 podmiotami zewnętrznymi bez przechodzenia przez proces.
- Proces z wejściem, ale bez wyjścia jest uważany za proces czarnej dziury.
- Etykiety procesów powinny być frazami czasownikowymi; magazyny danych są reprezentowane przez rzeczowniki.
- Podmiot zewnętrzny musi być powiązany z co najmniej jednym procesem.
- DFD są niedeterministyczne – numeracja niekoniecznie wskazuje kolejność i jest przydatna do identyfikacji procesów podczas dyskusji z użytkownikami.
- Magazyn danych nie powinien być połączony z podmiotem zewnętrznym, w przeciwnym razie oznacza to, że dajesz podmiotowi zewnętrznemu bezpośredni dostęp do swojego pliku danych.
Zasoby
- Czym jest diagram przepływu danych (DFD)?
- Jak stworzyć diagram przepływu danych (DFD)?
- Oprogramowanie do diagramów przepływu danych (DFD)
- Przykłady diagramów przepływu danych
Ten post dostępny jest również w Deutsch, English, Español, فارسی, Français, Bahasa Indonesia, 日本語, Portuguese, Ру́сский, Việt Nam, 简体中文 and 繁體中文


