Diagram przepływu danych (DFD) to metoda analizy i projektowania o ustrukturyzowanej formie. Jest to tradycyjna wizualna reprezentacja przepływów informacji w systemie. Diagram przepływu danych (DFD) jest szeroko stosowany w analizie i projektowaniu oprogramowania. Starannie wykonany i czytelny DFD może graficznie przedstawiać znaczną część wymagań systemowych.
Diagram przepływu danych (DFD) przedstawia modele logiczne i wyraża transformację danych w systemie. Zawiera mechanizm modelowania przepływu danych i wspiera dekompozycję, aby zobrazować szczegóły przepływów danych i funkcji. Diagram przepływu danych nie może przedstawiać informacji o sekwencji operacji. Dlatego nie jest to metoda modelowania procesów ani procedur.
DFD zawiera następujące cechy:
- wsparcie etapu analizy i wymagań w projektowaniu systemu;
- technika diagramowania z adnotacjami;
- opisująca sieć działań/procesów docelowego systemu;
- umożliwiająca zachowania równoległe i asynchroniczne;
- stopniowe udoskonalanie poprzez hierarchiczną dekompozycję procesów.
Kluczowe pojęcia diagramu przepływu danych
DFD przedstawia system symboli do opisu przepływów danych oraz mechanizm dekompozycji do opisu systemu na różnych poziomach szczegółowości.
Proces
Teraz chcielibyśmy krótko przedstawić kilka notacji diagramów, które zobaczysz w poniższym samouczku.
Podmiot zewnętrzny
Podmiot zewnętrzny może reprezentować człowieka, system lub podsystem. To miejsce, z którego pochodzą lub do którego trafiają określone dane. Jest zewnętrzny w stosunku do systemu, który badamy, w kontekście procesu biznesowego. Z tego powodu ludzie zwykle rysowali podmioty zewnętrzne na krawędzi diagramu.

Proces
Proces to działalność lub funkcja biznesowa, w której odbywa się manipulacja i transformacja danych. Proces można dekomponować do bardziej szczegółowych poziomów, aby przedstawić, jak dane są przetwarzane w ramach tego procesu.

Magazyn danych
Magazyn danych reprezentuje przechowywanie trwałych danych wymaganych i/lub produkowanych przez proces. Oto kilka przykładów magazynów danych: formularze członkowskie, tabela bazy danych itp.

Przepływ danych
Przepływ danych reprezentuje przepływ informacji, a jego kierunek jest przedstawiany przez główkę strzałki, która pokazuje na końcu(ach) łącznika przepływu.

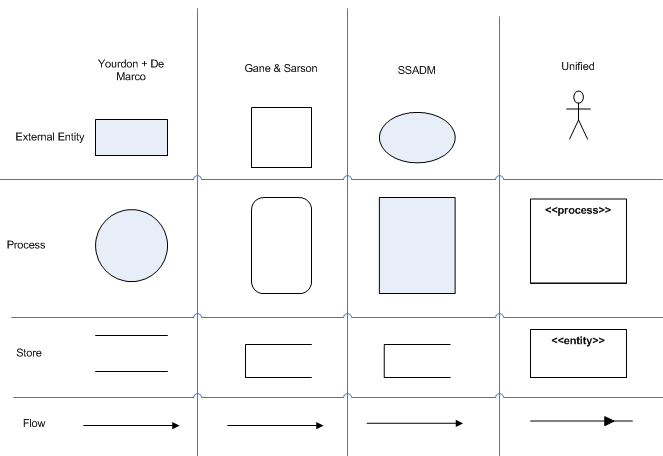
Różne notacje DFD
Istnieje kilka różnych notacji:
- Yourdon i/lub De Marco,
- Gane i Sarson,
- SSADM (Metodologia Ustrukturyzowanej Analizy i Projektowania Systemów), oraz
- Język Modelowania Zunifikowanego ma sposoby przedstawiania przepływów danych.
Jak narysować DFD z wieloma poziomami kontekstu?
Dekompozycja funkcjonalna to proces rozkładania złożonego procesu na mniejsze i prostsze części. Każda z nich może być dalej rozkładana. Gdy osiągniesz najniższy poziom dekomponowanych elementów podsystemu, programiści mogą myśleć o tym, jak zacząć kodować te funkcje. Pracując nad najprostszą funkcjonalnością, programista może pracować z docelowym systemem w fazie rozwoju. Dlatego rozwijanie i testowanie tych funkcjonalności staje się znacznie łatwiejsze.
Stworzone przez: Visual Paradigm PrzedsiębiorstwoProfesjonalny, StandardowyModelarz
Tworzenie diagramu przepływu danych na poziomie kontekstu
Diagram przepływu danych na poziomie kontekstu, znany również jako diagram poziomu 0 DFD, postrzega cały system jako jeden proces i podkreśla interakcję między systemem a podmiotami zewnętrznymi. Narysujmy diagram kontekstu DFD.
- Aby utworzyć DFD, wybierz Diagram > Nowy z paska narzędzi.
- W oknie Nowy diagram wybierz Diagram przepływu danych i kliknij Dalej.
- Wprowadź Diagram kontekstu jako nazwę diagramu i kliknij OK, aby potwierdzić.
- Nazwij diagram Diagram kontekstu.
- Musimy utworzyć główny proces. Przeciągnij Proces z paska narzędzi diagramu do diagramu. Nazwij to Księgarnia internetowa. Użyjemy księgarni internetowej jako przykładu, aby pokazać, jak stworzyć wiele poziomów DFD.
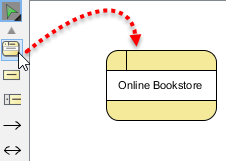
- Jak możesz sobie wyobrazić, klienci będą zamawiać książki za pośrednictwem systemu. Dlatego dodaj Zewnętrzny Podmiot do diagramu i nazwij go Klient. Podobnie jak w przypadku tworzenia procesu, możesz stworzyć zewnętrzny podmiot, przeciągając Zewnętrzny Podmiot z paska narzędzi diagramu do diagramu.

- Przepływ danych jest używany do reprezentowania ruchu danych między różnymi częściami systemu. W tym przypadku „zamówienie” to dane stworzone przez klienta i przesłane do systemu. Dlatego stwórz przepływ danych z Klient do Księgarnia internetowa. Aby to zrobić, przesuń wskaźnik myszy nad Klientem. Przeciągnij przycisk Katalog Zasobów.

- Zwolnij przycisk myszy na Księgarnia internetowa i wybierz Przepływ Danych z Katalogu Zasobów. To tworzy złącze przepływu danych.
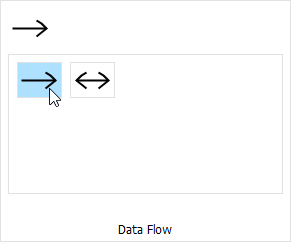
- Nazwij to zamówienie

- Księgarnia ostatecznie dostarczy książki do klienta. Skorzystaj z Katalogu Zasobów, aby stworzyć przepływ danych z Księgarnia internetowa do Klient. Nazwij przepływ zamówione książki.

- To wszystko w kontekście diagramu. Ponieważ widzimy cały system jako jeden proces, w tym poziomie DFD stworzono tylko jeden kształt procesu. W następnej sekcji rozłożysz Księgarnia internetowa proces i narysujesz jego szczegóły.
Tworzenie DFD Poziom 1
W tej sekcji zamierzasz narysować DFD poziom 1, aby pokazać główne funkcje księgarni internetowej.
- Kliknij prawym przyciskiem myszy na Księgarnia internetowa i wybierz Rozłóż z menu kontekstowego.
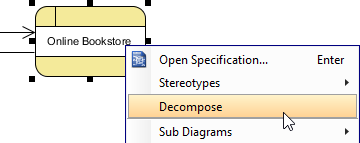
2. Magazyny danych i/lub zewnętrzne podmioty połączone z wybranym procesem będą odniesione w DFD poziom 1. Gdy zostaniesz poproszony o dodanie ich do nowego diagramu, kliknij Tak, aby potwierdzić. Zauważ, że nowy DFD powinien wyglądać bardzo podobnie do diagramu kontekstowego na początku. Każdy element powinien pozostać niezmieniony, z wyjątkiem głównego procesu (z którego ten nowy DFD się rozkłada), który teraz zniknął i został zastąpiony pustą przestrzenią (do rozwinięcia).
3. Kliknij prawym przyciskiem myszy na tle diagramu i wybierz Zmień nazwę… z menu kontekstowego. Nazwij diagram DFD Poziom 1
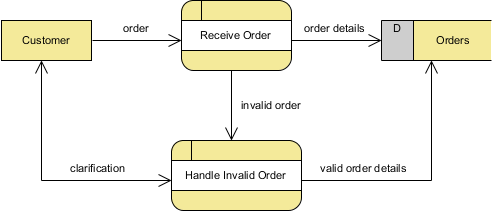
4. Istnieje proces, który przyjmuje zamówienie klienta i przechowuje je w bazie danych. Stwórzmy proces Odbierz Zamówienie oraz magazyn danych Zamówienia. Dodaj przepływy danych pomiędzy.

5. Gdy zamówienie jest nieważne, powinien istnieć inny proces, który polega na skontaktowaniu się z klientem i wyjaśnieniu jego potrzeb. Stwórz proces Obsłuż Nieważne Zamówienie. Dodaj odpowiednie przepływy danych między kształtami. Tutaj możesz użyć dwukierunkowego przepływu danych, aby przedstawić przepływ dialogu.
6. Istnieje inny proces, który zajmuje się wysyłką. Stwórz Wyślij Zamówienie proces. Ponownie dodaj odpowiednie przepływy danych między kształtami.
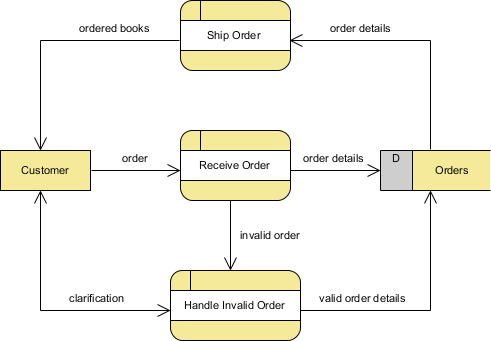
To wszystko w tym samouczku. W zależności od obszaru zainteresowania, możesz stworzyć dalsze poziomy, aby pokazać system w większych szczegółach. Jak możesz sobie wyobrazić, Wyślij Zamówienieproces można rozwinąć na mniejsze jednostki funkcjonalne (procesy) takie jak pakowanie, przygotowanie faktury, zorganizowanie dostawy itp.
Wypróbuj to samodzielnie zVisual Paradigm Online
- Darmowe przykłady i szablony diagramów przepływu danych, które można edytować w internetowym oprogramowaniu do diagramów przepływu danych: Visual Paradigm Online.
- Użyj szablonów jako punktu wyjścia do stworzenia własnego diagramu przepływu danych.
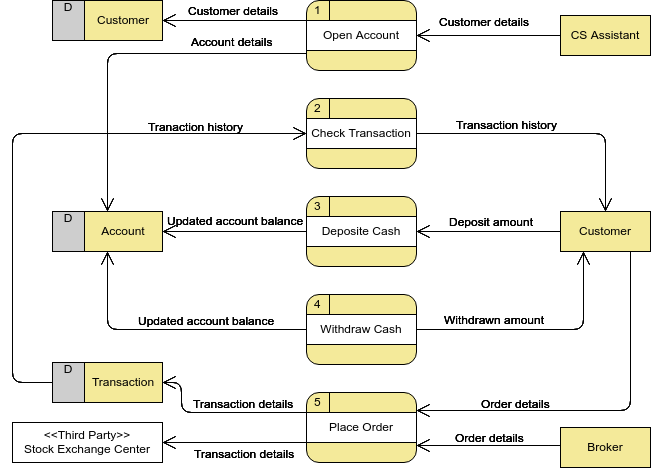
Platforma handlu papierami wartościowymi
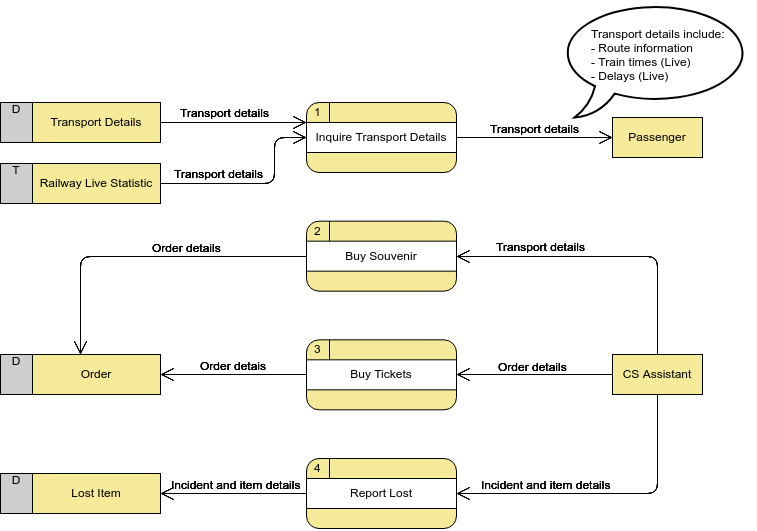
System obsługi klienta (firma kolejowa)
Inne polecane artykuły DFD
- Czym jest diagram przepływu danych (DFD)? Jak narysować DFD?
- Jak pisać skuteczne przypadki użycia?
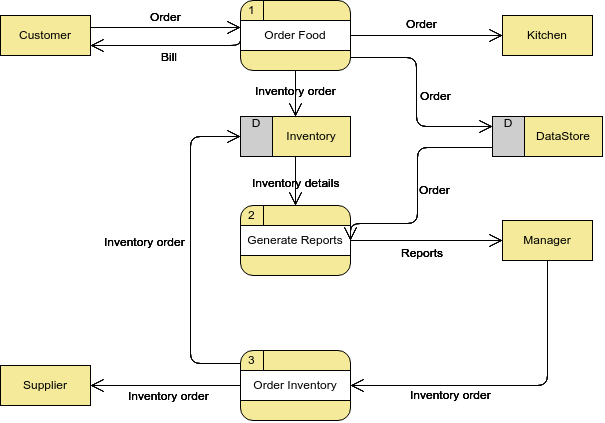
- Diagram przepływu danych: Przykłady — System zamawiania jedzenia
- Jak modelować projekt relacyjnej bazy danych za pomocą ERD?
- Jak opracować proces biznesowy w stanie obecnym i docelowym?
Ten post dostępny jest również w Deutsch, English, Español, فارسی, Français, Bahasa Indonesia, 日本語, Portuguese, Ру́сский, Việt Nam, 简体中文 and 繁體中文


