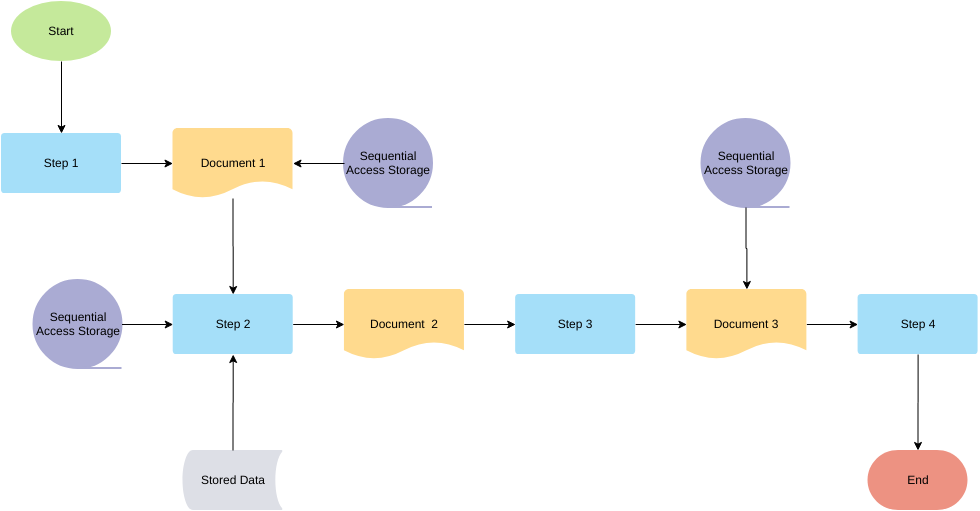
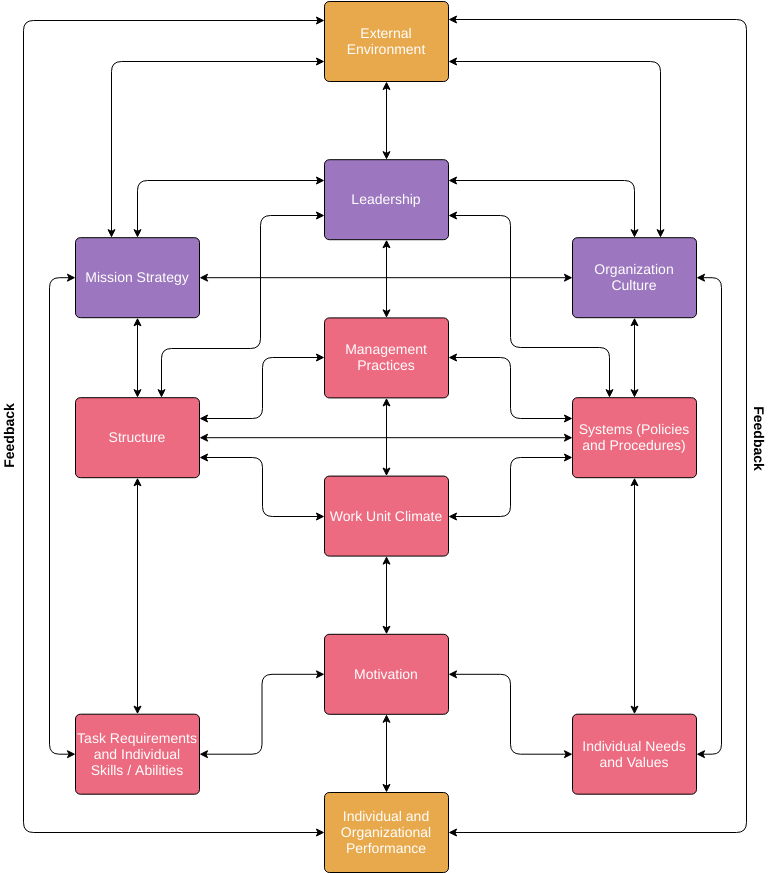
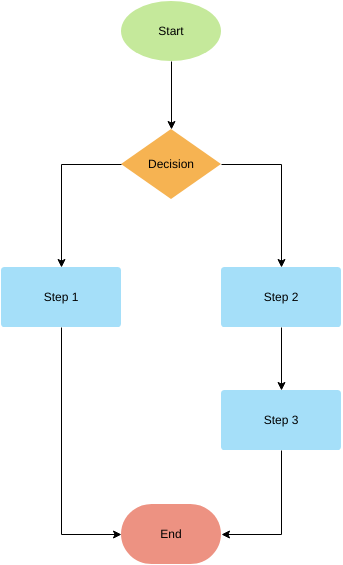
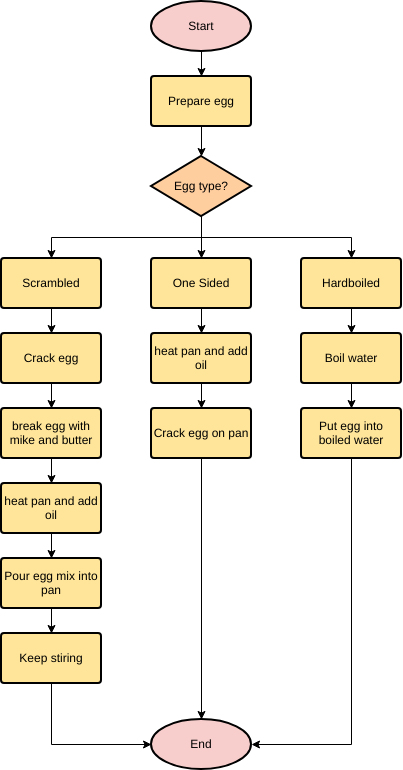
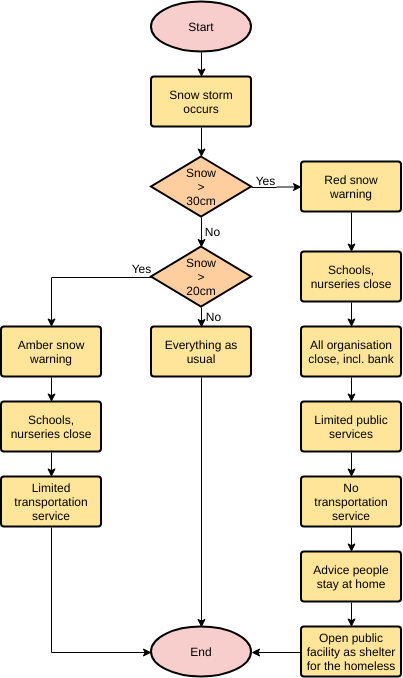
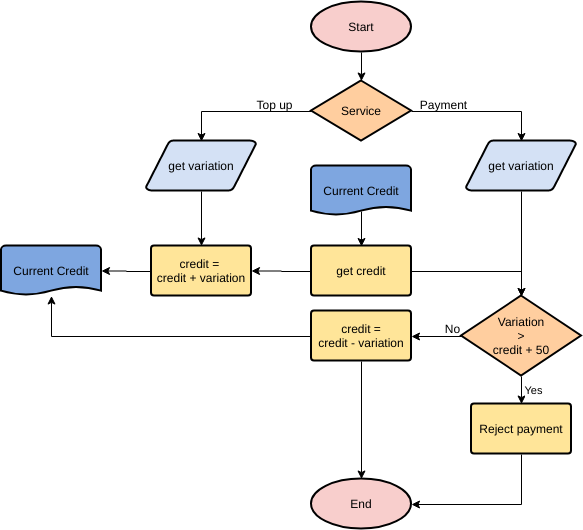
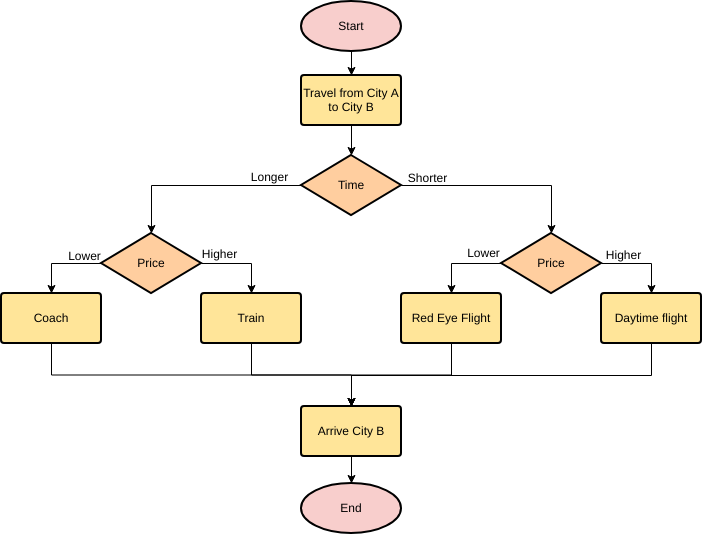
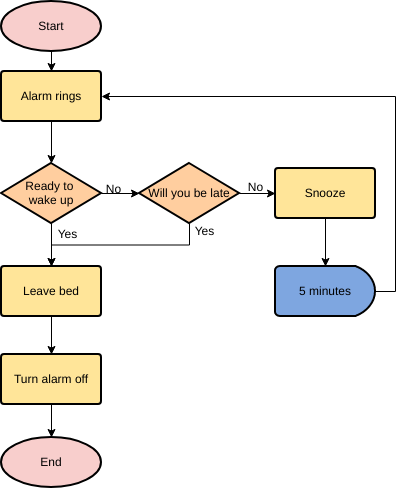
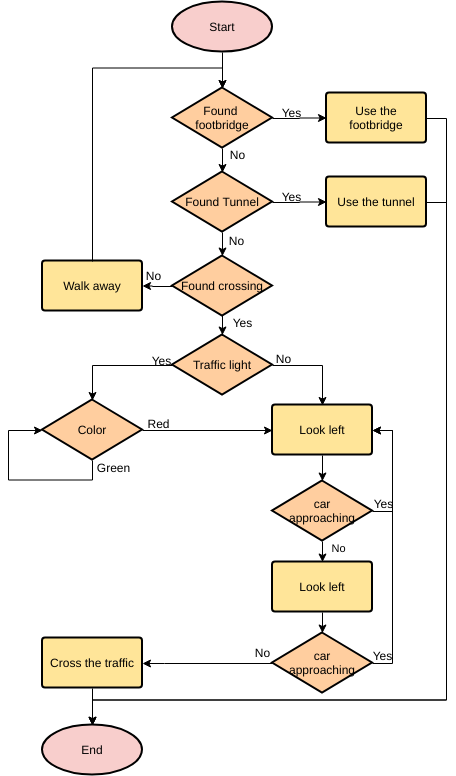
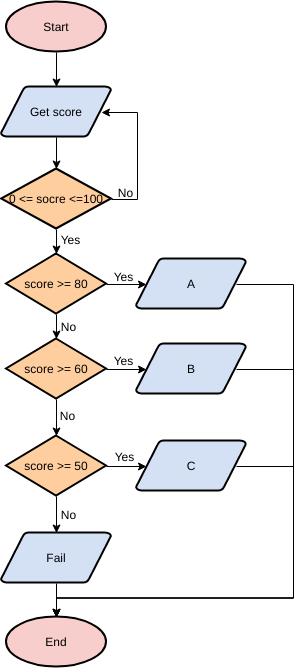
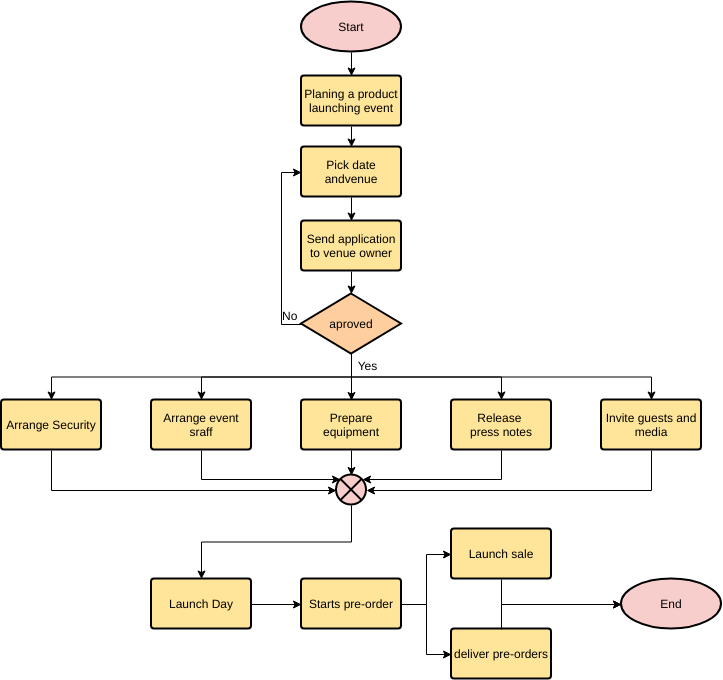
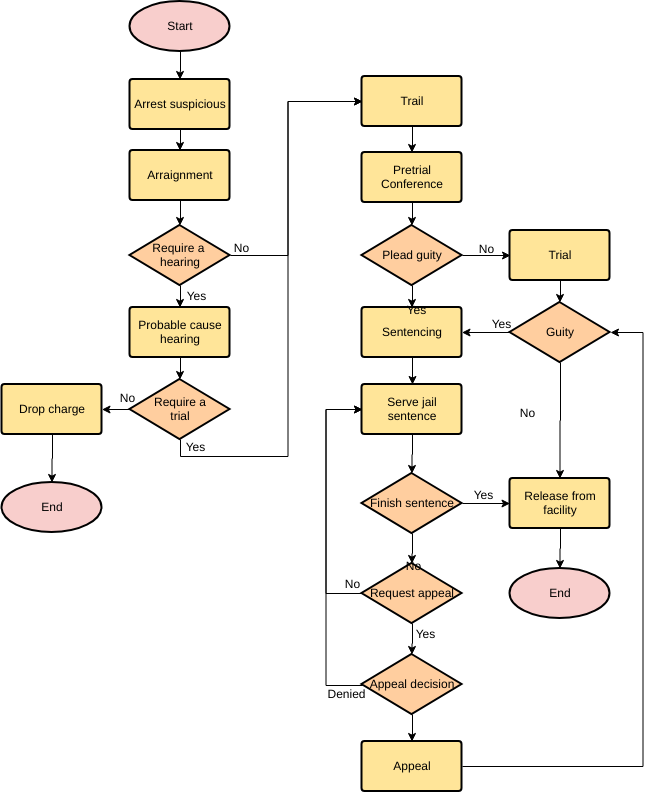
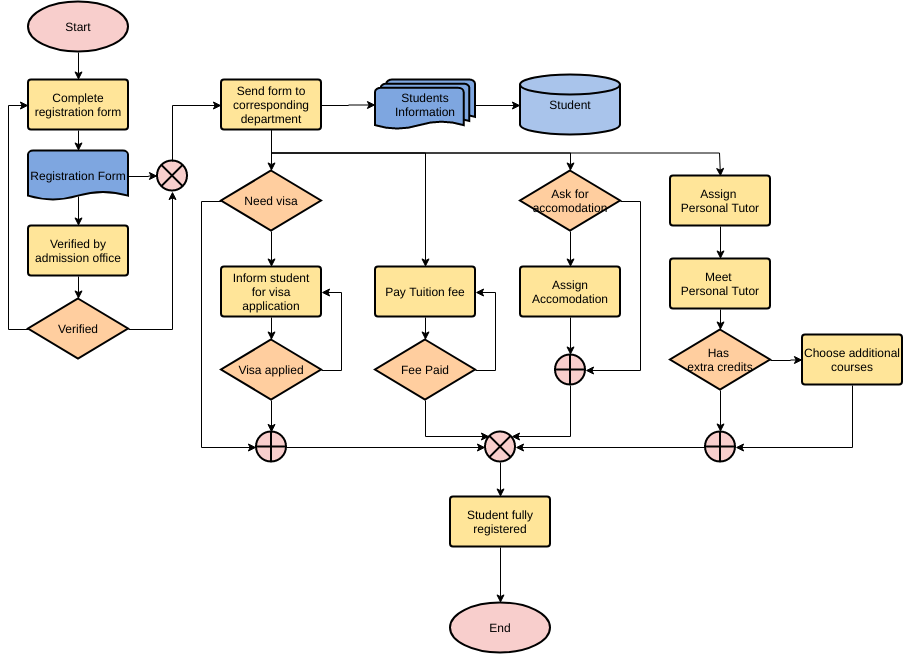
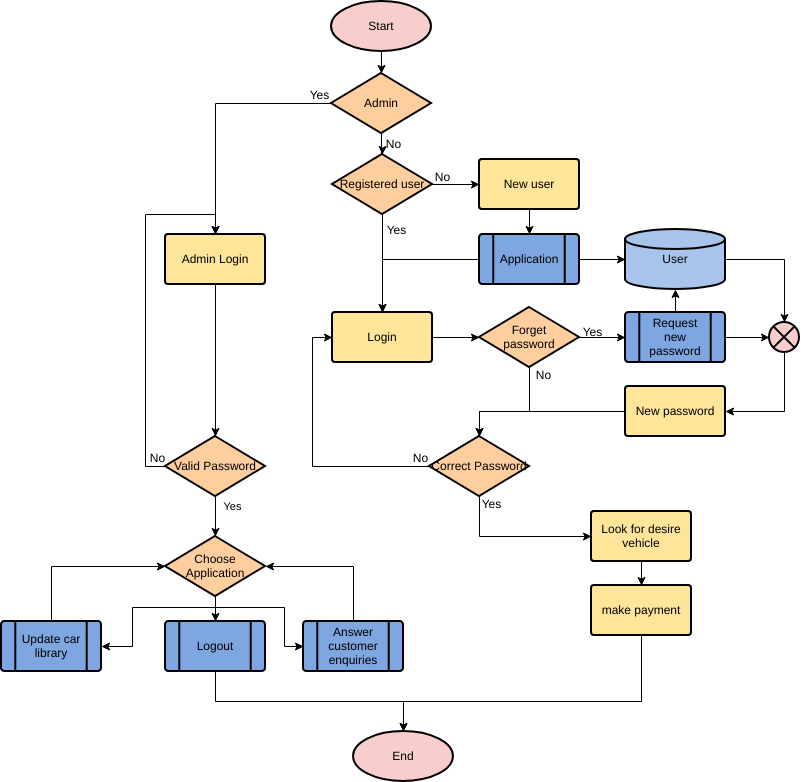
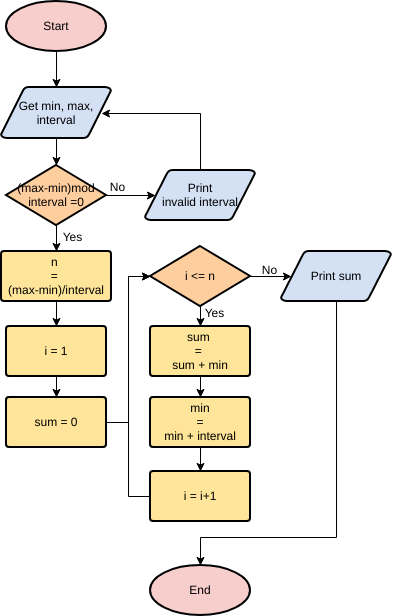
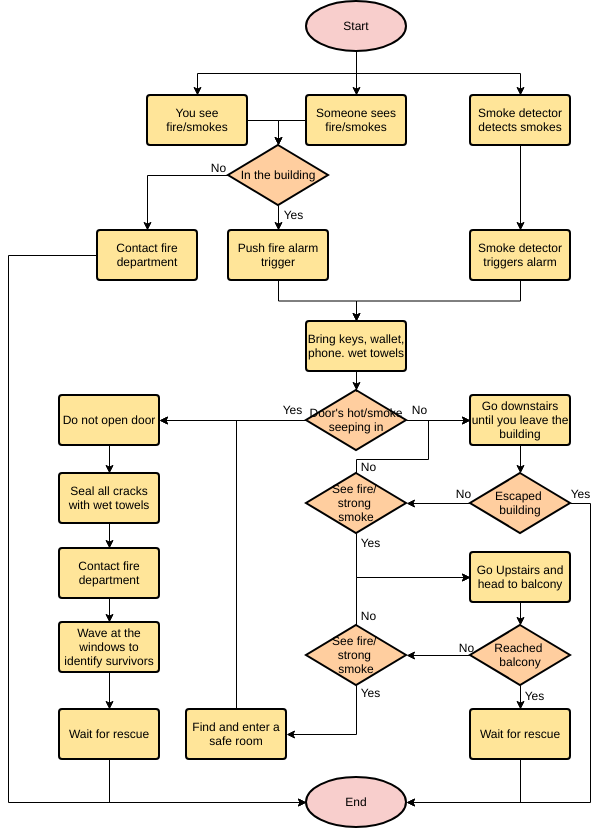
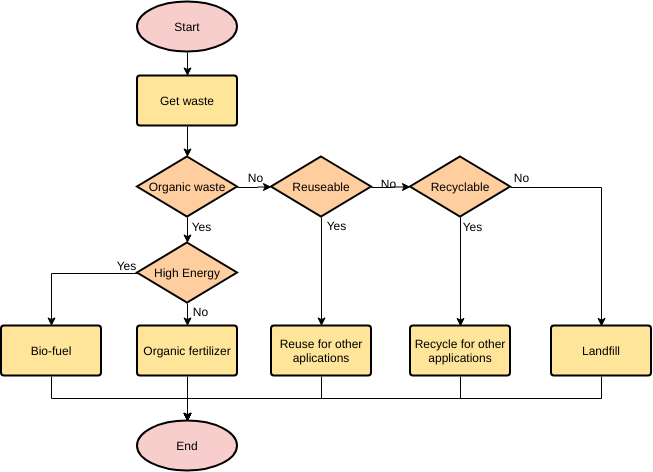
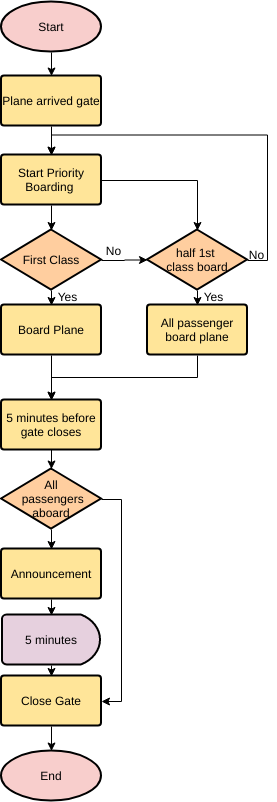
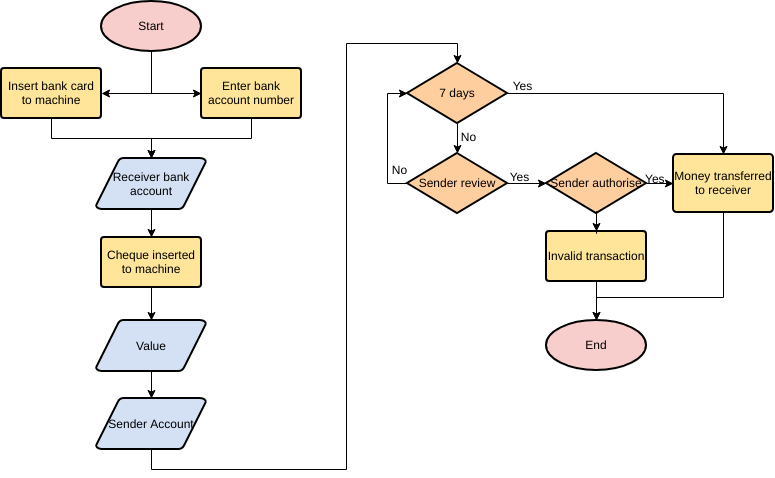
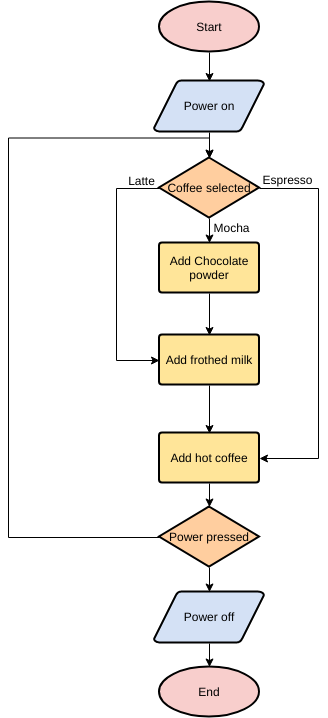
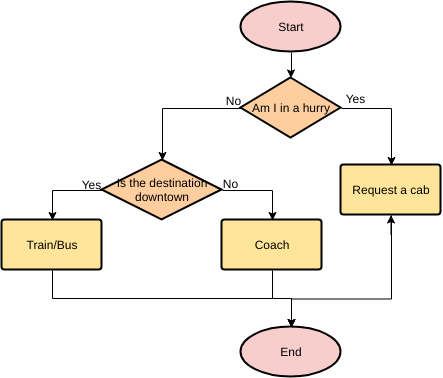
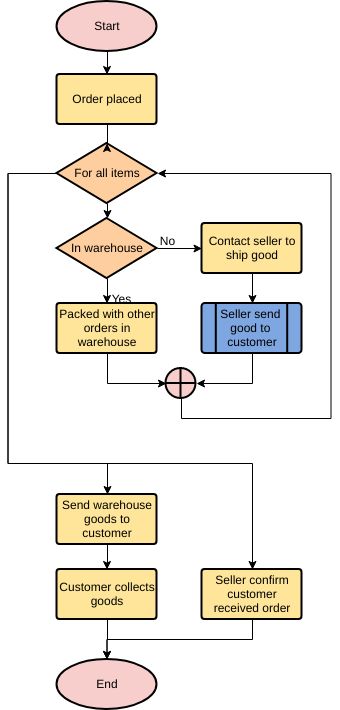
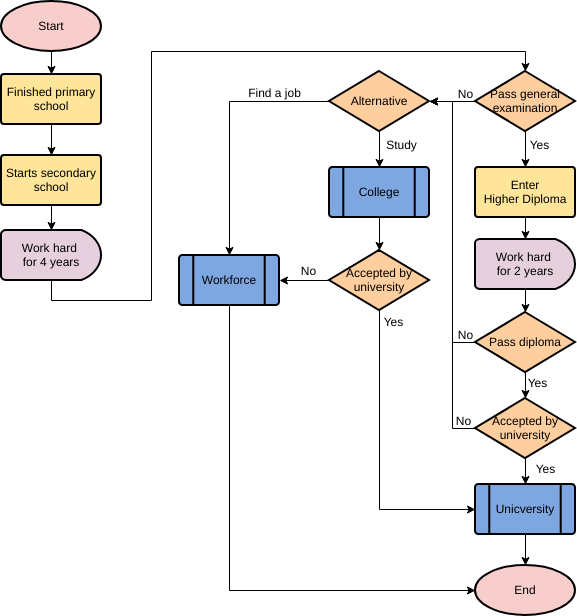
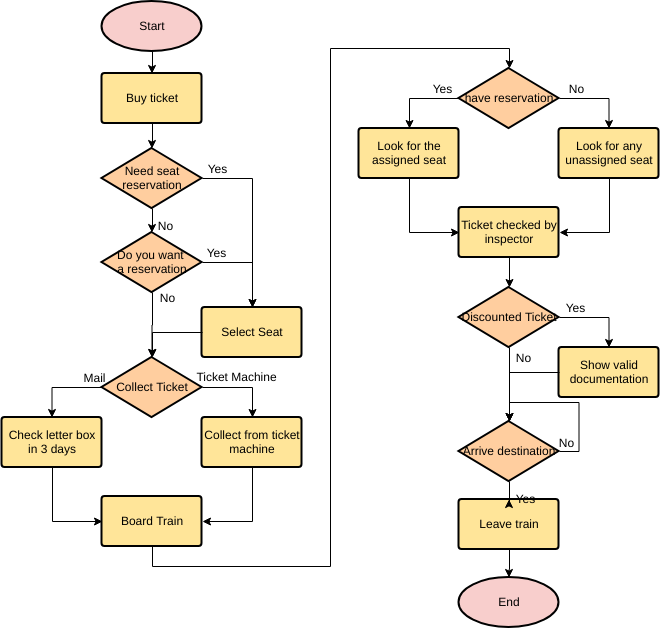
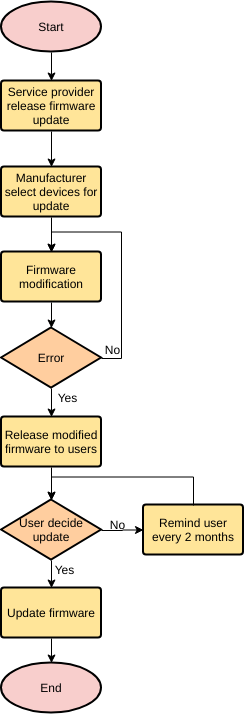
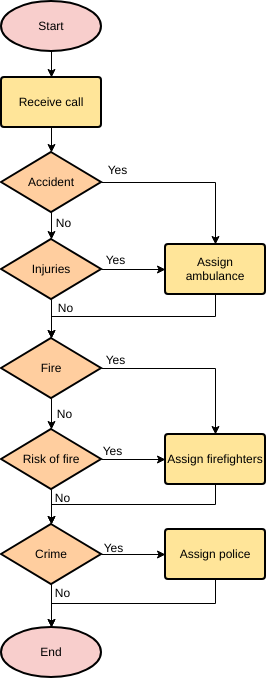
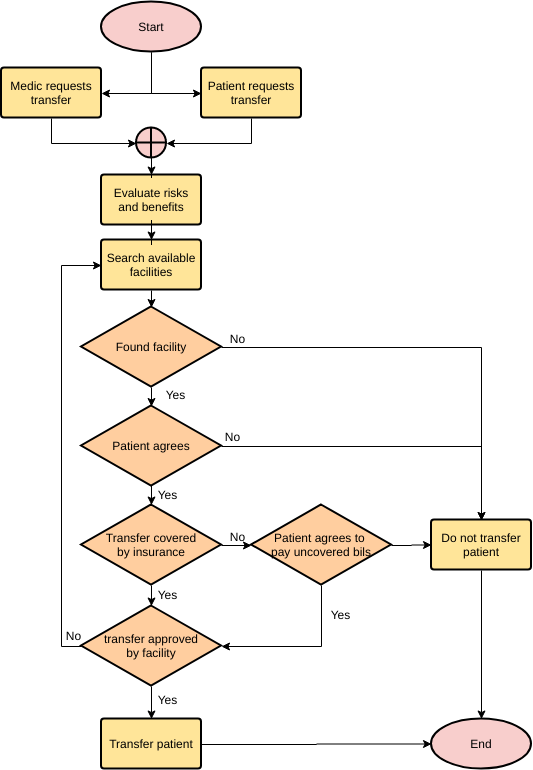
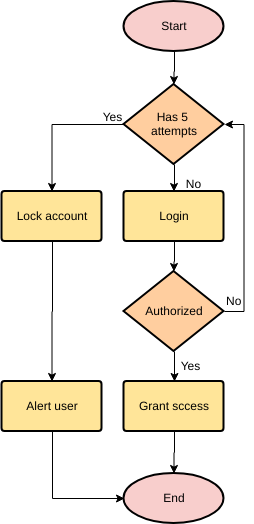
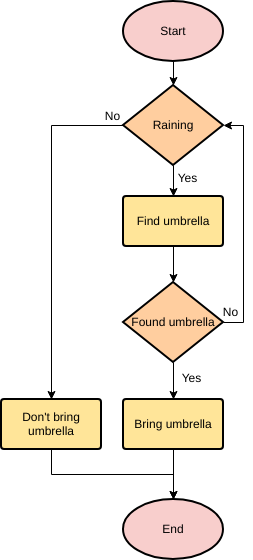
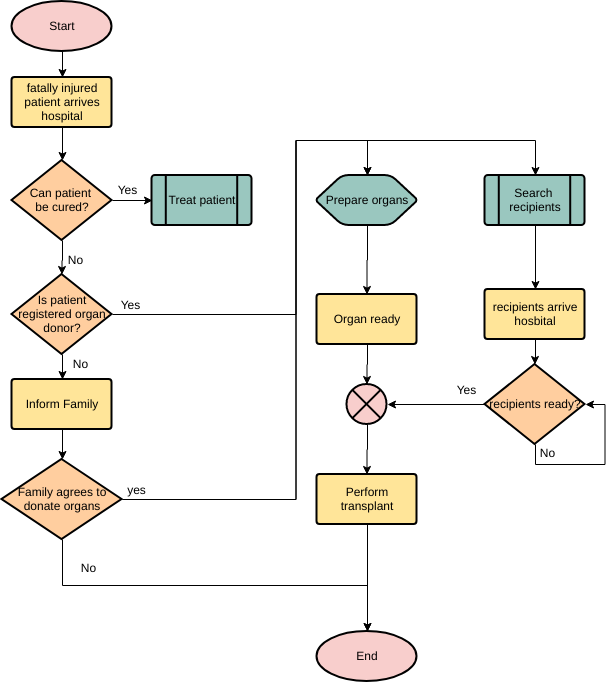
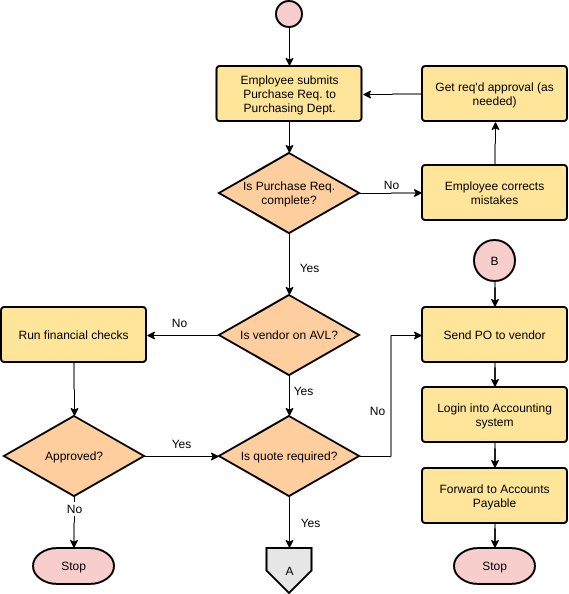
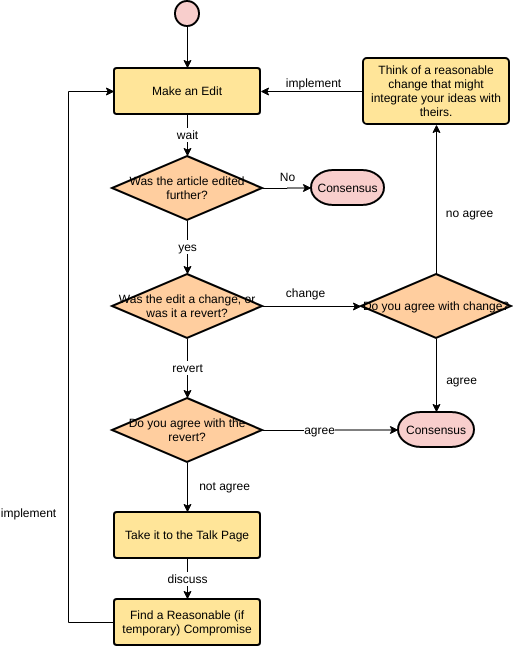
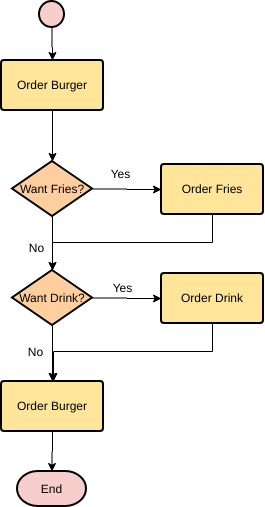
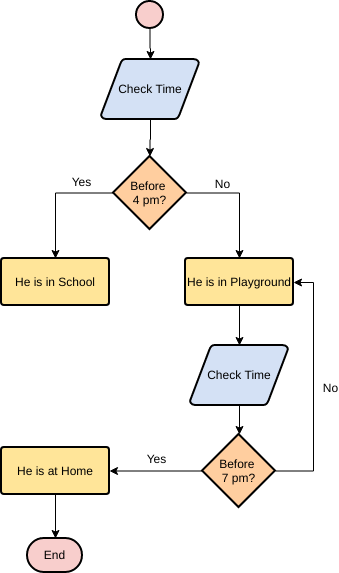
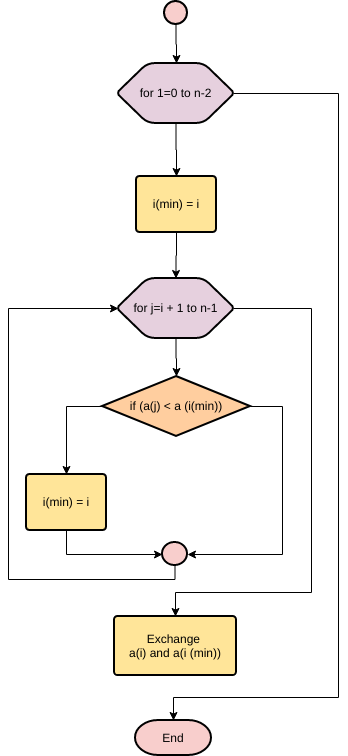
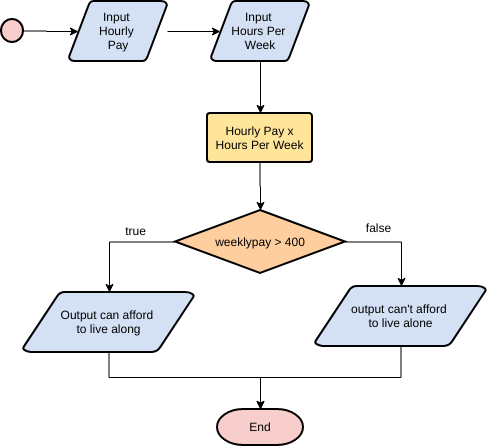
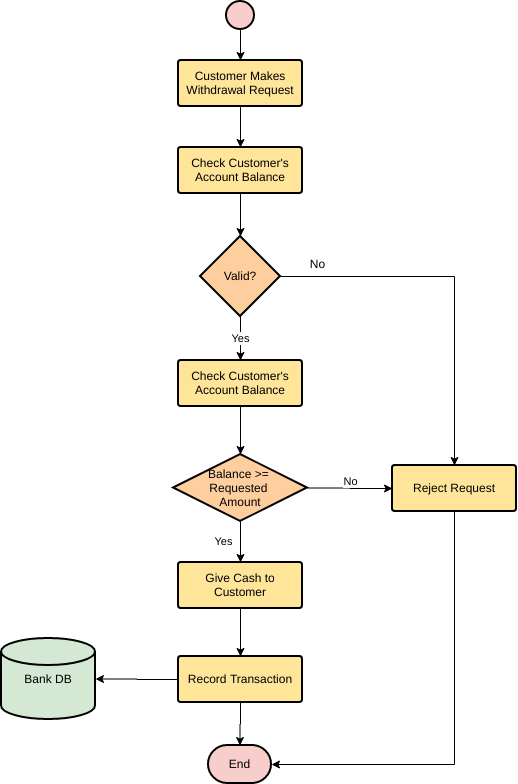
Diagram przepływu to graficzna reprezentacja algorytmu, przepływu pracy lub procesu, z różnymi typami prostokątów reprezentującymi różne kroki oraz strzałkami łączącymi każde dwa kroki. Ta reprezentacja ułatwia ilustrowanie rozwiązań znanych problemów. Diagramy przepływu są szeroko stosowane do analizy, projektowania, dokumentowania i obsługi procesów lub procedur w wielu dziedzinach.
Czym jest diagram przepływu?
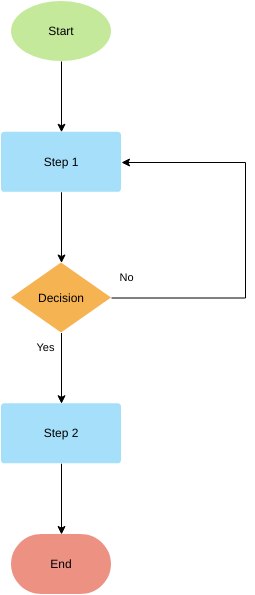
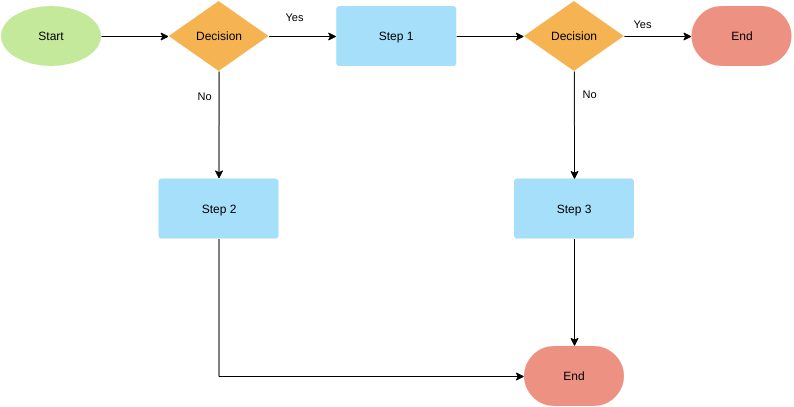
Diagramy przepływu mogą być używane do projektowania lub dokumentowania szeregu prostych kroków lub procedur. Podobnie jak inne diagramy, takie diagramy mogą pomóc wizualizować, co się dzieje i ułatwić zrozumienie procesu pomiędzy. Chociaż istnieje wiele wariantów diagramów przepływu, z których każdy ma swój sposób etykietowania, większość ma następujące dwa symbole.
- Krok. Często określany jako „działanie” i zazwyczaj reprezentowany przez prostokąt.
- Decyzja. Często określana jako „działanie” i zazwyczaj reprezentowana przez prostokąt. Często reprezentowana przez romb.
Zalety i wady diagramu przepływu
- Zalety:intuicyjny, łatwy do zrozumienia, łatwy do znalezienia błędów w algorytmie, może być bezpośrednio przetłumaczony na program.
- Wady: Zajmuje dużo miejsca. Z powodu użycia linii przepływu jest zbyt elastyczny i nieograniczony. Użytkownicy mogą dowolnie zmieniać przepływ, co powoduje trudności w odczycie i modyfikacji programu, co nie sprzyja projektowaniu zorganizowanych programów.
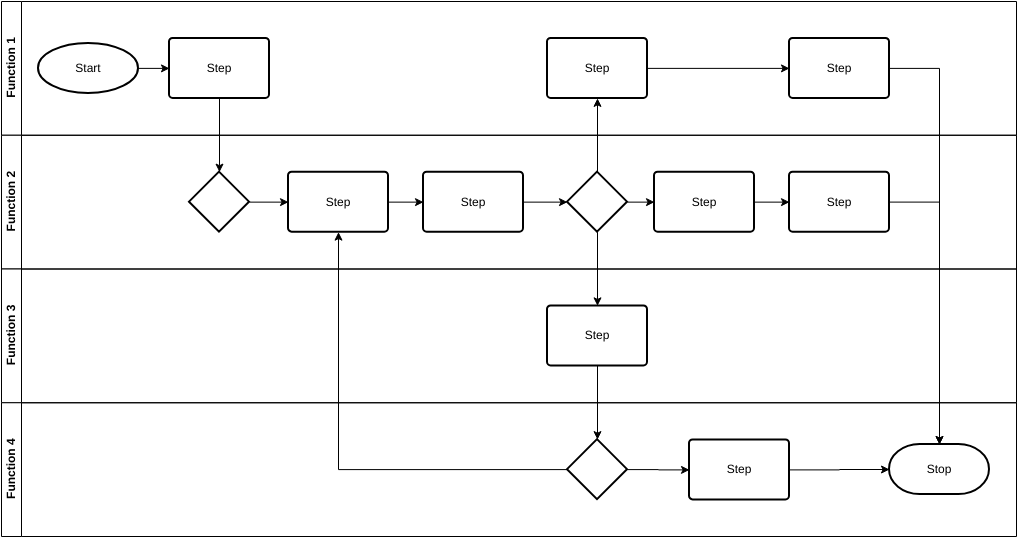
Diagram przepływu międzyfunkcyjnego
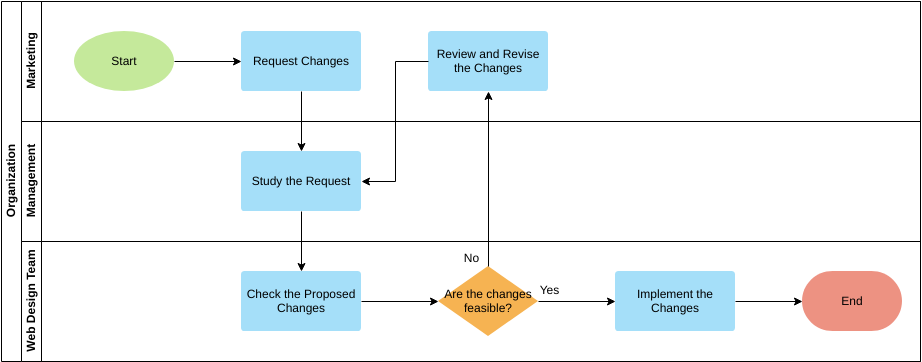
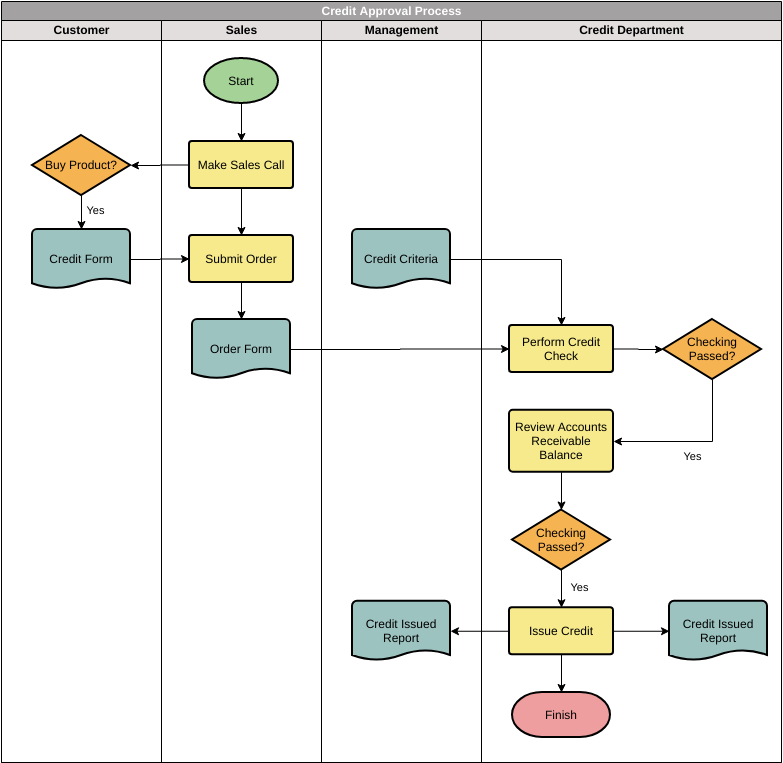
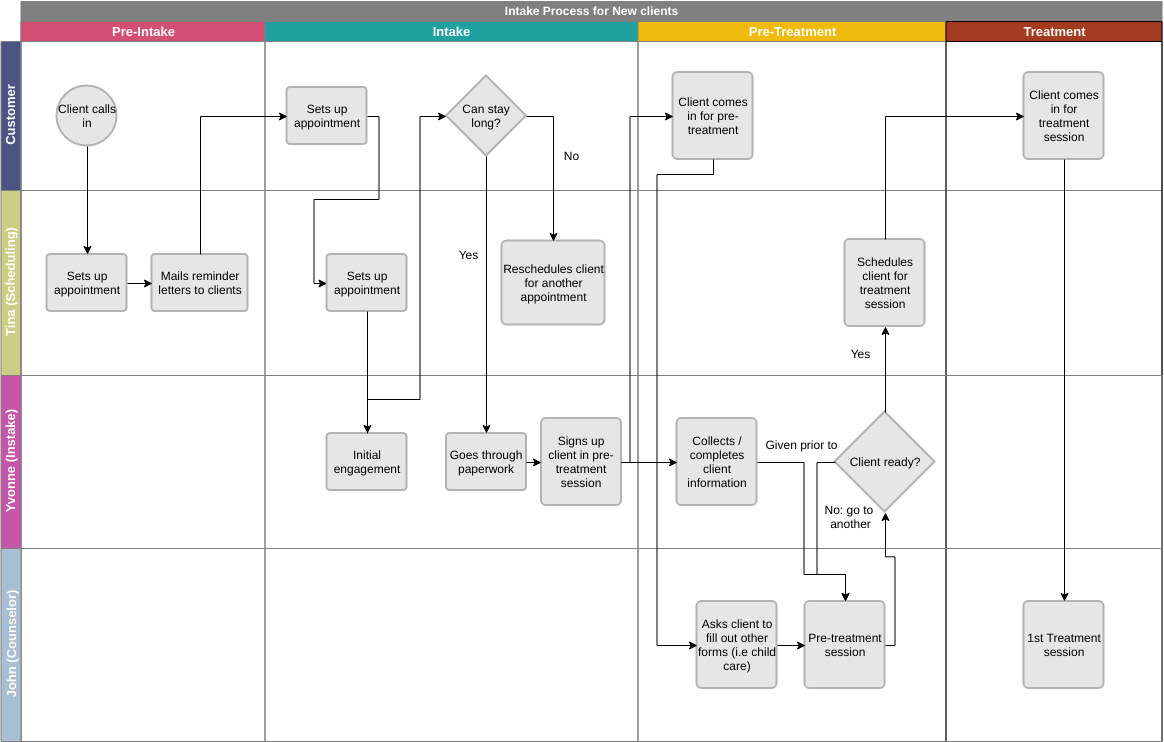
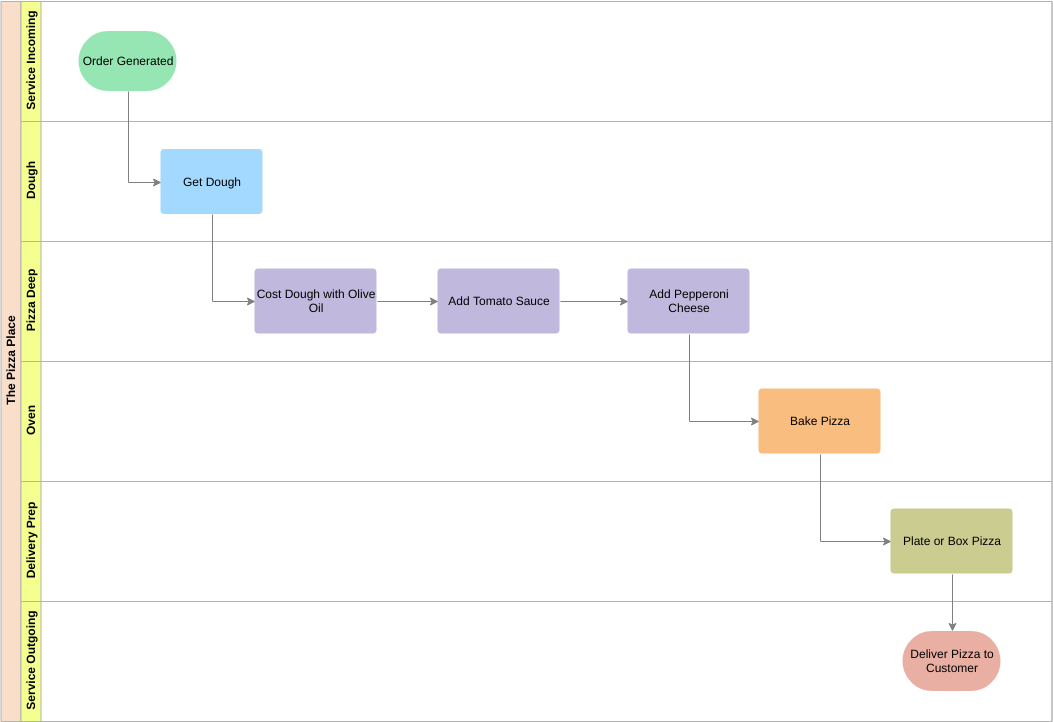
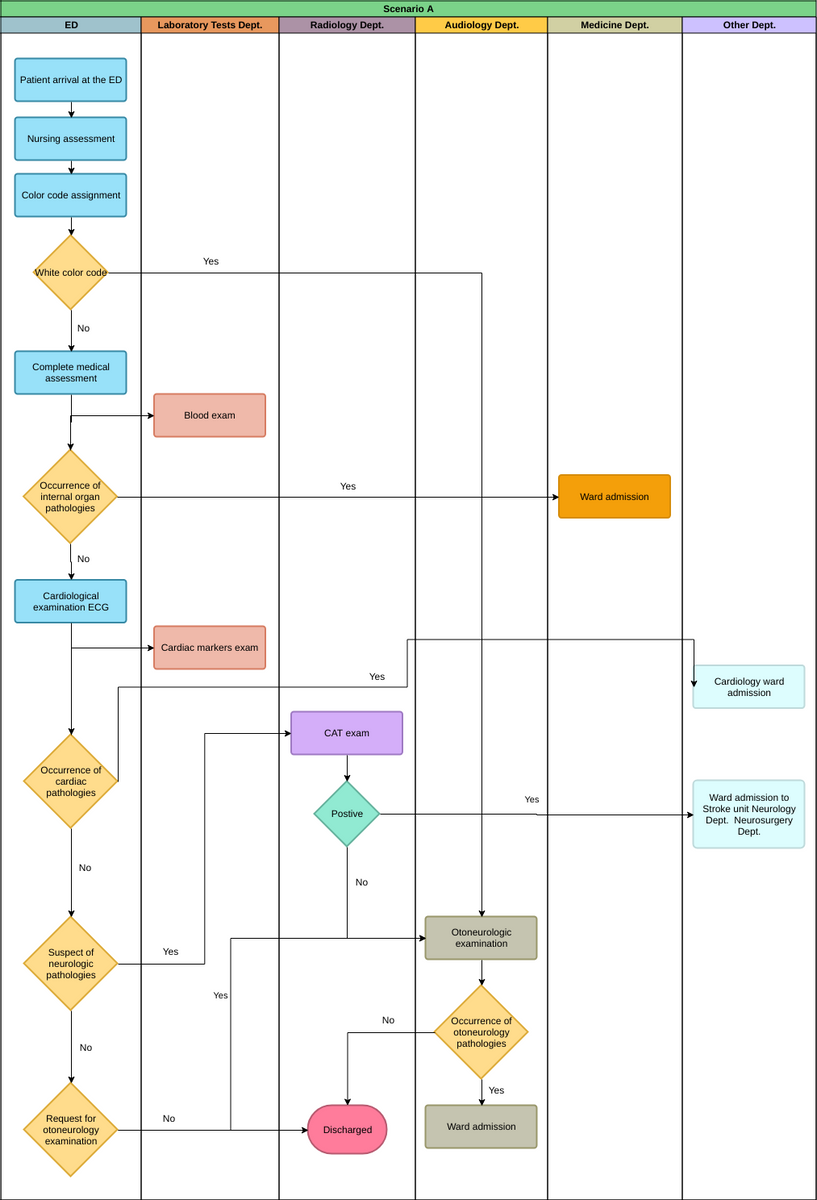
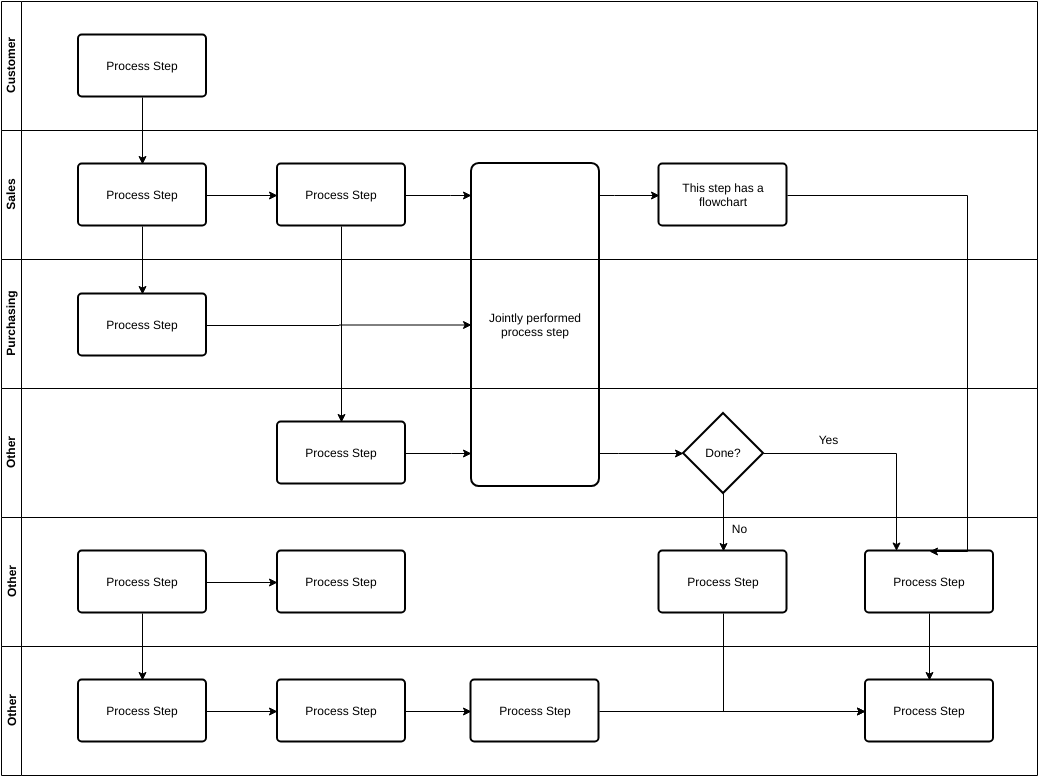
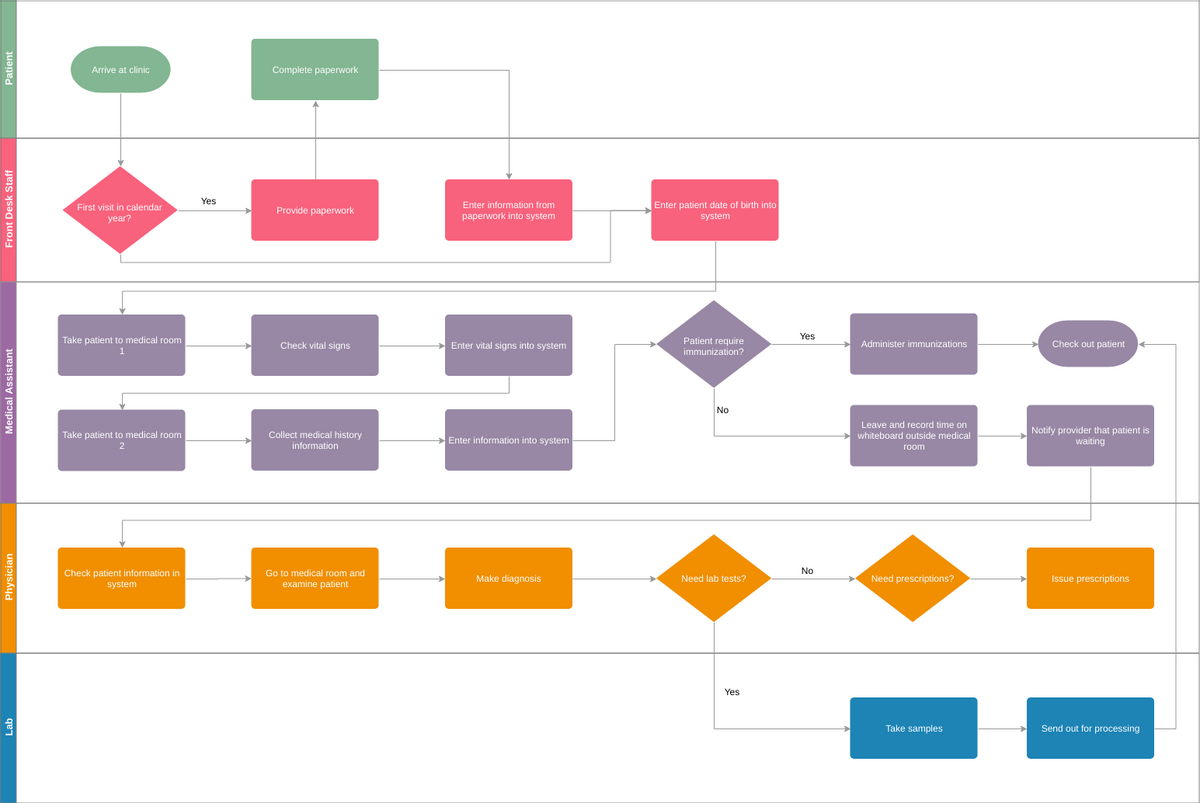
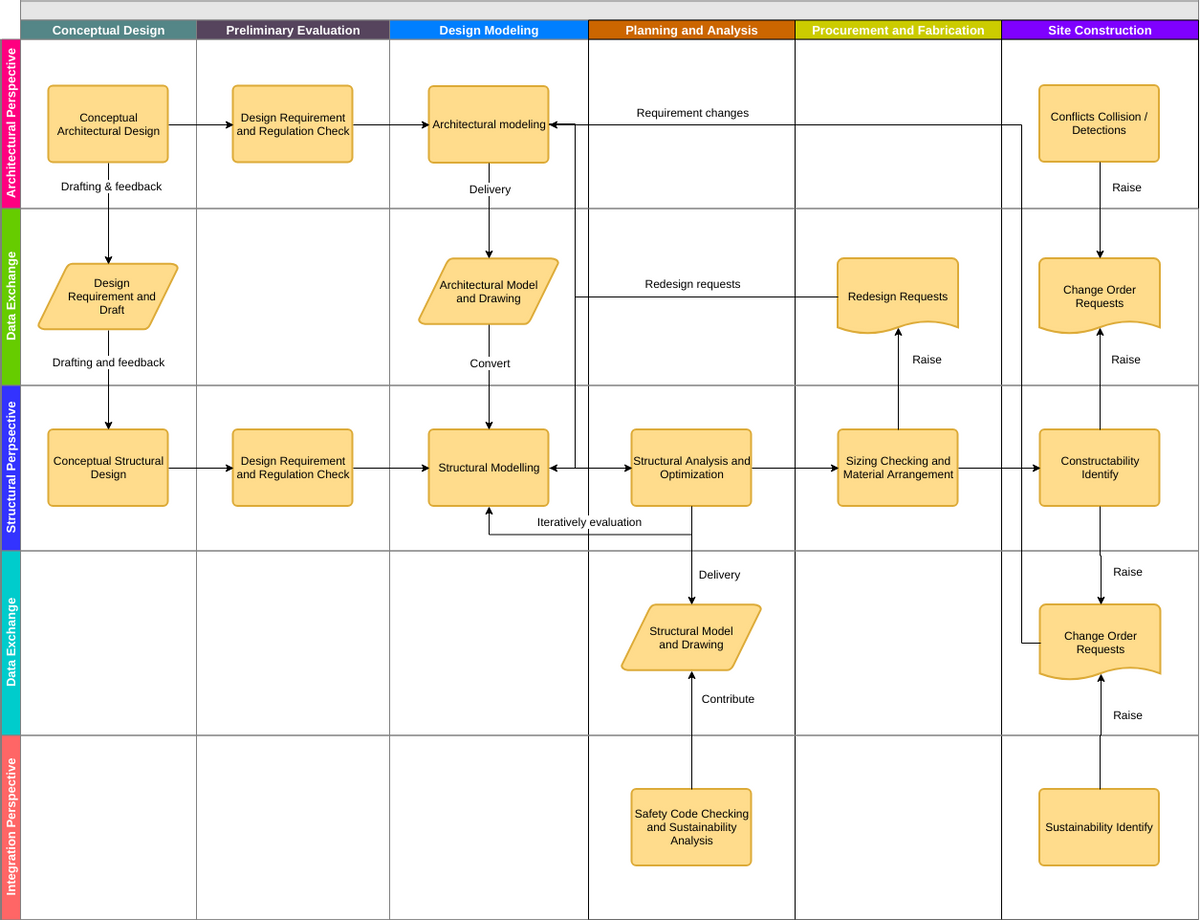
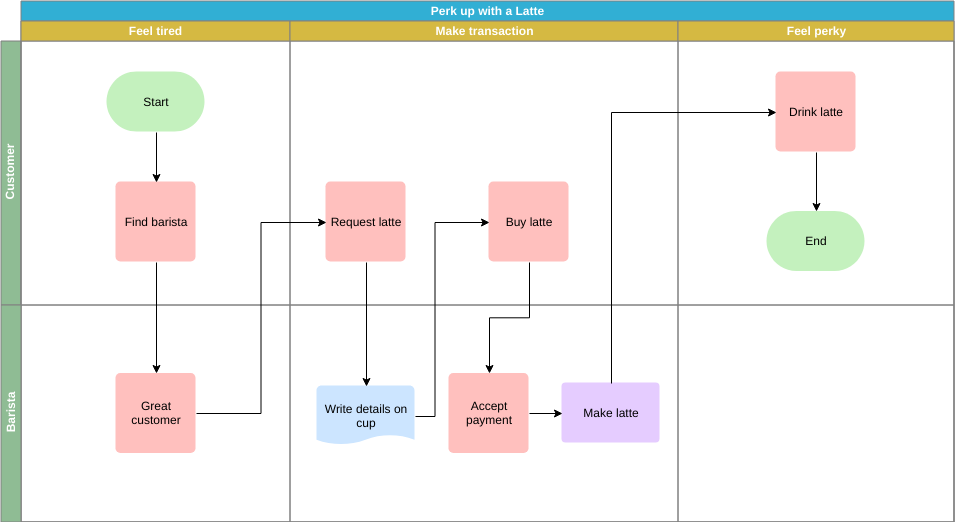
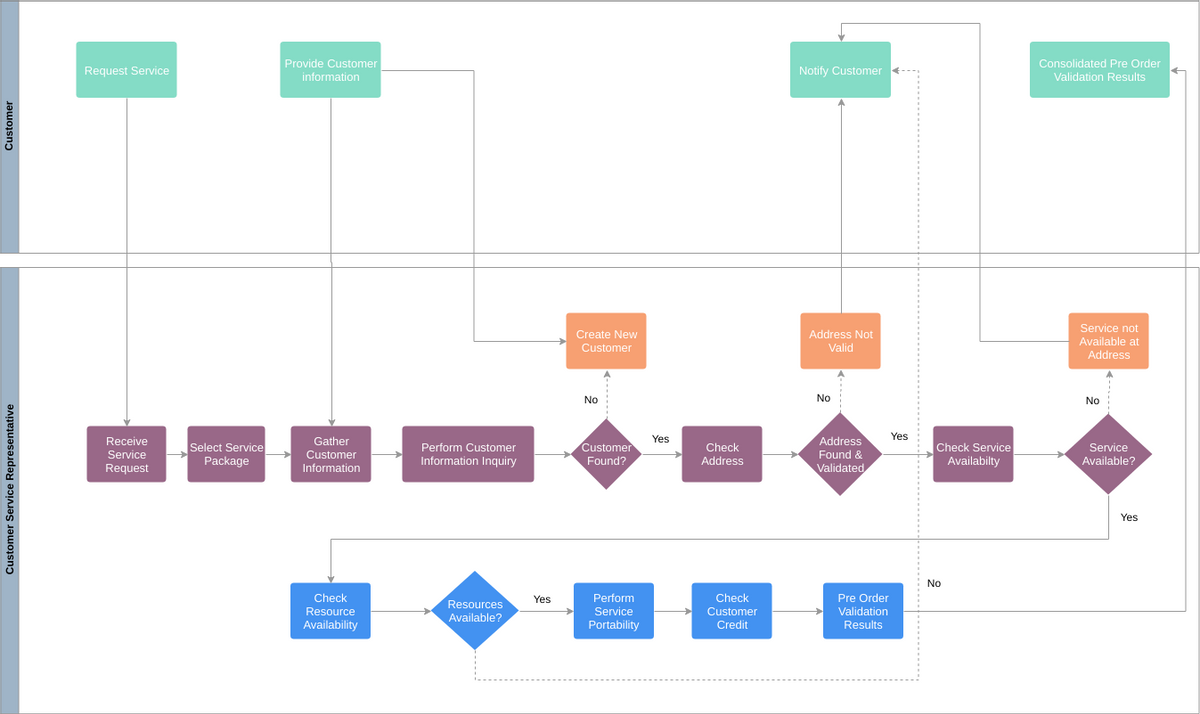
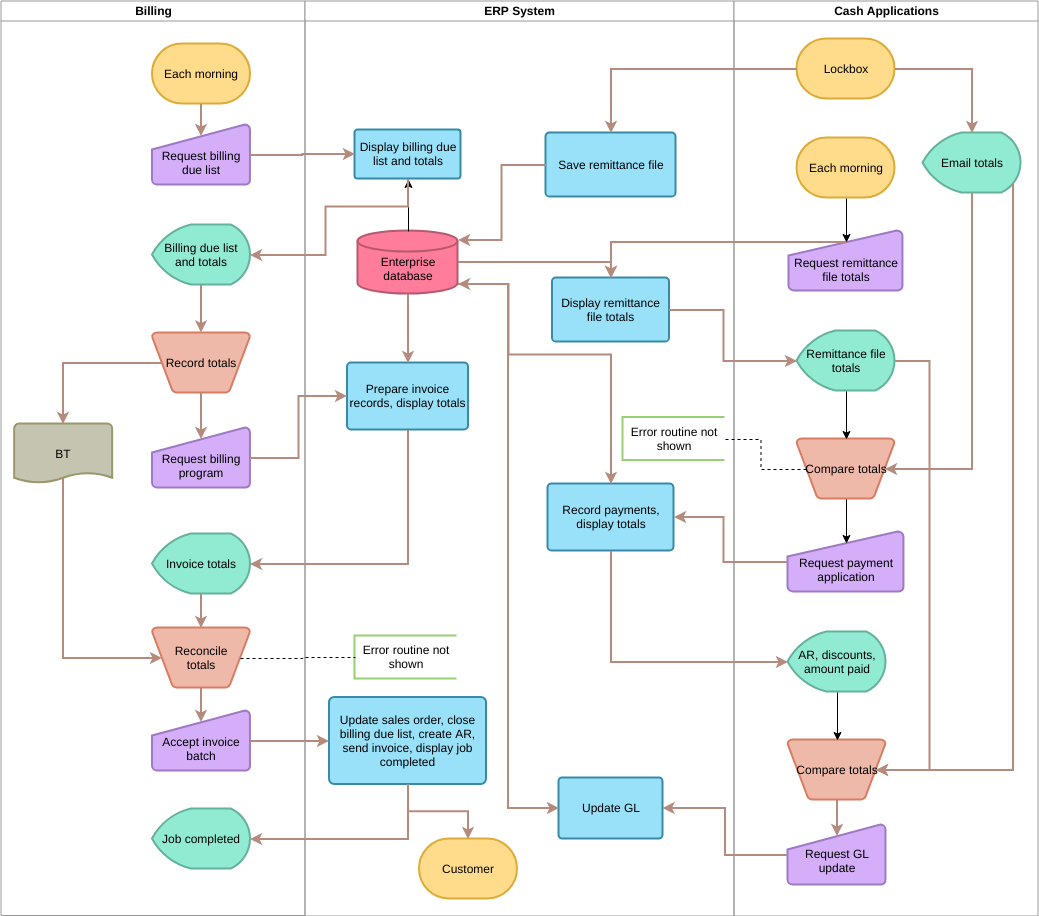
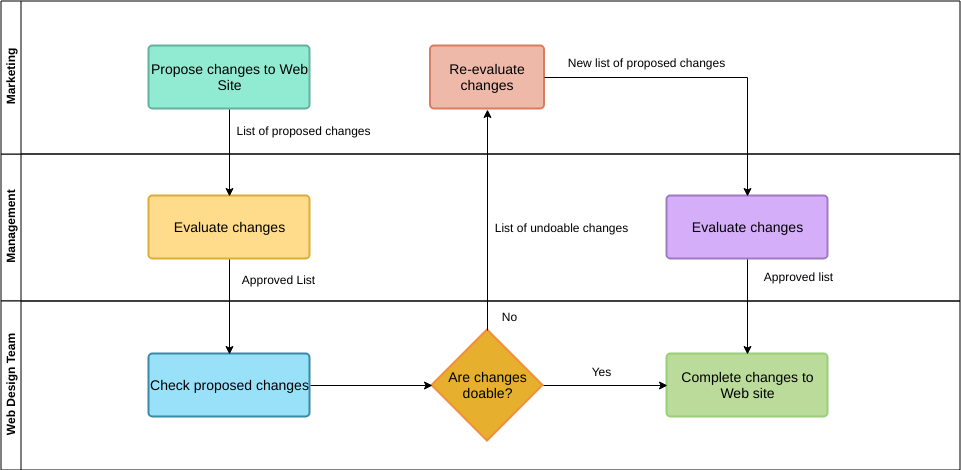
Diagram przepływu międzyfunkcyjnego jest często używany, gdy diagram przepływu jest podzielony na różne poziome lub pionowe sekcje, które służą do opisu różnych jednostek kontrolnych. Konkretna jednostka kontrolna pojawi się jako ikona wraz z określoną sekcją.
Diagramy przepływu międzyfunkcyjnego pozwalają mapującemu poprawnie przypisać odpowiedzialności do „kroków wykonania” lub „decyzji” oraz pokazać odpowiedzialności jednostek składowych za każdą różną część procesu.
Standardowe symbole diagramu przepływu
Diagram przepływu powszechnie używa symboli, aby wyrazić diagram przepływu w treści, aby inni mogli dokładnie i kompleksowo zrozumieć potrzebę użycia wspólnych, zunifikowanych symboli diagramu przepływu w diagramowaniu.
Obecnie Międzynarodowa Organizacja Normalizacyjna (ISO) i inne instytucje mają standardy symboli diagramu przepływu, które mogą być używane jako podstawa do rysowania, takie jak potrzeba użycia tego standardu w rzeczywistej pracy graficznej i innych symbolach, należy wziąć pod uwagę jego uniwersalność, starać się używać tego, co ma społeczność i co jest powszechne, w przypadku innowacji należy wskazać znaczenie i zastosowanie tych symboli oraz zwrócić uwagę na ten sam diagram i później w rzeczywistym rysunku, aby zachować niezbędną ciągłość i zredukować niepotrzebne rodzaje symboli.
Poniższa tabela przedstawia najczęściej używane symbole diagramu przepływu.
Inne dodatkowe symbole
Oprócz powyższych podstawowych symboli, przykłady są następujące
Wskazówki dotyczące tworzenia diagramu przepływu
Należy przestrzegać następujących wytycznych podczas przygotowywania diagramów przepływu.
- Podczas rysowania diagramów przepływu należy używać standardowych symboli.
- Upewnij się, że diagram przepływu ma punkt początkowy (lub początek) i punkt końcowy (lub koniec).
- Unikaj krzyżowania się linii procesów
- Zwykła orientacja diagramu przepływu to od góry do dołu lub z lewej do prawej.
- Symbole terminalne, tj. START/BEGIN lub STOP/END powinny mieć tylko jedną linię przepływu.
- Diagram przepływu powinien być schludny, czysty i łatwy do zrozumienia. Nie powinno być żadnych niejasności.
- Tylko jedna linia procesu powinna wychodzić z symbolu procesu.
- Tylko jedna linia procesu wchodzi do symbolu decyzji, ale mogą być dwie lub trzy linie procesu, jedna dla każdej możliwej odpowiedzi, wychodząc z symbolu decyzji.
- Jeśli diagram przepływu jest długi i złożony, należy użyć symboli łączników, aby zmniejszyć liczbę linii procesu.
- Użyj symboli adnotacji, aby jaśniej opisać kroki.
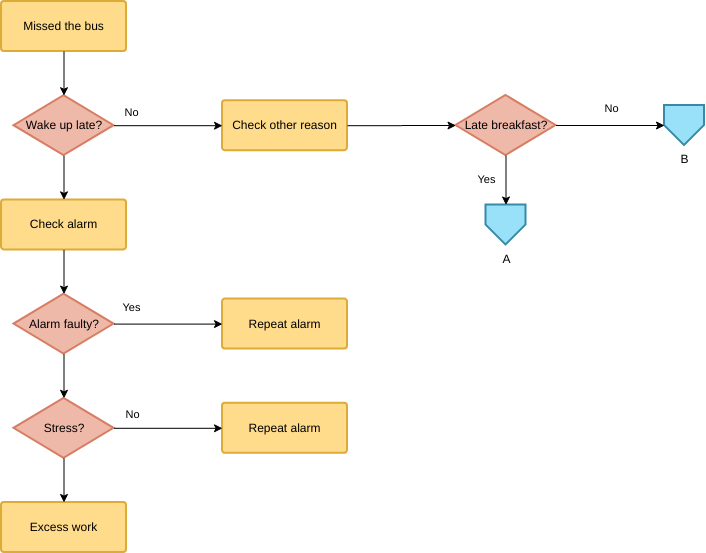
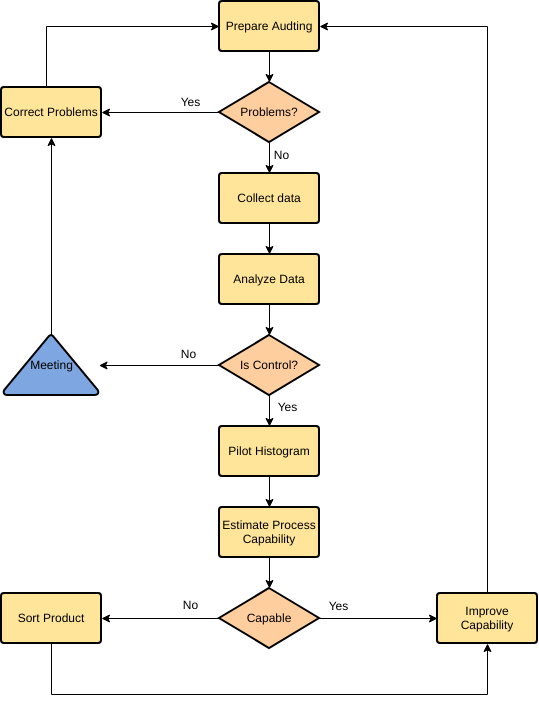
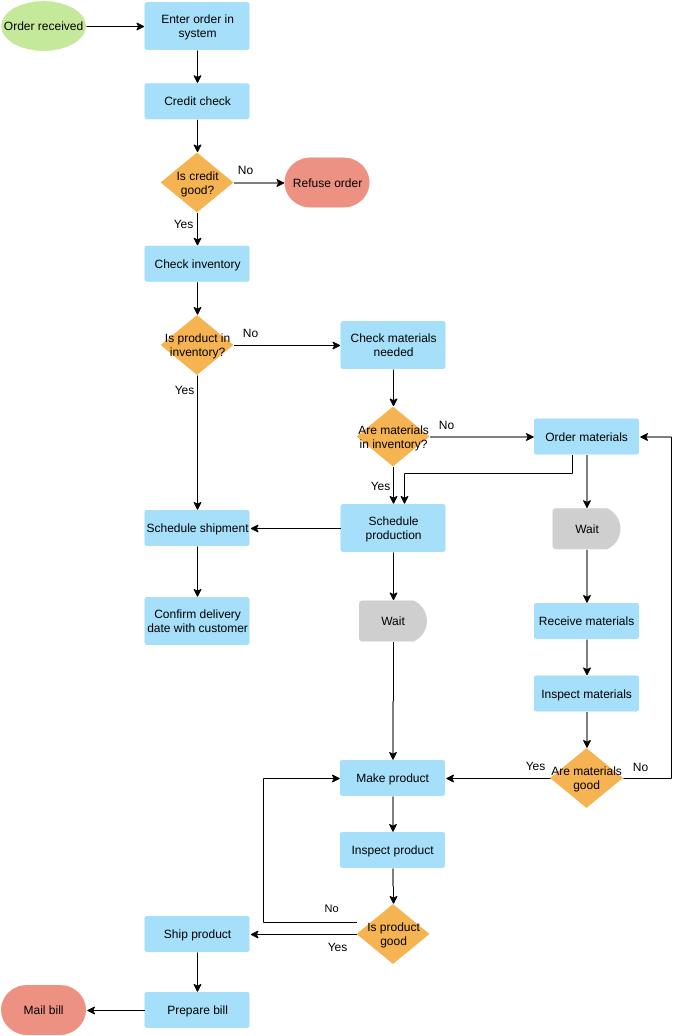
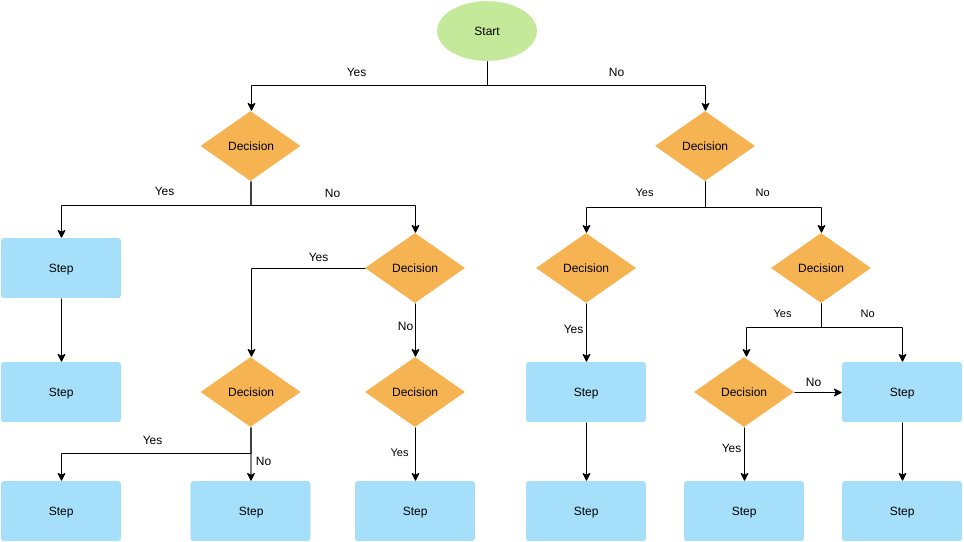
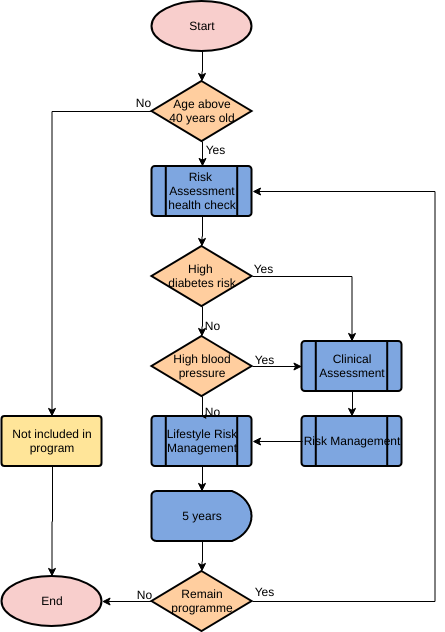
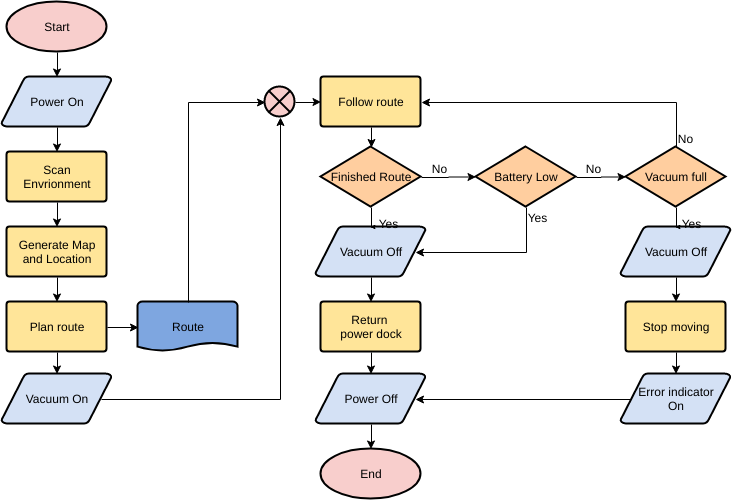
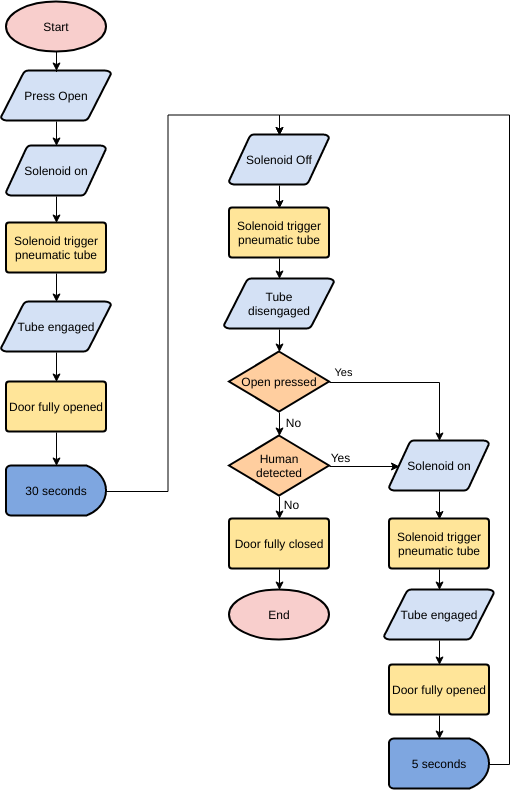
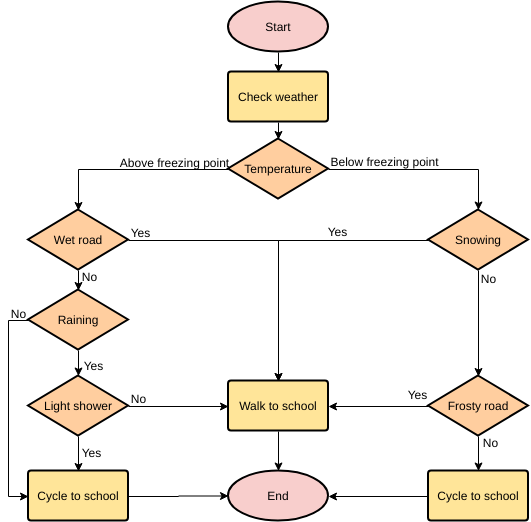
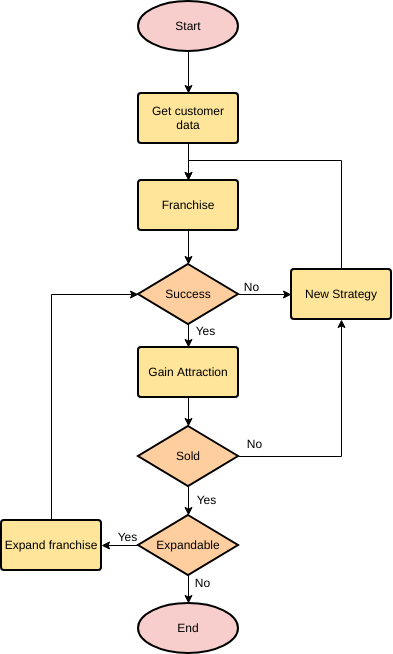
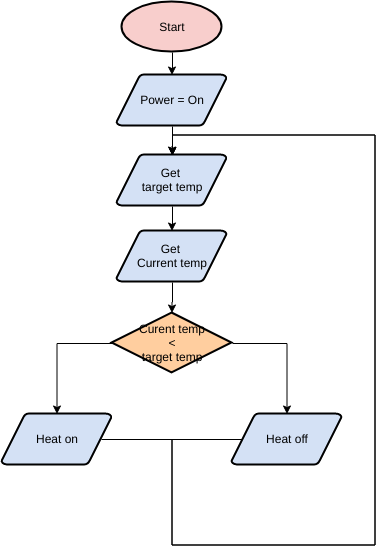
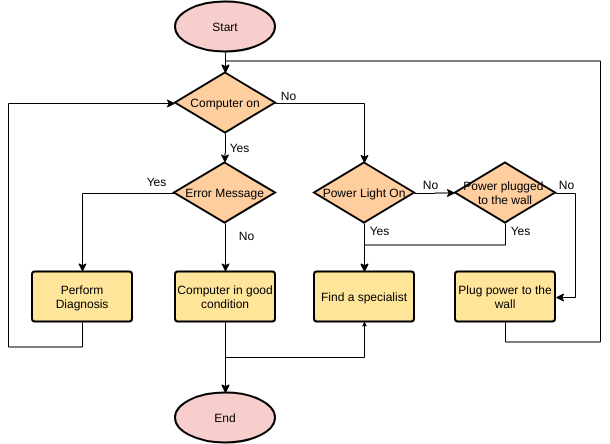
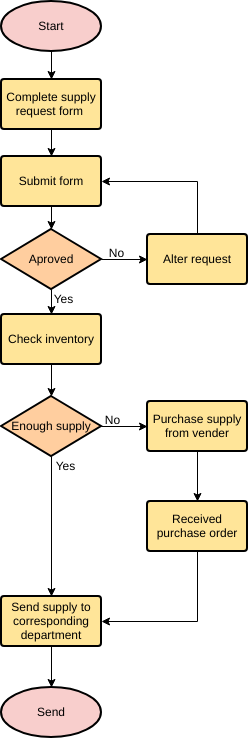
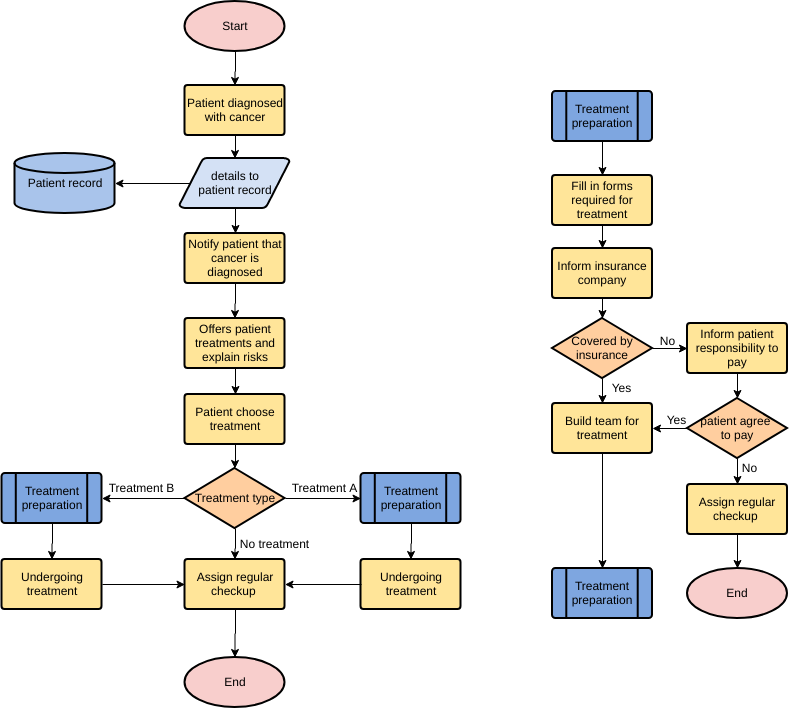
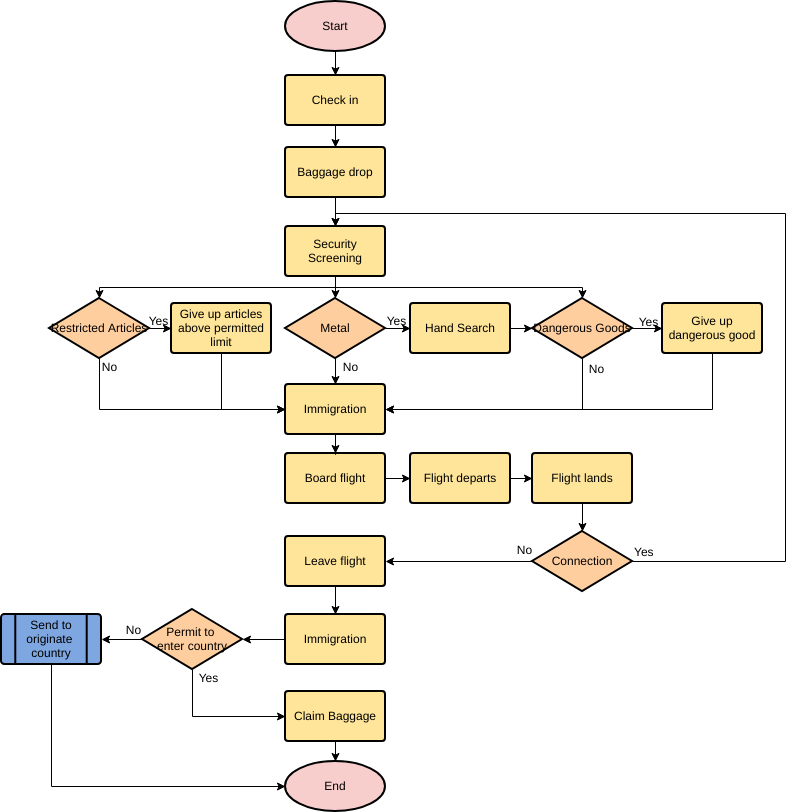
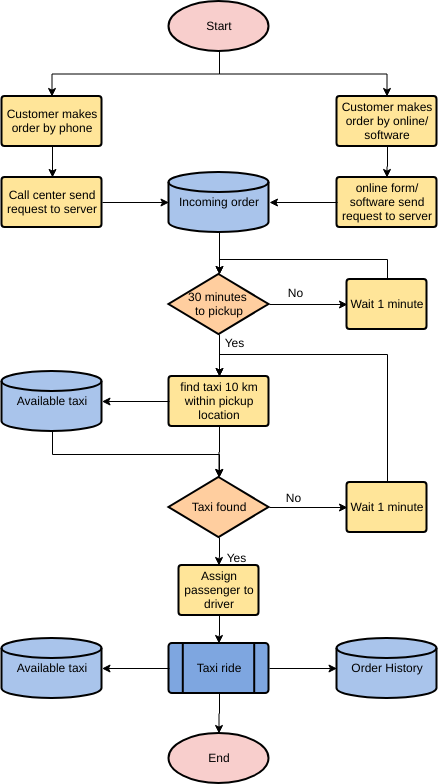
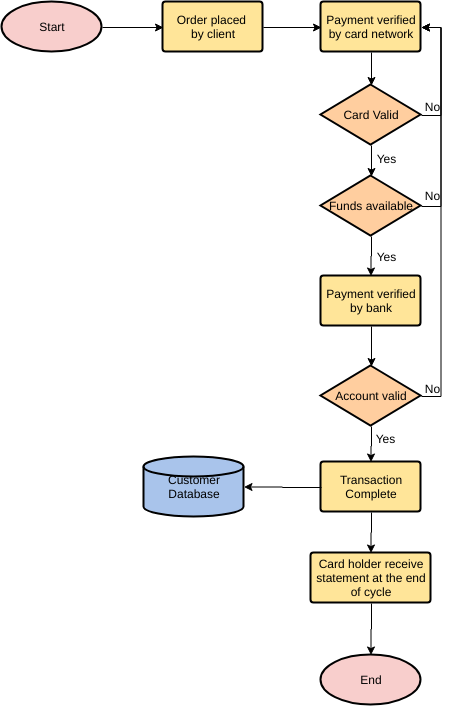
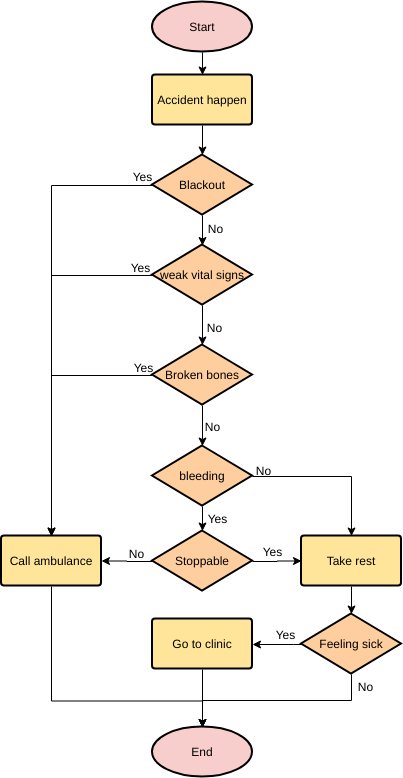
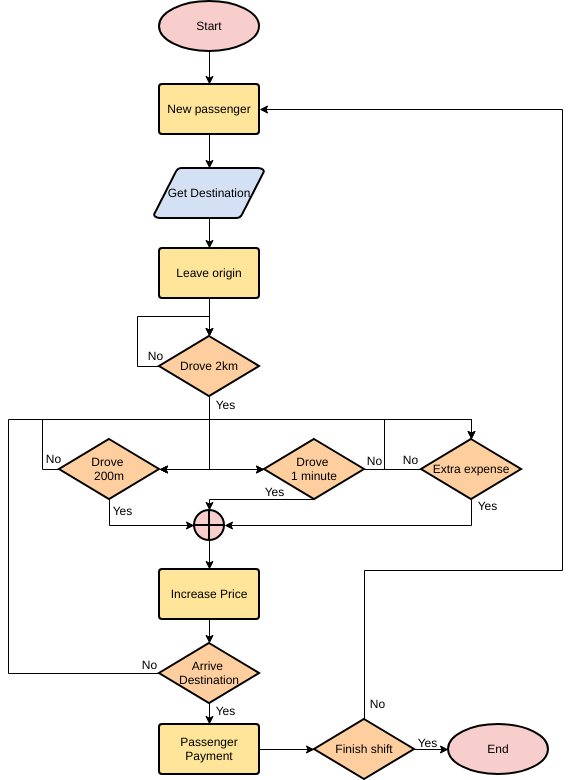
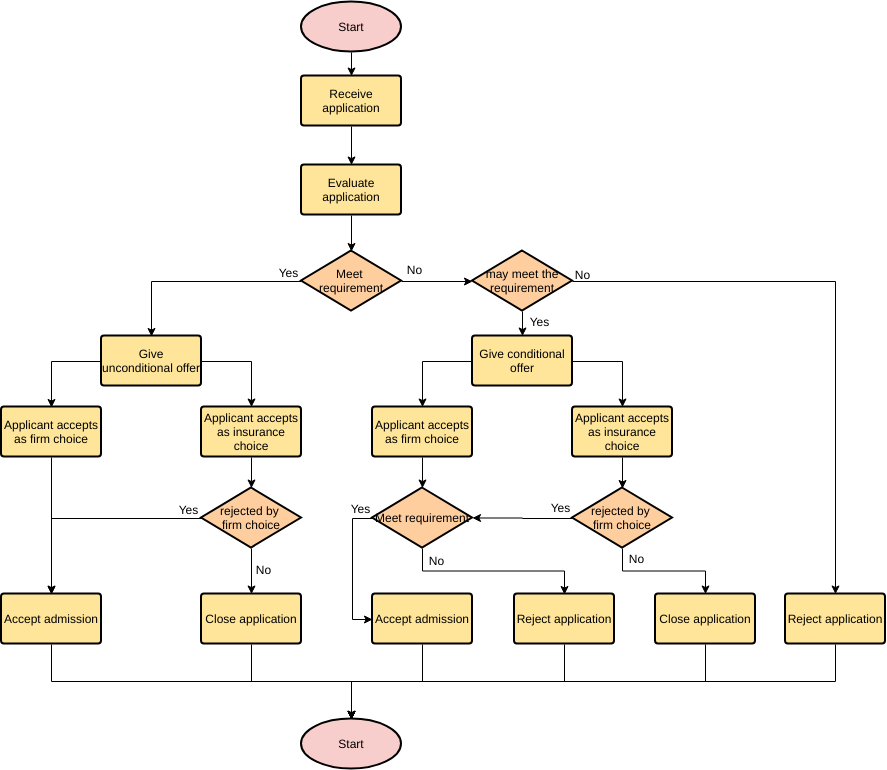
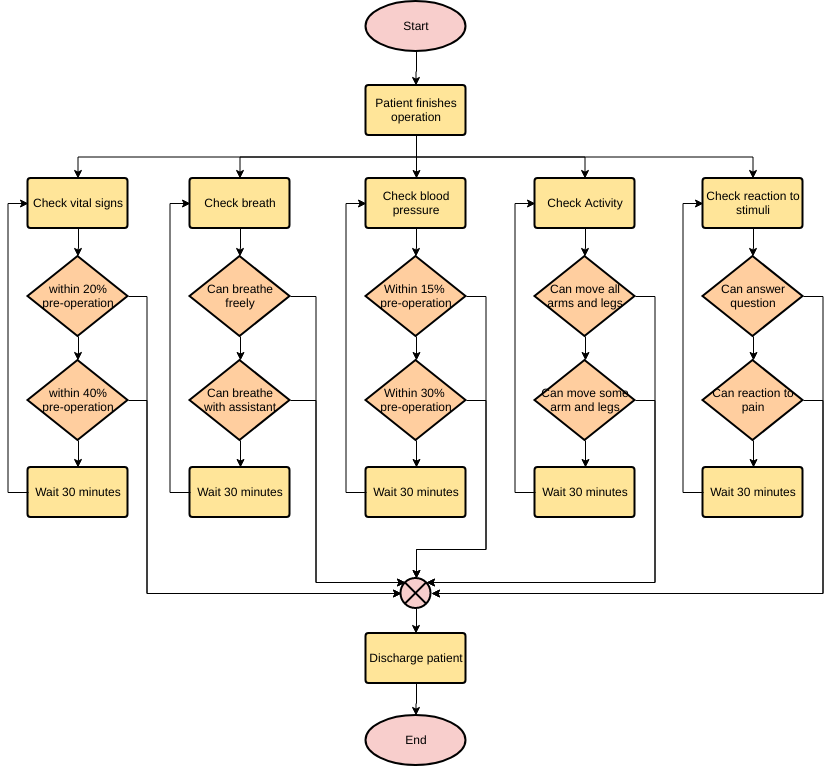
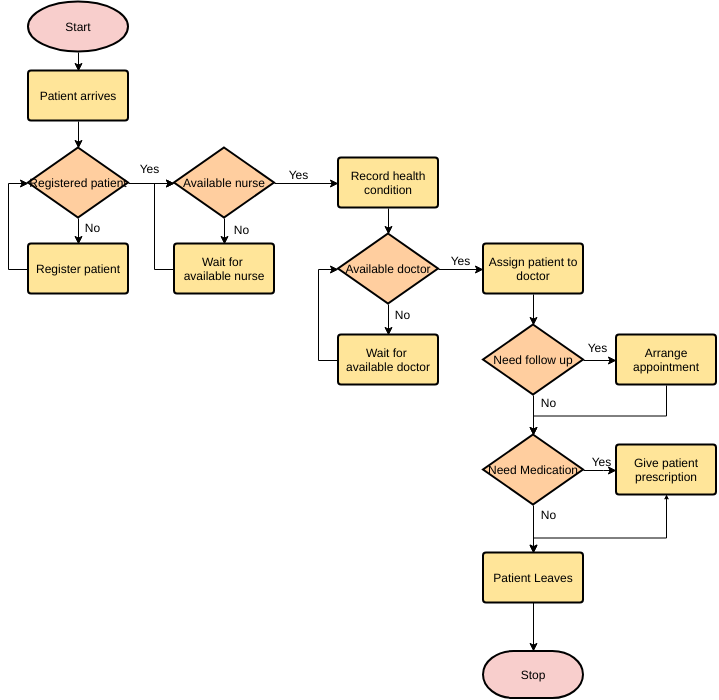
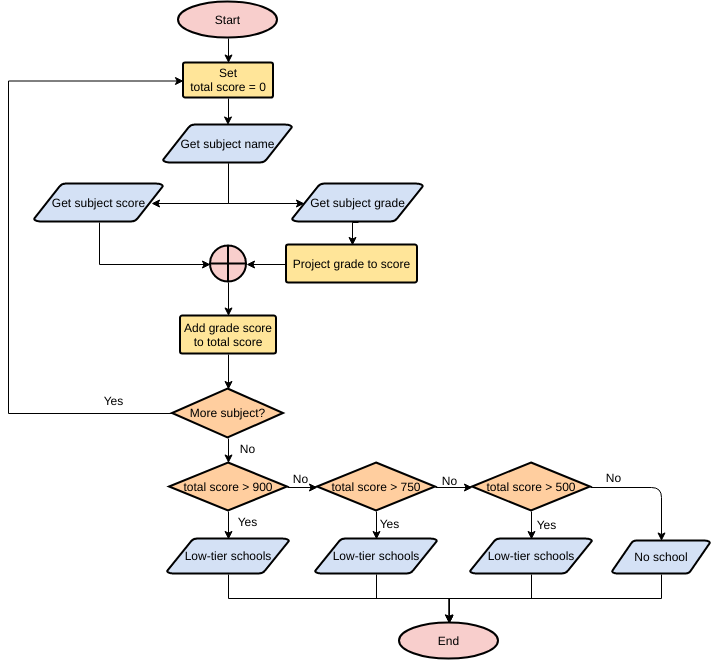
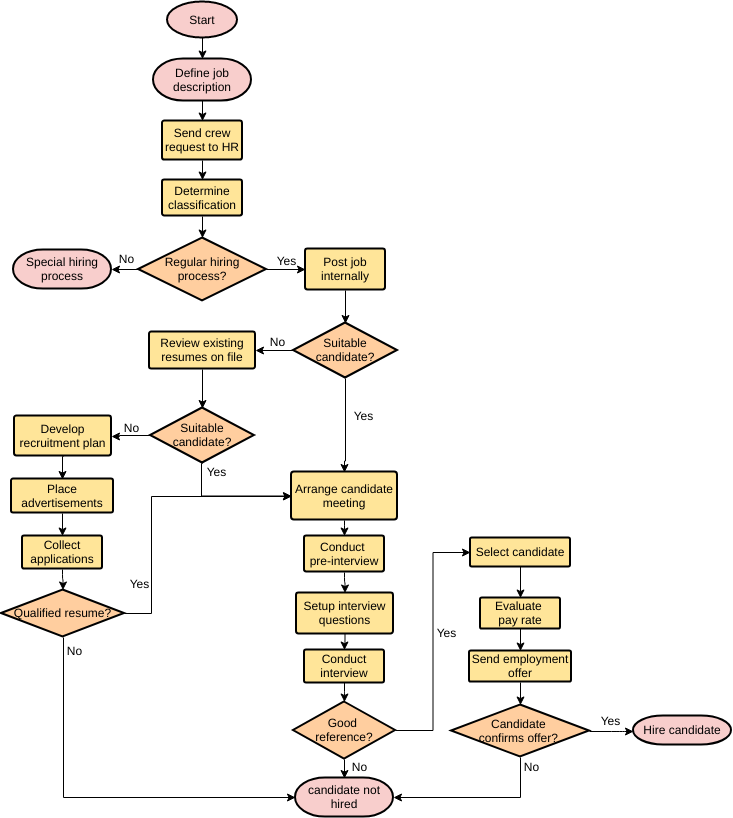
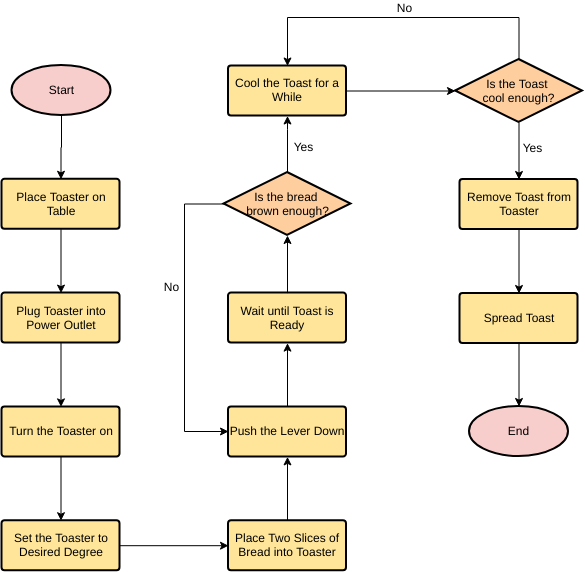
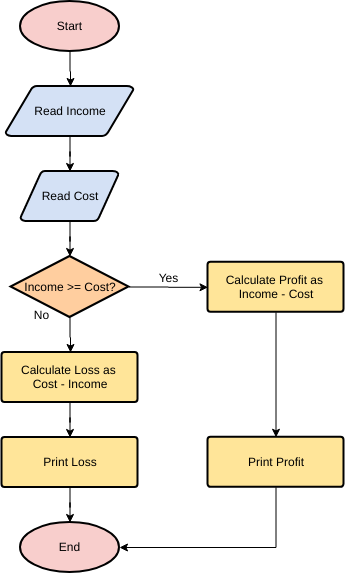
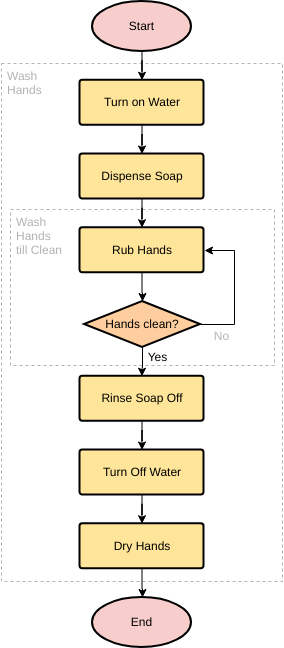
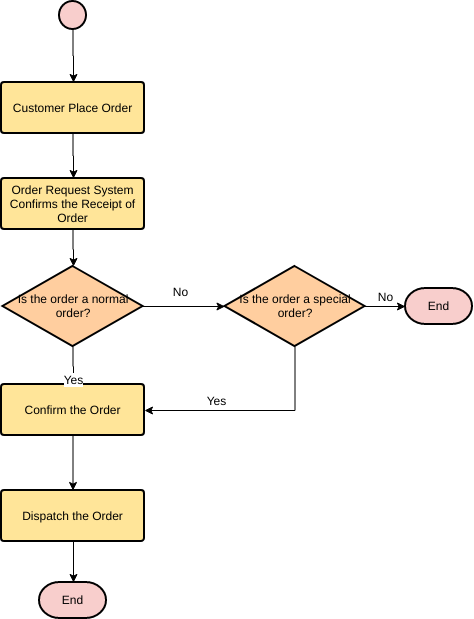
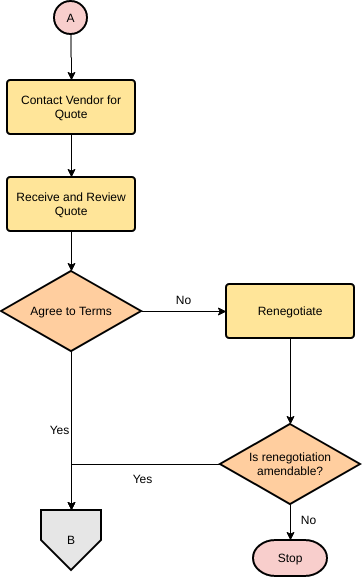
Nauka diagramu przepływu na przykładach
Zbadaj więcej szablonów diagramów przepływu międzyfunkcyjnego
Mapa procesu międzyfunkcyjnego ujawnia, kto co robi i kiedy, zorganizowana w sekcjach w diagramie przypominającym siatkę. Wykracza poza podstawową mapę procesu i pokazuje relacje między funkcjami (np. interesariuszami lub działami) a etapami (np. kamieniami milowymi) w procesie, oto kilka szablonów i przykładów diagramów przepływu międzyfunkcyjnego:
Ten post dostępny jest również w Deutsch, English, Español, فارسی, Français, Bahasa Indonesia, 日本語, Portuguese, Ру́сский, Việt Nam, 简体中文 and 繁體中文


