Visualize Data with Online Charts

Visualize Data with Online Charts

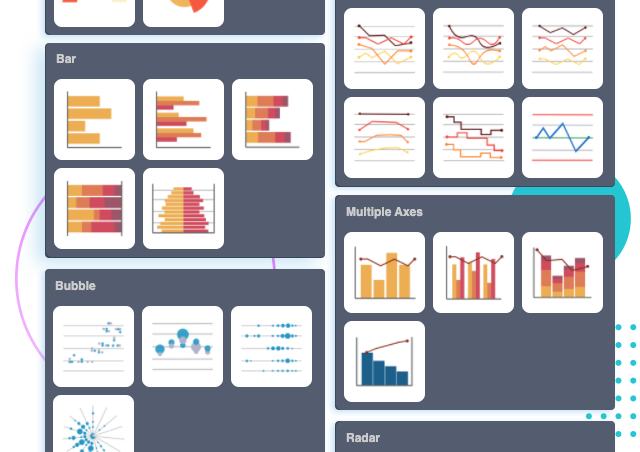
Choose from over 50 chart types to find the perfect representation of your data. Both common and advanced chart types are supported, including bar, line, area, pie, doughnut, radar, and rose charts. Visualize your data and statistics quickly and easily with Visual Paradigm’s online chart maker.

Continue reading
7 Powerful Strategic Analysis Toolset for your business

7 Powerful Strategic Analysis Toolset for your business

Strategic Analysis is a core step in the Strategic Learning Cycle. Every strategist should have a toolset of analytical models at his or her disposal. However, there are many techniques and tools available for strategy analysis. If you google around the web, you will find a long list of options available. The challenge is to acquire the right techniques and tools for a given business problem. This article give you a brief introduction for you to jumpstart the strategic analysis learning process.

Continue reading
On-the-fly FREE Online UML Software: 30 Class Diagram Examples

On-the-fly FREE Online UML Software: 30 Class Diagram Examples

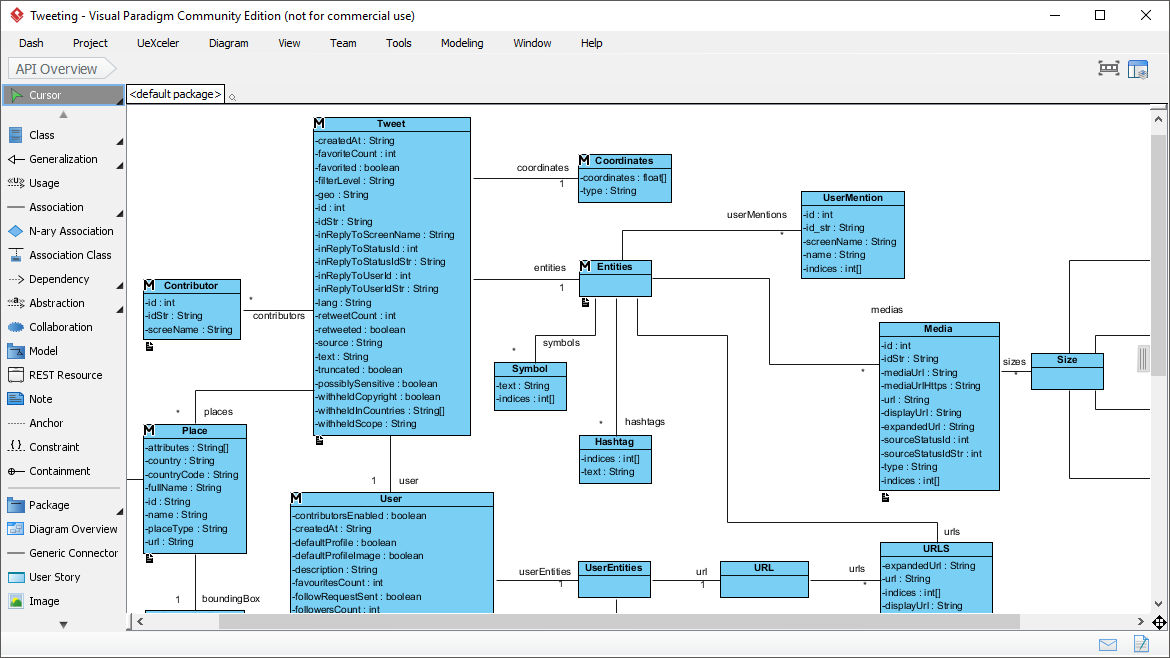
Visual Paradigm Online (VP Online) Free Edition is a free online drawing tool that supports UML, ERD, Organization Chart, etc. It features a simple, intuitive yet powerful UML editor, which allows you to create professional UML diagrams smoothly and quickly. The free UML tool comes with no ad, no limited period of access and no limitations such as, number of diagrams, number of shapes and etc. You own the diagrams you created for personal and non-commercial purposes.

Continue reading
AWS Architecture Diagram — with 2019 new icons & Over 50 examples

AWS Architecture Diagram — with 2019 new icons & Over 50 examples

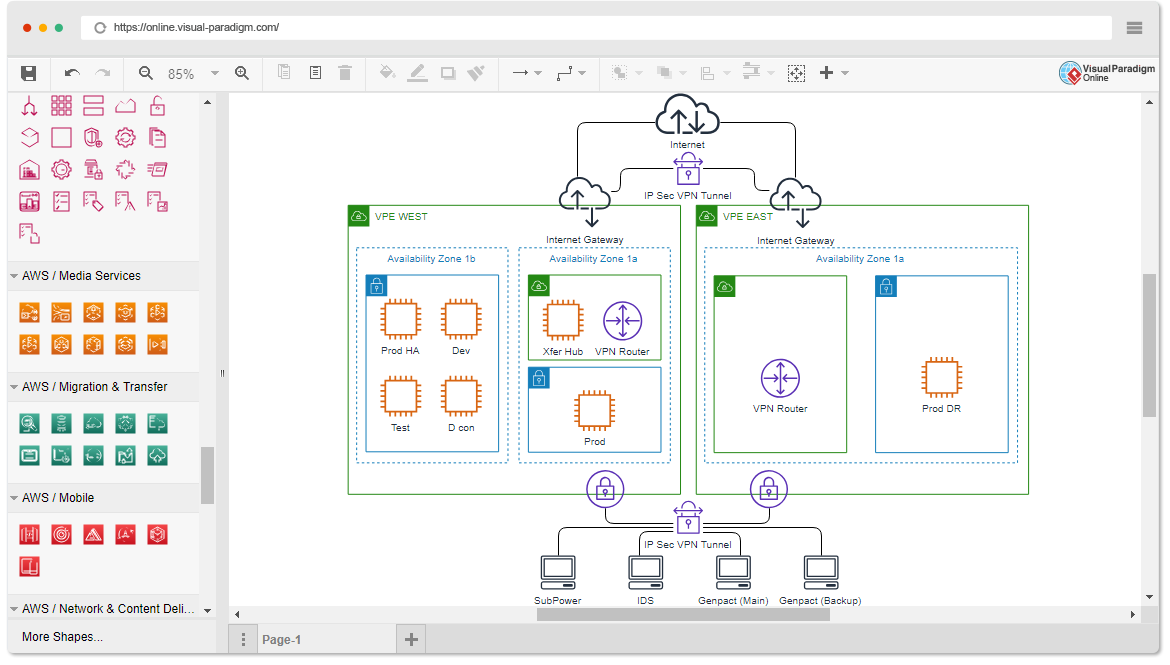
Try Visual Paradigm Online (VP Online) Free Edition. It is a FREE online diagramming software with support to AWS Architecture Diagram and many other diagrams such as UML, Org Chart, Floor Plan, wireframe, family tree, ERD, etc. You can easily draw AWS Architecture Diagrams through the simple, intuitive diagram editor. As a real free AWS Architecture Diagram tool, there is no ad, no limited period of access and no limitations such as, number of diagrams, number of shapes and etc. You own the diagrams you created for personal and non-commercial purposes.

Continue reading
AWS Architecture Diagram — with 2019 new icons & Over 50 examples

AWS 2019 Update — The Most Powerful AWS Architecture Design Tool

The latest update of Visual Paradigm Online supports creating AWS architecture diagram with the new AWS icons released officially in 2019. Amazon Web Services (AWS) have officially released a complete overhaul of their AWS Architecture Icons. The latest update of Visual Paradigm Online have made the new AWS icons available. Users can now create AWS architecture diagram with the latest and greatest AWS architecture icons, or keep using the previous AWS icon set, at their own choice.

Continue reading
The Best Easy Dashboard for BI 2019

The Best Easy Dashboard for BI 2019

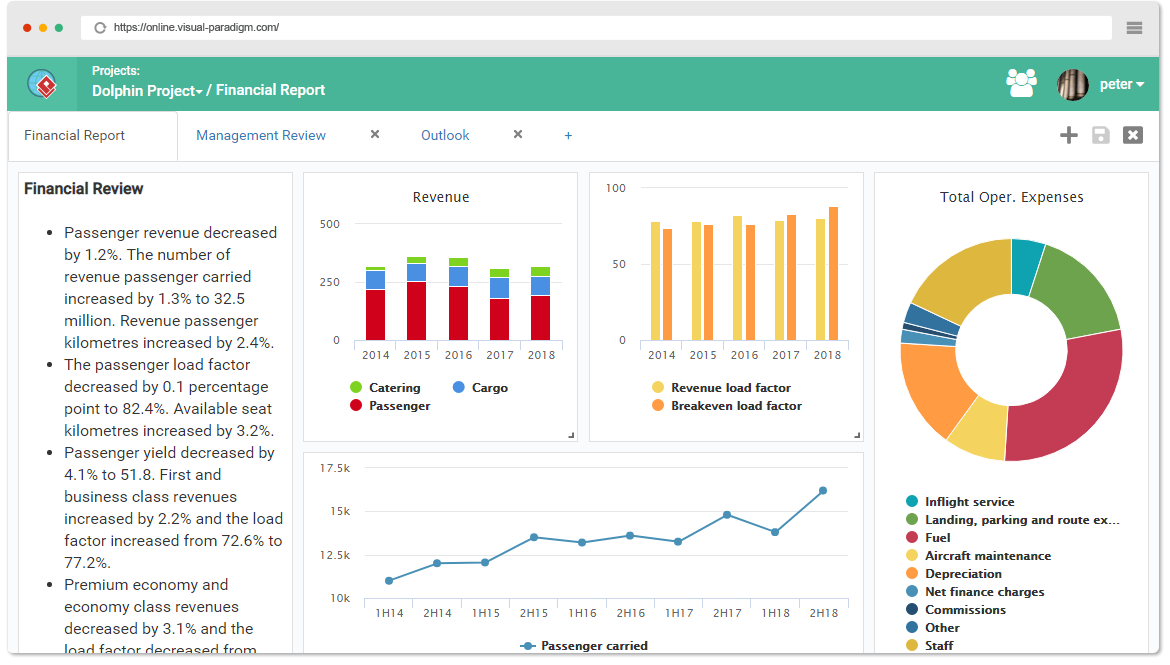
The latest update of Visual Paradigm Online features a powerful dashboard software, which is a highly configurable data visualization tool that help people see and understand their data easily. Visual Paradigm Online helps you visualize your data into valuable insights. Build dashboards and perform ad-hoc data analyses in just a few steps. A wide range of chart and graph are available to fulfill different business needs. Together with the intuitive spreadsheet editor, anyone can visualize data in few minutes. No coding, just insight.

Continue reading
Automated Tool — Do-it-Yourself Project Manager

Automated Tool — Do-it-Yourself Project Manager

Businesses, large and small, unquestionably juggle numerous projects, plans, tasks and people. The primary purpose of project management software is to help managers plan, execute and control all aspects of the project management process (such as PMBOK or PRINCE2). Visual Paradigm helps your team to kick-start any size of IT projects with automated guide-through process, with step-by-step instruction, input references and samples.

Continue reading
The Best Online Flowchart Software 2019

The Best Online Flowchart Software 2019

The flowchart is only a graphical representation of the steps. It displays steps in a sequential manner and is widely used to display algorithm flow, workflow or process. It is a diagram that uses different symbols to represent a process. These symbols contain information about steps or sequence of events. Each symbol is connected with an arrow to indicate the process direction of the process.

Continue reading