Wykresy techniki przeglądu oceny programu (PERT) Wykres PERT to narzędzie do zarządzania projektami, które zapewnia graficzną reprezentację harmonogramu projektu, umożliwiając analizę poszczególnych zadań projektu.
Wykres PERT przedstawia każde zadanie w projekcie jako węzeł. Zależności między zadaniami (np. gdy jedno zadanie wymaga ukończenia innego przed rozpoczęciem) są wyraźnie pokazane przez połączenia między węzłami zadań. Pokazuje również informacje o czasie dla każdego zadania, które są podobne do metody ścieżki krytycznej (CPM), która identyfikuje najdłuższą ścieżkę przez projekt, a tym samym minimalny czas potrzebny na ukończenie projektu.
Cel wykresów PERT
Menedżerowie projektów mogą używać wykresów PERT do:
- ustalenia realistycznego harmonogramu ukończenia projektu
- zapewnienia, że uwaga jest skupiona na najważniejszych zadaniach dla ścieżki krytycznej – ponieważ ścieżka prowadzi do minimalnego czasu, jaki projekt wymaga, wszelkie opóźnienia w tych zadaniach spowodują opóźnienie całego projektu
- identyfikacji zadań, które muszą być skrócone, jeśli czas całego projektu musi być zmniejszony
- identyfikacji zadań, które mogą być realizowane jednocześnie
- identyfikacji czasu luzu, w którym niektóre zadania nie są tak krytyczne czasowo dla ogólnego terminu.
Ulepszony wykres PERT z Visual Paradigm
Tradycyjny wykres PERT to narzędzie do zarządzania projektami, które służy do planowania, organizowania i koordynowania zadań w projekcie.Ulepszony narzędzie wykresu PERTdodaje cztery dodatkowe funkcje do integracji z różnymi blokami budowlanymi Visual Paradigm. Możesz to wszystko zrobić w ulepszonym modelarzu wykresu PERT.
- Wybór osoby odpowiedzialnej (przypisanie zadania osobie odpowiedzialnej)
- RACI oparte na zadaniach (Odpowiedzialny — Zobowiązany — Konsultowany — Informowany)
- Zadanie do Menedżera Zadań (Visual Paradigm Tasifier)
- Zautomatyzowany RACI w Menedżerze Zadań
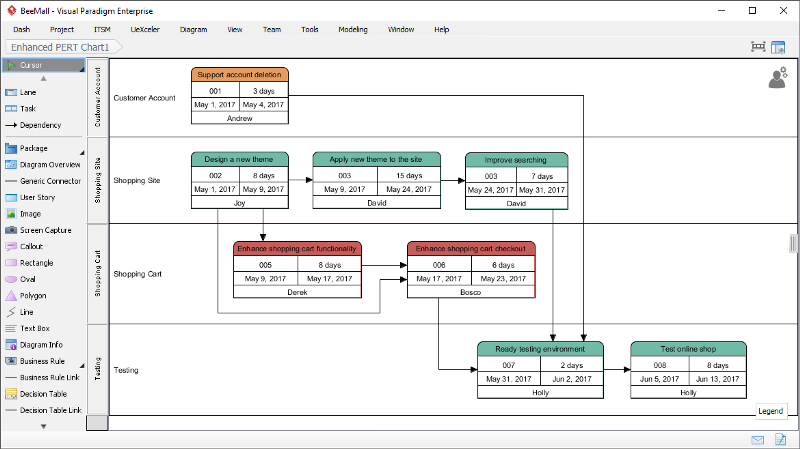
Przypisanie osoby odpowiedzialnej
Jeśli korzystasz z naszego rozwiązania zespołowego, takiego jak VP Online lub Teamwork Server, możesz wybrać członków zespołu jako osoby odpowiedzialne za zadania w wykresie PERT. To znacznie ułatwia i zwiększa efektywność planowania zadań.
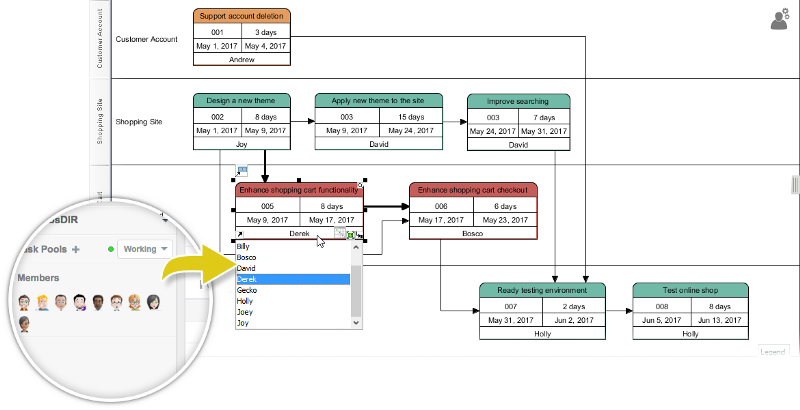
RACI dla każdego zadania
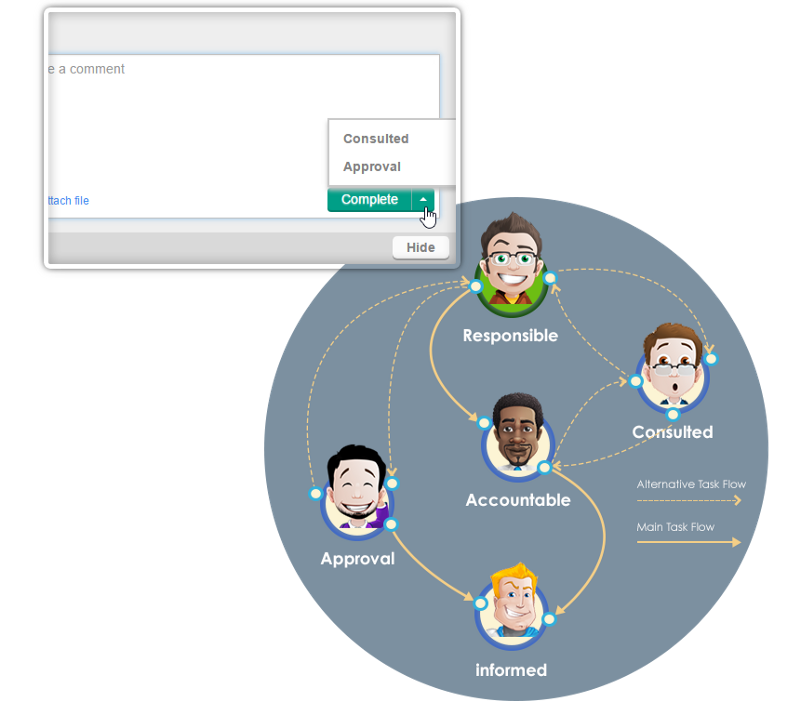
Oprócz tego, kto jest odpowiedzialny za jakie zadanie(a), możesz dodatkowo przedstawić szczegółowe role (Odpowiedzialny — Zobowiązany — Konsultowany — Informowany) dla konkretnego zadania. Jeśli zsynchronizujesz wykres PERT z menedżerem zadań, zobaczysz zadania pojawiające się na liście członka, który jest za nie „Odpowiedzialny”. A gdy członek ukończy zadania, to konkretne zadanie zostanie pokazane, zgodnie z schematem przepływu RACI odpowiednich członków.
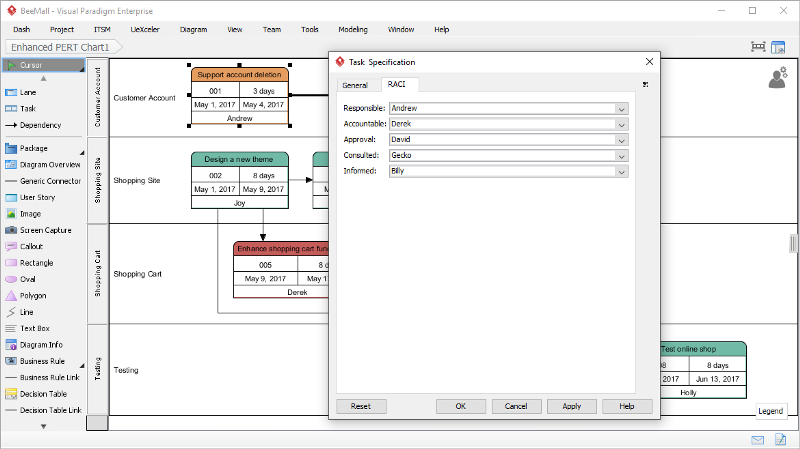
Generowanie zadań z wykresu PERT
Gdy zakończysz tworzenie podstawy harmonogramu za pomocą ulepszonego wykresu PERT, możesz zsynchronizować zadania z wykresu PERT z menedżerem zadań. Zadania zostaną automatycznie wygenerowane i przypisane do odpowiednich członków. Możesz je przeglądać zarówno w widoku projektu, jak i w widoku członka.
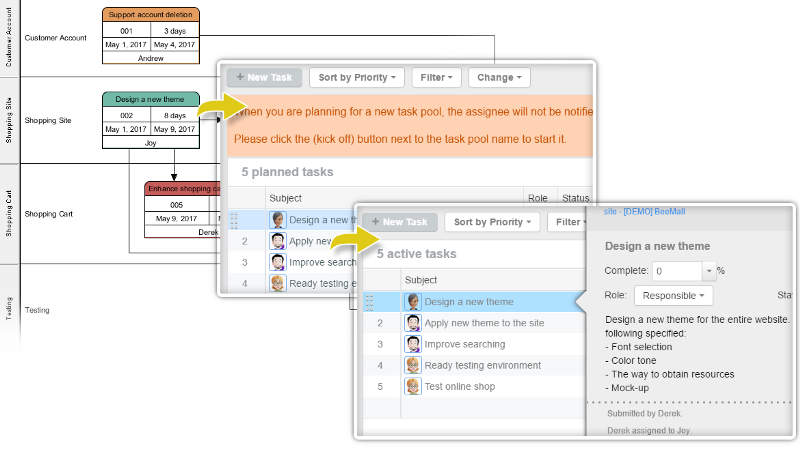
Wykonaj wykres PERT w akcji
Jak wspomniano, gdy synchronizujesz zadania w wykresie PERT z Menedżerem Zadań, na początku zobaczysz tylko zadania przypisane do członków, którzy są za nie odpowiedzialni. Ale gdy zadanie zostanie oznaczone jako ukończone przez członka, zadanie przepłynie do innego członka, który jest Zobowiązany / Konsultowany / Informowany zgodnie z schematem przepływu zadań.
Przykłady PERT do samodzielnego wykonania
Kliknij i spróbuj samodzielnie z Visual ParadigmPrzykłady online
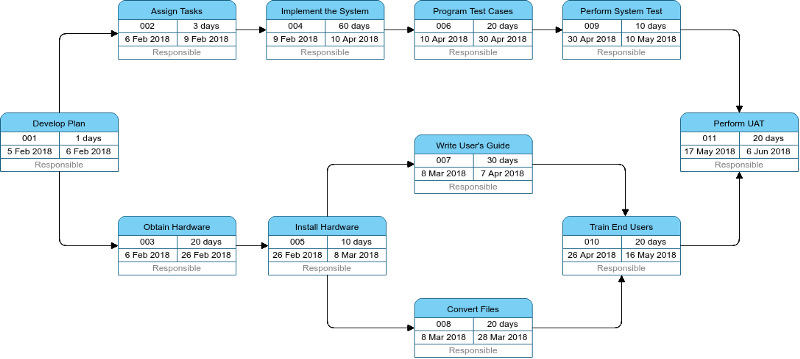

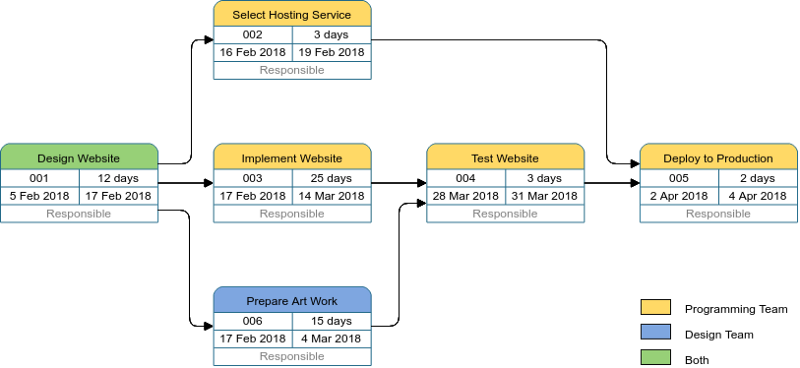
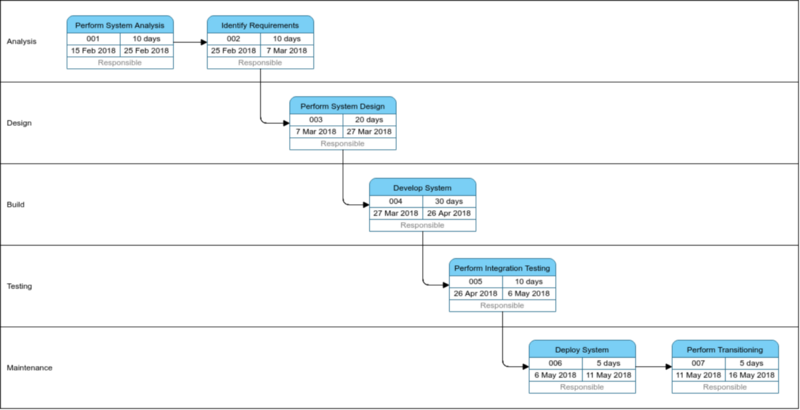

Opracuj wykres PERT z listy zadań strukturalnych
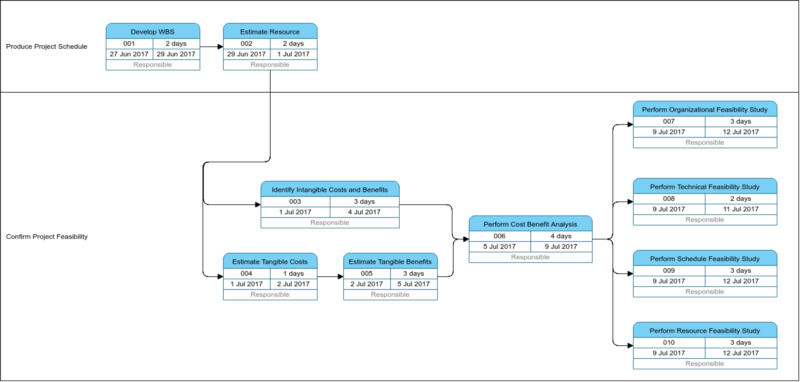
Ulepszony wykres PERT do automatyzacji zarządzania zadaniami
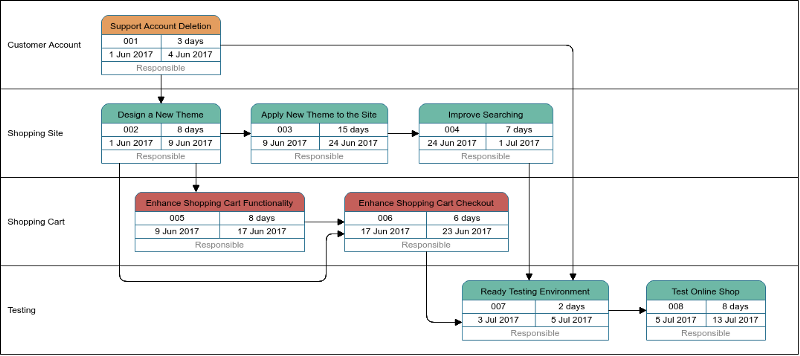
Przykład rozwoju oprogramowania
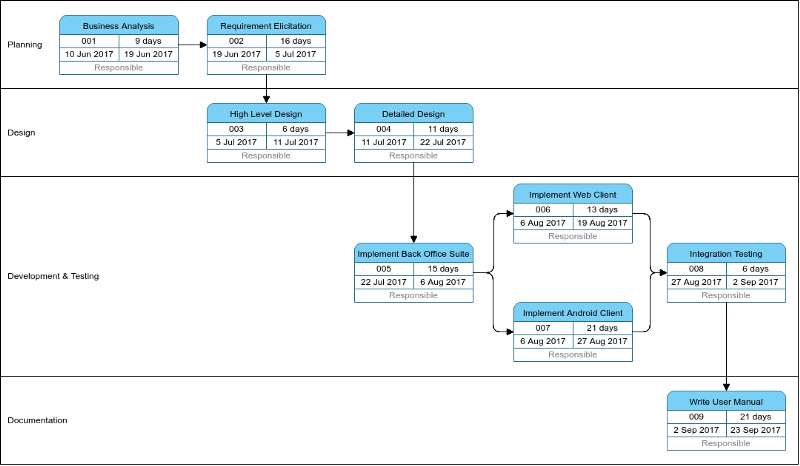
Powiązane artykuły Visual Paradigm Online na temat wykresu PERT
Ten post dostępny jest również w Deutsch, English, Español, فارسی, Français, Bahasa Indonesia, 日本語, Portuguese, Ру́сский, Việt Nam, 简体中文 and 繁體中文


